

Abstract
Nicotinamide (NAM) plays essential roles in physiology through facilitating NAD+ redox homeostasis. Importantly, at high doses, it protects cells under oxidative stresses, and has shown therapeutic effectiveness in a variety of disease conditions. In our previous studies, NAM lowered reactive oxygen species (ROS) levels and extended cellular life span in primary human cells. In the treated cells, levels of NAD+/NADH and SIRT1 activity increased, while mitochondrial content decreased through autophagy activation. The remaining mitochondria were marked with low superoxide levels and high membrane potentials (Δψm); we posited that the treatment of NAM induced an activation of mitophagy that is selective for depolarized mitochondria, which produce high levels of ROS. However, evidence for the selective mitophagy that is mediated by SIRT1 has never been provided. This study sought to explain the mechanisms by which NAM lowers ROS levels and increases Δψm. Our results showed that NAM and SIRT1 activation exert quite different effects on mitochondrial physiology. Furthermore, the changes in ROS and Δψm were not found to be mediated through autophagy or SIRT activation. Rather, NAM suppressed superoxide generation via a direct reduction of electron transport, and increased Δψm via suppression of mitochondrial permeability transition pore formation. Our results dissected the effects of cellular NAD+ redox modulation, and emphasized the importance of the NAD+/NADH ratio in the mitochondria as well as the cytosol in maintaining mitochondrial quality.
Keywords: membrane potential, mitochondria, mitophagy, mPTP, nicotinamide, SIRT1, superoxide
INTRODUCTION
Nicotinamide (NAM), as a precursor of nicotinamide adenine dinucleotide (NAD+), is a vitamin B3. However, high dose NAM is therapeutically effective in a variety of diseases or conditions. Oral or other routes administration of NAM has been shown potent in animals or in clinical trials against skin disorders (Oblong, 2014), diabetes mellitus (Stevens et al., 2007), cancer metastasis (Santidrian et al., 2014), cerebral ischemia (Ayoub and Maynard, 2002; Lee et al., 2006; Sakakibara et al., 2000), multiple sclerosis (Kaneko et al., 2006), Alzheimer disease (Bayrakdar et al., 2014), viral and microbial infections (Murray, 2003), and inflammatory diseases (Maiese et la., 2009). It also protects neurons and vascular cells from ischemic reperfusion and other oxidative stresses (Chong et al., 2002; Crowley et al., 2000; Kiuchi et al., 2002). Currently, NAM is available in high dose forms on the market, and therefore, actively used for subclinical purposes as well. To develop further application and to ensure safety and optimal therapeutic strategies, the mechanisms underlying NAM’s positive and side effects should be cleared.
Studies indicate that at least some of NAM’s effects are derived from its conversion to NAD+ and subsequent increase of NAD+ level and its redox, i.e., NAD+/NADH ratio. NAD+ and NAD+ redox are important in energy metabolism and mitochondrial function (Li et al., 2004). High NAD+ redox also plays critical roles by activating SIRT1 and other sirtuin family proteins, which play important roles in cellular health and longevity by modulating metabolism as well as mitochondria function and quality (Yao et al., 2014). Mitochondrial quality is believed to be maintained through the combined processes of biogenesis and clearance. And, clearance of depolarized mitochondria occurs through autophagy (mitophagy) (Dengjel and Abeliovich, 2016; Narendra et al., 2008; Twig et at., 2008). The best known for mitophagy, specifically relating to depolarized ones, may be the pathway mediated through the PTEN-induced putative kinase 1 (PINK1) and Parkin proteins (Lee et al, 2008; Narendra et al., 2008). However, the mechanism by which Parkin promotes mitophagy is not clearly understood. It is also not known whether mitophagy via the PINK1-Parkin pathway actively participates in the basal level mitochondrial turnover. Recently, SIRT1, an NAD+-dependent protein deacetylase, has emerged as a key molecule for basal level autophagy. It activates autophagosome formation through deacetylating key autophagy-related (Atg) molecules (Lee et al, 2008) and facilitates cytosolic localization of microtubule-associated protein 1A/1B light chain 3A (LC3) (Huang et al., 2008). SIRT1 activity declines during senescence progression and cellular aging (Sasaki et al., 2006; Saunders et al., 2010; Thompson et al., 2014), and this change in SIRT1 activity may be responsible for the similar decline of mitophagy during senescence progression and aging. Although it is conceivable that SIRT1 activation enhances mitophagy, whether SIRT1 is actively involved in mitophagy that is selective for depolarized ones is not known.
Our previous studies on the cell-beneficial effects of NAM showed that NAM decreases mitochondrial superoxide levels in both short-term cultures as well as lifespan-long cultures of human cells and the treatment resulted in substantial extensions of proliferative potential in normal fibroblasts, keratinocytes, and immune cells (Choi et al., 2015; Kang and Hwang, 2009; Kang et al., 2006). In the treated cells, mitochondria content decreased through autophagy activation. We posited that mitochondrial autophagy was mediated by SIRT1 activation, driven by the NAM-induced increases in the NAD+/NADH ratio (Jang et al., 2012). Importantly, the mitochondria in the NAM-treated cells were marked with high membrane potentials (Δψm). These suggested that NAM treatment may cause SIRT1-mediated activation of mitophagy that is selective for mitochondria that suffer from low Δψm and high levels of ROS generation. This also suggested that NAM treatment could be used as a strategy to enhance mitochondrial quality through activation of selective mitophagy in normally proliferating cells. However, direct evidence that shows the occurrence of selective mitophagy has not been demonstrated and explanations for the mechanisms by which levels of mitochondrial superoxide and Δψm change upon NAM-treatment have also not been found. Peculiarly, treatment using SIRT1 activators did not induce increases in Δψm, although it did cause substantial decreases in cellular mitochondrial content (Jang et al., 2012). This may suggest separate mechanisms for the alterations of mitophagy and Δψm that are induced by NAM. These studies propose that elucidating the mechanisms of NAM action is important not only for the cell-beneficial effects of NAM in various pathological conditions (Maiese, 2009), but also for possible extension of its usefulness to the aspects of cellular longevity and anti-aging. Also, it would help identifying the roles of SIRT1 in mitochondria quality maintenance.
In this study, for these reasons, the mechanisms by which NAM lowers cellular ROS levels while increasing Δψm were sought. Unexpectedly, our results clearly ruled out the involvement of autophagy, the PINK1-parkin pathway, and SIRT1 in causing these changes. Rather, it appears that NAM suppresses superoxide generation via reduction of electron transport and increases Δψm via downregulation of mitochondrial permeability transition pore (MPTP) formation.
MATERIALS AND METHODS
Cell culture and chemicals
Normal human fibroblasts from newborn foreskin were provided by Dr. JH Chung (Seoul National University, Korea). Cells at an early passage were cultured in Dulbecco’s modified Eagle’s medium containing 10% fetal bovine serum (S-FBS-US-015; Serana, Australia), with or without 5 mM NAM (N0636; Sigma-Aldrich, USA). To knock down the expression of SIRT1 or Parkin, cells were transfected with siRNA using Lipofectamine RNAiMAX (13778-150; Invitrogen, USA) according to the manufacturer’s protocol. All chemicals were purchased from Sigma-Aldrich unless stated otherwise.
Analysis of the contents of mitochondria, ROS, and Δψm
Cells were stained with 50 nM 10-N-nonyl acridine orange (NAO) or 2 μM dihydroethidium (DHE) (both from ThermoFisher, USA) to measure levels of mitochondrial content or superoxide. After washing in PBS, cells underwent flow cytometry using a FACS Canto II (BD Biosciences, USA). To measure Δψm, cells were incubated with 0.3 μg/ml 5,5′,6,6′-tetrachloro-1,1′,3,3′-tetraethylbenzimidalohylcarbocyanine iodide (“JC-1 dye”, Cat. #T3168, ThermoFisher) for 30 min and subjected to flow cytometry. After excitation at 488 nm, emissions at 530 nm (FL-1) and 585 nm (FL-2) were measured for fluorescence from monomeric JC-1 and JC-1 aggregates, respectively. FL-1–FL-2 and FL-2–FL-1 compensations were 4% and 44%, respectively. To normalize variations of single-component fluorescence signals due to differences in mitochondrial density, the FL2/FL1 ratio in individual cells was calculated using the WEASEL software package (http://www.frankbattye.com.au/Weasel/index.html).
Confocal microscopy
Cells grown on coverslips were fixed in 3.7% paraformaldehyde in PBS for 20 min, permeabilized with 0.1% Triton X-100 for 15 min, blocked with 10% FBS for 2 h, and incubated with antibodies overnight at 4°C. Mitochondria were detected using the OXPHOS complex monoclonal antibody cocktail (Cat.#45-7999; ThermoFisher) or anti-Tom20 antibody (sc-11415; Santa Cruz Biotechnology, USA). LC3 proteins were detected using anti-LC3 antibody (2775; Cell Signaling Technology, USA). After washing, cells were incubated with antibodies conjugated to either Alexa Fluor 405, Alexa Fluor 488, or Alexa Fluor 546 (all from ThermoFisher), and were visualized under a confocal microscope (LSM 510; Carl Zeiss, USA). For detection of mitochondrial membrane potential, cells were stained with 3 μg/ml JC-1 for 30 min. A 488-nm laser and a 543-nm laser were used to excite fluorescence of the monomeric form of JC-1 and aggregates of JC-1, respectively. The number of LC3 puncta and mitochondrial length were determined using ImageJ analysis software (NIH, USA). To visualize ubiquitination status, cells were transfected with pBabe-UBC (kindly provided by Dr. KR Ryu, University of Seoul), which encodes the human UBC gene tagged with GFP.
Western blot analysis
Proteins were extracted with RIPA buffer (50 mM Tris-HCL [pH 7.5], 150 mM NaCl, 1% Nonidet P-40, 0.5% sodium deoxycholate, 0.1% SDS) supplemented with NaF, NaVO4, and Protease Inhibitor Cocktail (Cat.#P2714). Proteins were then separated in SDS-PAGE and were transferred to a nitrocellulose membrane, which was blotted with antibodies against Parkin (Cat.#2132), LC3 (Cat.#.2775), acetylated lysine (Cat#.9441) (all from Cell Signaling), cyclophyllin D (CypD, sc-137216; Santa Cruz), or Erk (SC-93; Santa Cruz). Protein bands were visualized using horseradish peroxidase-conjugated secondary antibodies and Supersignal West Femto Maximum Sensitivity Substrate (Cat.#34095; ThermoFisher). To determine acetylation levels of CypD, equal amounts of cell lysates were incubated with anti-CypD antibody overnight at 4°C, and were further incubated with protein A/G plus-agarose beads (sc-2003; Santa Cruz) for 2 h at 4°C. After washing, beads were precipitated, and proteins were processed for western blot analysis using anti-acetylated-lysine antibody (Cat.#9441; Cell Signaling). To visualize levels of CypD in the blot, the filter was stripped off the anti-acetylated-lysine antibody using Restore™ Plus stripping buffer (Cat.#46430; Thermo Scientific), and was then probed with anti-CypD antibody.
Determination of cellular and mitochondrial NAD+/NADH ratio
Amounts of NAD+ and NADH were determined using the NAD/NADH quantification kit (Cat.#MAK037, ThermoFisher) according to the manufacturer’s protocol. Mitochondrial levels of NAD+ and NADH were determined using mitochondria that were isolated using the Mitochondria Isolation Kit (Cat.#89874, ThermoFisher).
Measurement of cellular oxygen consumption rate (OCR)
The cellular OCR was estimated to evaluate mitochondrial respiratory capacity, using the Seahorse XF24 analyzer (Seahorse Bioscience, Inc., USA), following the manufacturer’s instructions. Briefly, fibroblasts (with doubling time of 36 h) were seeded onto the XF24 culture plate at a density of 8,000 cells per well. The next day, cells were pre-incubated for 1 h in XF base medium (Cat.#102353-100; Seahorse Bioscience) containing 5.5 mM glucose (Cat.#G7021), 1 mM sodium pyruvate (Cat.#S8636), 4 mM glutamax (Cat.#35050-061) (all from GIBCO), 25 mM HEPES (4-[2-hydroxyethyl]-1-piperazine-1-ethanesulfonic acid, pH 7.9) (Cat.#H3375; Sigma Aldrich), and 10 % FBS, at 37°C (without CO2). Cells were then exposed to 5 mM NAM, and OCR was measured. All the experiments were performed at least four times independently, and OCR was expressed as a percentage of the values obtained from untreated control cells.
Analysis of mitochondrial permeability transition pore (MPTP) opening
MPTP opening was assessed using the calcein-cobalt assay (Petronilli et al., 1998). Briefly, cultured cells were stained with 1 μM calcein AM (Cat.#C1430; ThermoFisher) at 37°C in the dark. After 30 min, 1 mM CoCl2 (Cat.#232696; ThermoFisher) was added, and the cells were incubated for an additional 10 min to quench cytosolic calcein fluorescence. After washing with PBS, fluorescence signals from mitochondrially trapped calcein were measured via flow cytometry.
Measurement of cellular ATP content
Equal numbers of cells (typically in the range of 1–3 × 10⁵) were lysed to determine total cellular ATP using an ATP detection kit (LT07-221; ViaLight Plus kit, Lonza, Basel, Switzerland) according to the manufacturer’s protocol. Chemiluminescence was read in an FLx800 microplate fluorescence reader (Biotek, USA). ATP production independent of oxidative phosphorylation was determined using cells treated with 1 μM rotenone (R8875) and 1 μM antimycin A (A8674) for 1 h before collection. ATP production by oxidative phosphorylation was estimated by subtracting [ATP produced in cells treated with rotenone and antimycin A] from [total cellular ATP].
Statistical analysis
All quantitative measurements were done at least three times, and mean values ± SEM were presented. Comparisons of the mean values between different groups were performed via ANOVA with a Dunnett post hoc test.
RESULTS
NAM treatment causes immediate changes in mitochondrial ROS levels and membrane potential
Treatment of 5 mM NAM has been shown to cause decreases in ROS levels in actively proliferating fibroblasts (Jang et al., 2012; Kang and Hwang, 2009). These effects of NAM treatment were also seen in late passage fibroblasts (p28), which—as expected for cells approaching senescence—otherwise exhibited elevated levels of superoxide (Hwang et al., 2009; Jendrach et al., 2005; Lee et al., 2002) (Fig. 1A). In the early (p17) and the late passage cells, NAM treatment caused a similar decrease in mitochondria content, with observed reductions typically of 20–25% by day 3 (Supplementary Fig. 1A, and also shown in Jang et al., 2012). Upon further incubation in the presence of NAM, mitochondria content and ROS levels were maintained near 80% and 70%, respectively (Jang et al., 2012). This sustained maintenance of low ROS level was in parallel with observed decreases in the severity of oxidative modification of proteins in mitochondria (Supplementary Fig. 1B). Another important change caused by NAM treatment is an increase of mitochondrial membrane potential (Δψm) (Figs. 1B and 1C, and also shown in Jang et al., 2012). Confocal images of mitochondria in fibroblasts stained with JC-1 showed sharp contrasts between control and NAM-treated cells (Fig. 1C). Control cells exhibited green cytosolic fluorescence with an appearance of orange-colored threads of mitochondria; by contrast, NAM-treated cells exhibited distinctly red-colored threads of mitochondria, demonstrating mitochondria with higher Δψm values.
Fig. 1. Effect of NAM on ROS, Δψm, and mitochondria content.
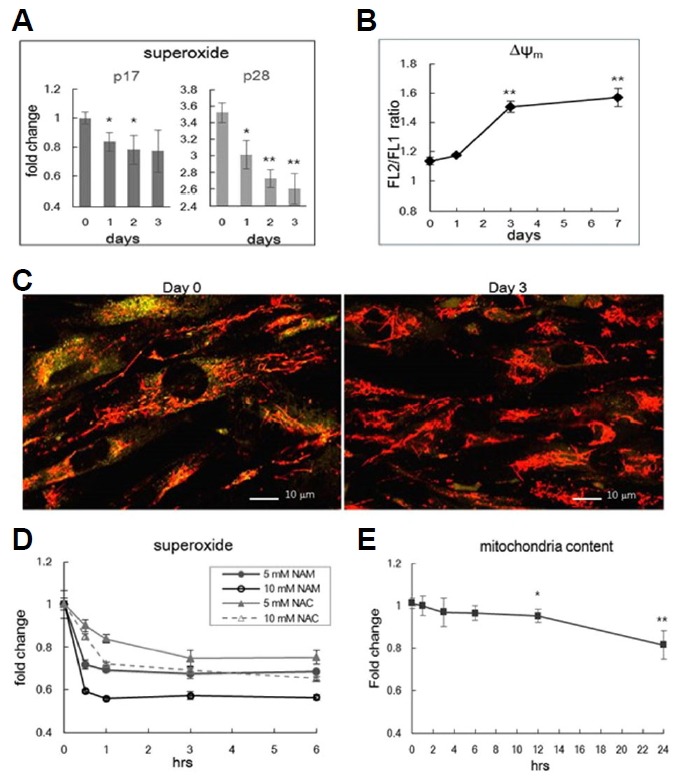
(A) Human fibroblasts at passage 17 (p17) or passage 28 (p28) were cultivated in medium containing 5 mM NAM for 1, 2, or 3 days, were stained DHE (A), and subjected to flow cytometric quantitation of superoxide levels. By day 3, superoxide levels decreased by 19.6% and 25.5% in p17 and p28 cells, respectively. This fibroblast line stopped cell division at p30 (SB Song, unpublished data) (B) At days 1, 3, and 7 of NAM treatment, p17 cells were stained with JC-1 and were subjected to flow cytometry. Means of the FL2/ FL1 ratios were plotted as Δψ. (C) Fibroblasts untreated (Day 0) and treated with NAM for 3 days (Day 3) were stained with JC-1, and photographed via confocal microscopy to visualize Δψm of individual mitochondria. In Day 0 cells, most mitochondria appeared as orange-colored needles, while they appeared with a distinct red color in Day 3 cells. (D) p17 cells were stained with DHE at 0.5, 1, 3, and 6 h of treatment with 5 or 10 mM NAM, and mitochondrial superoxide levels were determined through flow cytometry. The effects of 5 or 10 mM n-acetyl cysteine (NAC) were also determined in parallel. (E) At 1, 2, 3, 6, 12, or 24 h of NAM treatment, fibroblasts were stained with NAO and were subjected to flow cytometry. Note that the scale of the Y-axis is the same as that in (D). In all measurements, three independent biological samples were analyzed, and averages normalized by those of untreated cells were plotted. *P < 0.05, **P < 0.01 (compared to Day 0 or Hour 0 control, one-way ANOVA).
The changes in levels of ROS and Δψm may be a result of mitophagy, which might be selective for mitochondria with high levels of ROS production and low Δψm. However, this possibility has not been demonstrated. To address the plausibility of this selective mitophagy hypothesis, we first examined the kinetics of the changes in levels of ROS. A time-course study, conducted at the immediate early point of NAM treatment, showed unexpectedly rapid decreases in superoxide levels (Fig. 1D). Levels dropped in full within 30 min of the treatment of NAM at either 5 and 10 mM. The kinetics of this response are faster and more extensive than that of cells treated with N-acetylcysteine, a potent radical scavenger (Schneider, 2005). This change is a substantial contrast to the marginal decreases of mitochondria content (Fig. 1E). Together, these results suggest that the decreases in mitochondria content may not be responsible for the lower ROS levels. The expression levels of superoxide dismutase (MnSOD) and thioredoxin (Trx1), which function as antioxidants by converting superoxides into hydrogen peroxides and by facilitating cysteine thiol-disulfide exchange, respectively, were not altered by NAM treatment ruling out the involvement of ROS scavenging enzymes (Supplementary Fig. 1C).
PINK1-Parkin mitophagy pathway is not involved in the NAM-induced changes in mitochondria content and ROS levels
In normal cells, depolarized mitochondria (those with low Δψm) are selectively removed through mitophagy that is mediated by the PINK1/Parkin pathway (Matsuda et al., 2010; Narendra et al., 2008). The results above do not rule out the involvement of a form of mitophagy that acts acutely and is selective against mitochondria with low Δψm and high ROS levels. However, possible involvement of the PINK1/Parkin pathway was ruled out by the results of the following two experiments. First, knocking down Parkin expression through siRNA transfection did not affect the NAM-induced changes in superoxide levels and mitochondria content; regardless of Parkin expression, similar decreases in mitochondria content and ROS levels occurred upon NAM treatment (Figs. 2A and 2B). Furthermore, the PINK1/Parkin pathway itself does not appear to be activated by NAM treatment. When this pathway is activated, mitochondrial proteins are ubiquitinated by activated Parkin (a ubiquitin ligase), and then mitochondria are targeted to the autophagosome (Eiyama and Okamoto, 2015). This occurred in cells treated with carbonyl cyanide m-chlorophenyl hydrazone (CCCP)—a compound that causes mitochondrial depolarization, thereby activating the PINK1/Parkin pathway (Fig. 2C). Ubiquitins were present as puncta that largely co-localized with mitochondrial signals. However, in cells treated with NAM for 12 h, ubiquitin signals appeared smeary in the cytosol; this demonstrated that the specific localization of ubiquitin to mitochondria did not occur. By contrast, superoxide levels had already decreased by this time, strongly suggesting that ROS levels decreased via a mechanism distinct from the PINK1/Parkin pathway.
Fig. 2. PINK1/Parkin-independent changes in ROS levels by NAM treatment.
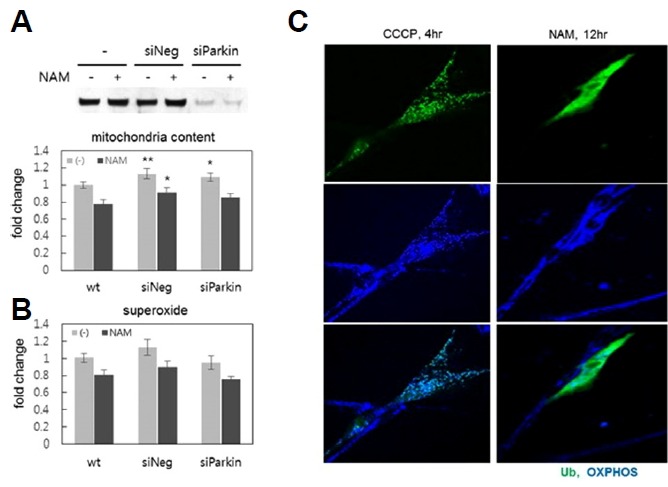
Levels of mitochondria content (A) and superoxide (B) were determined using NAO or DHE at Day 1 or 2 of NAM treatment, and the effects were compared between normal fibroblasts and those whose Parkin expression was knocked down by siRNA (siParkin). The image of the protein blot (top) shows diminished Parkin protein levels in cells treated with siParkin RNA. Three independent biological samples (different transfections) were analyzed, and the averages normalized by those of untreated cells (wt) were plotted. *P < 0.1, **P < 0.05 (compared to wt control, oneway ANOVA). (C) Ubiquitin puncta formation was compared between cells treated with 10 μM CCCP for 4 h, or 5 mM NAM for 12 h. Fibroblasts were transfected with GFP-tagged human UBC gene 24 h earlier, and were treated with either CCCP or NAM, fixed, and then probed with OXPHOS antibodies to visualize mitochondria (blue). Cells positive for green fluorescence from ubiquitin-tagged GFP were photographed.
SIRT1 activation itself does not induce changes in ROS levels and Δψm
It is tempting to consider the involvement of SIRT1, considering that SIRT1 plays an essential role in autophagy (Huang, 2010; Lee et al., 2008); it may also play a role in the direct reduction of ROS through FOXO3a-mediated upregulation of antioxidant gene expression (Olmos et al., 2013). To determine the level of involvement of SIRT1 activation, we checked the effects of treating cells with resveratrol or SRT172, activators of SIRT1, at doses frequently cited in the literature. As has been reported previously (Jang et al., 2012), treatment of these chemicals caused decreases in mitochondria content (Figs. 3A and 3B). In fact, they induced large decreases in mitochondrial content, causing nearly 40% reductions; this possibly suggests that it activates SIRT1-mediated mitophagy to levels that are higher than those achieved by NAM. However, these were unable to induce comparable changes in ROS levels (Figs. 3A and 3B) (However, SRT1720 treatment did induce smaller but significant decreases in ROS levels). Furthermore, knocking down SIRT1 expression using siRNA did not attenuate the decreases in ROS levels induced by NAM (Fig. 3C). Together, these results suggest that superoxide downregulation by NAM occurs independent of mitophagy induction or SIRT1 activation. In addition, neither resveratrol nor SRT1720 induced notable increases in Δψm at doses that also caused decreases in mitochondria content (Figs. 3A and 3B). Knocking down SIRT1 expression did not attenuate the NAM-induced increase of Δψm (Fig. 3D). Therefore, SIRT1 activation is not involved in the NAM-induced increase of Δψm either.
Fig. 3. SIRT1-independent changes in ROS levels and Δψm by NAM treatment.
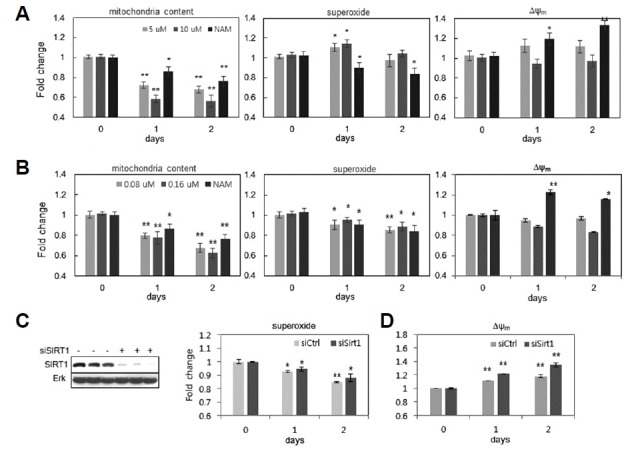
Fibroblasts were treated with either resveratrol at 5 or 10 μM (A), or SRT1720 at 0.08 or 0.16 μM (B), for 1 or 2 days, and were subjected to flow cytometry after staining with NAO, DHE, or JC-1. Cells treated with 5 mM NAM alone were analyzed in parallel. (C and D) Fibroblasts were transfected either with random RNA or with siRNA to SIRT1, for 12 h; fibroblasts were then further incubated in the absence (light bar) or the presence (dark bar) of 5 mM NAM. After 1 or 2 d, cells were collected, treated with DHE (for C) or JC-1 (for D), and subjected to flow cytometry for quantitative comparison of the levels of superoxide (C) and Δψm(D). ). *P < 0.05, **P < 0.01 (compared to Day 0 control, one-way ANOVA.
NAM treatment, but not SIRT1 activation, reduces mitochondrial ROS generation by decreasing electron transport
The flow of electrons in the electron transport chain (ETC) limits oxygen consumption and ROS production. Complexes I and III of the ETC are known as the sites where ROS are predominantly produced (Stowe and Camara, 2009). Meanwhile, the ratio of NAD(P)H/NAD(P)+ has been proposed to be an important physiological factor that influences superoxide production at Complex I (Ghosh et al., 2012; Kushnareva et al., 2002; Starkov and Fiskum, 2003). In fact, an increase in the mitochondrial NAD+/NADH ratio lowers ROS production and O2 consumption (Murphy, 2009). We checked whether NAM treatment affects mitochondrial NAD(P)H redox and causes a change in cellular O2 consumption. It is known that NAD+ is unable to diffuse across membranes (Todisco et al., 2006), and that cells maintain cytosolic and mitochondrial NAD+ pools independently (Yang et al., 2007). However, the NAD+/NADH ratio in mitochondria was increased by NAM treatment. The extent of this increase was even higher than that observed in the cytosol (Fig. 4A). Additionally, the cellular O2 consumption rate (OCR) appeared to decrease. Its change was acute, dropping by 20% within 1 h of the treatment; thereafter, it decreased at a slower pace, approaching 60% of the control cells’ level within 24 h (Fig. 4B). This pattern was reminiscent of the changes in mitochondrial superoxide levels that was observed in NAM-treated cells (Fig. 1D). Considering the fact that mitochondria content decreases rather slowly (Fig. 1E), the slow decrease in OCR at the later phase of NAM treatment might have been caused, at least to some extent, by the decrease in mitochondria content. By contrast, the acute drop in the OCR observed at the early phase might reflect the acute effects of NAM treatment. NAD+ treatment resulted in similar changes in OCR, suggesting that this change indeed caused by increasing the NAD+ level (or, decreasing the NADH/NAD+ ratio). SRT1720 treatment caused a rather acute increase in O2 consumption (Fig. 4B), demonstrating that NAM treatment and SIRT1 activation affect mitochondrial physiology differently. A further difference was found in the effects on mitochondrial ATP production levels, which were estimated by calculating the differences in ATP level between control cells (Total) and cells treated with rotenone and antimycin A, inhibitors of Complexes I and III, respectively ((R+A))(This represents ATP produced by glycolysis). Upon NAM treatment, both total cellular ATP level and mitochondrial ATP production decreased by nearly 40% within 3 days (Fig. 4C). Concurrently, glycolytic ATP production increased by 30%. Importantly, this pattern was inverted in cells treated with SRT1720: both the total cellular ATP level and mitochondrial ATP production increased, while glycolytic ATP production decreased (Fig. 4D). Considering the decrease in mitochondria quantity caused by SRT1720 treatment, this increase in mitochondrial ATP production is surprisingly high. This, along with the increase in O2 consumption, may reflect the SIRT1-mediated mitochondrial quality improvement (Menzies and Hood, 2012). In summary, the changes in mitochondrial activity and status that were induced by NAM treatment might be caused by reduced levels of electron transport, while the corresponding changes induced by SRT1720 treatment might be caused by increased mitochondrial turnover.
Fig. 4. Different effects of NAM and SRT1720 on mitochondrial activities.
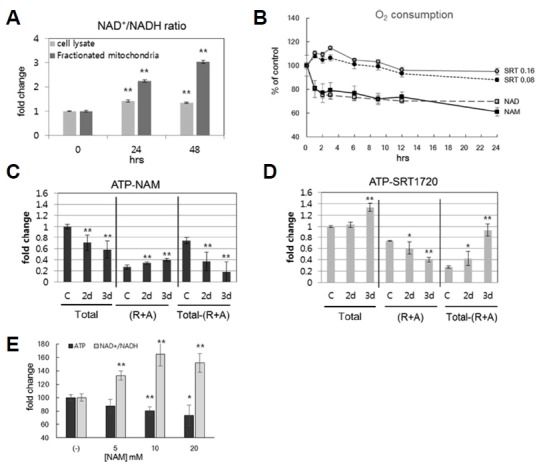
(A) Fibroblasts were incubated for 1 or 2 d in the presence of 5 mM NAM, collected, and fractionated for cytosol (light bar) and mitochondria (dark bar). Each group was then analyzed for NAD+/NADH ratio, using an assay kit. (B) Fibroblasts were incubated on an XF24 culture plate, in the presence of 5 mM NAM, 5 mM NAD+, or [0.08 or 0.16] μM SRT1720; at the indicated time points, cells were subjected to analysis for O2 consumption rates in an XF24 analyzer. For each treatment, measurements of four different biological samples were taken, and the means were plotted. All changes in samples treated with chemicals, as compared to the Hour 0 control group, were with P < 0.05 (except for the later time points of SRT1720 treatments). (C and D) Fibroblasts incubated in the presence of 5 mM NAM (C) or 0.16 μM SRT1720 (D) were collected at the indicated time points. The same number of cells were lysed, and ATP contents were determined using an assay kit. To estimate mitochondrial ATP production, the amount of total ATP was subtracted by that in cells treated with 1 μM rotenone and 1 μM antimycin A for 1 h before cell collection (R+A). The resulting difference was presented as mitochondrial ATP production (Total - [R+A]). For each time point, six independent biological samples were analyzed, and the averages normalized by those of untreated cells (C) were plotted. *P < 0.1, **P < 0.05 (compared to Day 0 control, one-way ANOVA). (E) Cells were treated with 5, 10, or 20 mM NAM for 48 h; cells were then divided into two groups, and each was subjected to a determination of either total cellular ATP levels or the NAD+/NADH ratio. In experiments (A) and (E), three independent biological samples were analyzed, and the averages normalized by those of untreated cells were plotted. *P < 0.05, **P < 0.01 (compared with Day 0 control, one-way ANOVA).
Finally, the decrease in total ATP levels became greater when treatments of higher doses of NAM were used, in inverse proportion to the levels of NAD+/NADH (Fig. 4E), supporting a direct relationship between ATP production and NADH/NAD+ levels. Overall, these results demonstrated that NAM treatment caused a reduction in oxidative phosphorylation, likely through reducing electron flow to ETC Complex I, which would also lead to reduced superoxide production.
NAM increases Δψm by modulating mitochondrial permeability transition pore
Decreases in electron transport and in respiration would result in decreased Δψm. However, NAM-induced changes were accompanied by increases in Δψm, as was demonstrated above. Therefore, the increase in Δψm appears to be uncoupled to electron transport. And, so far, observations indicate that the NAM-induced Δψm increase was not caused by the mitophagic removal of mitochondria possessing low Δψm, nor were they mediated by SIRT1 activation.
Δψm appeared to increase immediately upon NAM treatment, peaking at 8 h, and was maintained at high levels thereafter (Fig. 5A). Furthermore, to a certain degree, NAM treatment attenuated the decrease in Δψm that was induced by treatment with rotenone, which lowers electron flow by inhibiting complex I (Fig. 5B; compare Rot and Rot+NAM). This suggests a mechanism that is independent of electron flow through the transport chain. Blockage of the mitochondrial permeability transition pore (MPTP), an important route for the loss of Δψm, may be one such mechanism (Cheng et al., 2011). Indeed, NAM has been proposed to prevent mitochondrial depolarization and cytochrome C release from mitochondria (Zhang et al., 2003), which is known to occur through MPTP (Machida and Osada, 2003). Treatment of 5-aminolevulinic acid (ALA), a strong oxidant that has been shown to reduce Δψm by increasing membrane permeability (Bernardi et al., 1992; Leung and Halestrap, 2008; Vercesi et al., 1994), caused Δψm to decrease by approximately 25% (Fig. 5C). This decrease was readily prevented with the co-treatment of NAM (ALA vs. A+N). More importantly, NAM treatment caused an accumulation of fluorescent calsein in the CoCl2-calcein fluorescence-quenching assay (Petronilli et al., 1998), which allows for the estimation (Fig. 5D) and visualization of mitochondria with closed MPTP (Fig. 5E; note the higher intensity of mitochondrial fluorescence in NAM-treated cells (NAM)). These results strongly support the possibility that NAM either inhibits MPTP formation or induces its closure.
Fig. 5. Δψm increase and mPTP closure by NAM treatment.
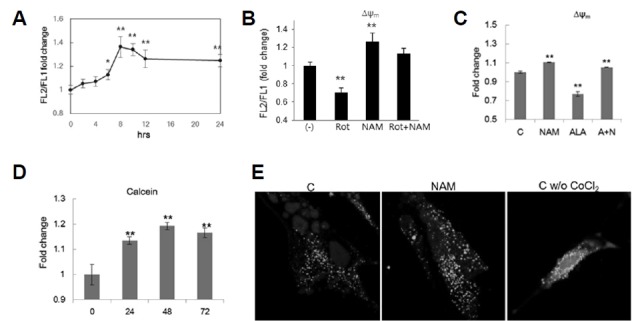
(A) Fibroblasts incubated in the presence of 5 mM NAM were collected at the indicated time points, stained with JC-1, and Δψm was determined. Values relative to those of untreated cells (0 h) were plotted. (B) Fibroblasts were incubated in the presence or absence of 5 mM NAM for 24 h. To these cell cultures, 1 μM rotenone (Rot, Rot+NAM) were added for 1 h before cells were collected for the determination of Δψm. (C) Fibroblasts were incubated for 24 h in the presence of 5 mM NAM, 1 mM ALA, or both NAM and ALA (A+N) (ALA was treated during the final 4 h before collection), and then subjected to Δψm determination. (D) and (E) Cells were incubated in the presence of 5 mM NAM for 1, 2, and 3 days, and stained with 1 μM calcein AM for 30 min. After further incubation in the presence of 1 mM CoCl2 for 10 min, cells were subjected to flow cytometry to measure calcein fluorescence. For confocal microscopy of cellular calcein (E), cells were incubated in the absence or presence of NAM on a coverslip, and were then examined in confocal microscope after 24 h. Note: green puncta are larger and more abundant in NAM-treated cells. Without CoCl2, a large amount of calcein fluorescence was found in smear in cytosol. In all experiments, three independent biological samples were analyzed, and the averages normalized by those of untreated cells were plotted. *P < 0.05, **P < 0.01 (compared with Day 0 control, one-way ANOVA).
Cyclophyllin D acetylation is reduced in the mitochondria of NAM-treated cells
Cyclophyllin D (CypD) positively modulates MPTP formation (Leung and Halestrap, 2008). And, a mitochondrial sirtuin, SIRT3, deacetylates CypD and blocks its interaction with Arnt (the aryl hydrocarbon receptor Ahr nuclear translocator), a key component of MPTP, and thereby prevents MPTP formation (Hafner et al., 2010). NAM may activate SIRT3 through an increase of mitochondrial NAD+/NADH, leading to CypD deacetylation. The acetylation levels of proteins from isolated mitochondria were indeed found to be lowered by NAM treatment to fibroblasts and H460 cells (Fig. 6A). Deacetylation of CypD was also confirmed by checking the acetylation levels of immunoprecipitated CypD protein (Fig. 6B). By contrast, treating cells with SRT1720, which is known to be an inefficient activator of SIRT3 (Villalba and Alcain, 2012), did not cause similar decreases in the acetylation levels of mitochondrial proteins (SB Song, data not shown). This may provide a possible explanation for the low stimulatory effects of resveratrol and SRT1720 on Δψm. Together, these results support the possibility that NAM increases Δψm by closing MPTP, partially via the suppression of ROS generation, and partially via the activation of SIRT3.
Fig. 6. Deacetylation of mitochondrial proteins and CypD by NAM treatment.
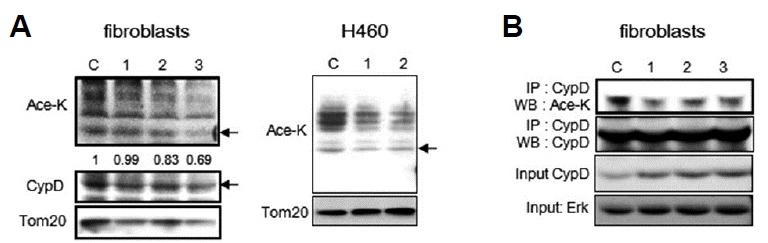
Acetylation levels of total mitochondrial proteins and CypD were determined. (A) Mitochondrial fractions were obtained from either fibroblasts or H460 cells, cultured in the presence of NAM for 1, 2, or 3 days, and equal amounts of protein were applied for Western blot analyses with antibodies against acetylated-lysine (Ace-K), CypD, or Tom20. Arrows in Ace-K blots point to the band that migrated to the same position as the CypD band in the CypD blots. The intensities of the bands pointed by the arrow, relative to the intensities of CypD bands of the same time points, were determined through densitometry and were noted under the panels of the Ace-K blot. (B) Total cell lysates were probed with anti-CypD antibody overnight at 4°C, and were further incubated with protein A/G plus-agarose beads. Precipitated proteins were analyzed by Western blotting with anti-acetylated-lysine antibody. The filter was then stripped and reprobed with anti-CypD to show levels of total CypD.
DISCUSSION
In this study, the effects of NAM on mitochondria were dissected. NAM treatment causes mitophagy and also induces a decrease in mitochondrial ROS levels and an increase of Δψm. These outcomes were hypothesized to occur through a single mechanism, i.e., a SIRT1-mediated activation of mitophagy that was selective against mitochondria suffering from low Δψm and producing high level ROS (Jang et al., 2012). However, the results of this study demonstrate that these changes were not brought on by selective mitophagy. Specifically, the decreases in ROS levels were likely to be caused by reduced electron transport; the increases in Δψm were likely to be caused by MPTP closure, which might be caused by lower ROS levels, SIRT3-induced CypD deacetylation, or both.
NAM-induced changes in mitochondria and cells have been thought to occur through SIRT1 activation via NAD+ upregulation. For example, treatment with NAM induced SIRT1-dependent mitophagy, as indicated by the fact that NAM-induced increases in LC3 autophagosomes as well as mitochondria fragmentation were abolished by SIRT1 inactivation (Supplementary Figs. 2B and 2C, NAM+EX527). However, in this study, NAM treatment and SIRT1 activation also showed substantial differences. SRT1720 caused an increase in both mitochondrial respiration and in ATP production; concomitantly, glycolytic ATP production was decreased. SRT1720’s effect of increasing mitochondrial activities points to the enhanced mitochondrial efficiency that occurs upon SIRT1 activation. SRT1720 treatment induced smaller but significant decreases in ROS levels (Fig. 3B) and an increase of Δψm to levels comparable to those induced by NAM when treated at a higher dose (1 μM) (SB Song, data not shown) possibly through SIRT1-mediated mitochondria turnover. However, NAM treatment worked in the opposite direction (Fig. 4C). Importantly, SRT1720 may exert an effect only in the cytosol, i.e., SIRT1 activation (at least at the doses used in this study); by contrast, NAM exerts its effects both in the cytosol and in mitochondria. SRT1720 is known to be far less potent as an activator of SIRT3 than SIRT1 (Feldman et al., 2015; Milne et al., 2007). (EC50 reported by Milne et al. (2007) was 1.16 μM and >300 μM for SIRT1 and SIRT3, respectively.) This might be a key reason that explains the differences between the effects of NAM and SRT1720. In summary, we hypothesize that NAM becomes NAD+ when is added to cells, rapidly driving an increase in the NAD+/NADH ratio, which then activates SIRT1 and, subsequently, mitophagy. Furthermore, the enhanced NAD+ pool would increase the extent of glycolysis. Additionally, NAM treatment also increases the NAD+/NADH ratio in the mitochondria, and the oxidized mitochondrial NAD+ redox causes lower levels of electron transport, which leads to decreased ROS generation. However, MPTP closure that is brought on by low ROS levels and by SIRT3 activation-mediated CypD deacetylation, causes Δψm to increase to higher than basal levels.
The decrease in ROS levels could be caused by mechanisms other than the reduced levels of electron transport to the ETC. For example, MPTP closure, by itself, can lower ROS generation. The formation of MPTP is known to uncouple oxidative phosphorylation and causes an increase in ROS generation (Zorov et al., 2014). Therefore, it is possible that NAM-induced changes in ROS as well as Δψm are caused solely by MPTP closure. However, in this situation, the OCR and ATP production would not necessarily be low. Because this is not the case in NAM-treated cells, the decreases in ROS levels are likely to be independent of MPTP closure. Additionally, NAM has been proposed to decrease ROS levels in neurons by regenerating gluthathione (GSH) through increased levels of NADPH-dependent gluthathione reductase, thereby driving the oxidized state to a reduced state (Ghosh et al., 2012). This study, and some other studies, have hypothesized that NAM administration provides a larger pool of pyridine nucleotides (Klaidman et al., 2001). The NAD(P)H pool may eventually get larger via the supply of NAD+. However, in our study settings in vitro, NAM treatment did not elevate NADH/NAD+ levels, and cellular redox would certainly not be favorable for GSH regeneration.
NAM has been shown to have therapeutic effects in many diseases, including neurological disorders (Rennie et al., 2015). However, the underlying mechanisms of the effects of NAM are largely unknown. Cell death due to apoptosis, high levels of oxidative damage by ROS generation, and loss of Ca++ homeostasis are common hallmarks of adult onset neurodegenerative diseases; all are known to be associated with MPTP formation (Rao et al., 2014). Moreover, in aging and cellular senescence, mitochondrial degeneration occurs; this can be attributed to the increased formation of and vulnerability to MPTPs (Du and Yan, 2010; Jendrach et al., 2005; Kim et al, 2007). Key mitochondrial activities—such as the TCA cycle, amino acid and fat catabolism, and the urea cycle—and cellular bioenergetics could be promoted by high Δψm. NAM-induced MPTP closure and Δψm upregulation would therefore not only assist in the maintenance of cellular integrity, but also promote cell viability. Indeed, NAM treatment caused a substantial extension of cell lifespan in human fibroblasts and keratinocytes (Kang et al., 2006). In short, the longevity of fibroblasts, and the protection of neurons from age-related degeneration, attributable to NAM treatment, may be caused, at least in part, by MPTP closure.
Finally, it is noteworthy that NAM is a product of the deacetylase reaction of the sirtuin family of proteins (which includes SIRT1 and SIRT3); for this reason, it has been regarded and utilized as an inhibitor of SIRT1. However, SIRT1 activation, instead of inhibition, through an increase in the cellular NAD+/NADH ratio in treated cells, has been demonstrated previously and in this study (Jang et al., 2012; Lee et al., 2008). Furthermore, NAM treatment was also demonstrated here to increase the mitochondrial NAD+/NADH ratio, and thereby, cause an activation of mitochondrial sirtuin(s). Upon addition to cells, NAM is rapidly converted into NAD+, thereby exerting a stimulatory effect in vivo most of the time (Hwang and Song, 2017). This double-sidedness of effects is a property unique to NAM. Treating cells with nicotinamide mononucleotide (NMN) and nicotinamide riboside (NR), which are derivatives of NAM but that lack the sirtuin-inhibitory effect of NAM, were recently shown to increase mitochondrial NAD+ and conferred resistance against H2O2 toxicity in astrocytes (Harlan et al., 2016).
Our findings on the effects of NAM, such as the fact that its effects are separate from those induced by SIRT1 activation, certainly extend the understanding of the mechanisms that underlie the therapeutic effects of NAM and promote its safe utilization. Further, they also can promote development of better strategies of SIRT1 modulation towards cellular longevity.
Supplementary data
Fig. 7. Hypothetical mechanism underlying the effects of NAM, based on increases in the NAD+/NADH ratio in cytosol and mitochondria.
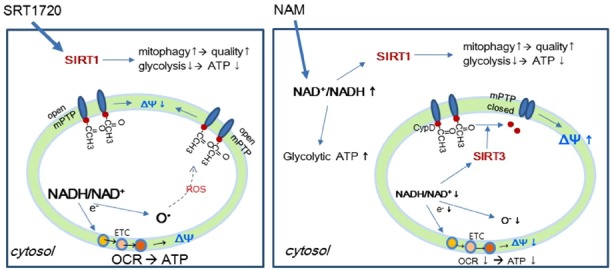
A hypothesis to explain the difference between the effects of NAM and SRT1720 is proposed. (Left) SRT1720 added to cells activates SIRT1 in cytosol and nucleus. This causes upregulation of mitophagy and mitochondrial turnover. This also induces glycolysis downregulation. Although SRT1720 does not directly exert an effect inside mitochondria, the expected increase in mitochondrial quality would result in an increase in mitochondrial ATP production. (Right) NAM added to cells causes an increase in the NAD+/NADH ratio in cytosol, which, as in SRT1720-treated cells, activates SIRT1, and would cause subsequent cytosolic changes. However, the increase in NAD+ availability would lead to an enhancement of glycolysis, and this may override the SIRT1-induced downregulation of glycolysis. NAM treatment also induces an increase in the NAD+/NADH ratio (which is also a decrease in the NADH/NAD+ ratio) in mitochondria, which would lead to decreased electron transfer to Complex I and, concomitantly, would lower superoxide generation. The decreased electron transport then leads to a decline in OCR, ATP production, and Δψm. However, low ROS levels would attenuate MPTP formation. In addition, high mitochondrial NAD+/NADH ratios would activate SIRT3, which would deacetylate CypD, leading to MPTP closure. Together, these effects increase Δψm. Overall, these changes in mitochondria would function to improve mitochondrial integrity. Decreases in ATP levels did not affect cell division rates, although the cells became marginally smaller in size (SB Song, unpublished data).
ACKNOWLEDGMENTS
This work was supported by the 2015 Research Fund of the University of Seoul. The authors declare that they have no conflicts of interest with the contents of this article, and their experiments complied with the current laws of the Republic of Korea, inclusive of ethics approval.
Footnotes
Note: Supplementary information is available on the Molecules and Cells website (www.molcells.org).
REFERENCES
- Ayoub I.A., Maynard K.I. Therapeutic window for nicotinamide following transient focal cerebral ischemia. Neuroreport. 2002;13:213–216. doi: 10.1097/00001756-200202110-00008. [DOI] [PubMed] [Google Scholar]
- Bayrakdar E.T., Armagan G., Uyanikgil Y., Kanit L., Koylu E., Yalcin A. Ex vivo protective effects of nicotinamide and 3-aminobenzamide on rat synaptosomes treated with Abeta(1–42) Cell Biochem Funct. 2014;32:557–564. doi: 10.1002/cbf.3049. [DOI] [PubMed] [Google Scholar]
- Bernardi P., Vassanelli S., Veronese P., Colonna R., Szabo I., Zoratti M. Modulation of the mitochondrial permeability transition pore. Effect of protons and divalent cations. J Biol Chem. 1992;267:2934–2939. [PubMed] [Google Scholar]
- Cheng Y., Gulbins E., Siemen D. Activation of the permeability transition pore by Bax via inhibition of the mitochondrial BK channel. Cell Physiol Biochem. 2011;27:191–200. doi: 10.1159/000327944. [DOI] [PubMed] [Google Scholar]
- Choi H.J., Jang S.Y., Hwang E.S. High-dose nicotinamide suppresses ROS generation and augments population expansion during CD8(+) T cell activation. Mol Cells. 2015;38:918–924. doi: 10.14348/molcells.2015.0168. [DOI] [PMC free article] [PubMed] [Google Scholar]
- Chong Z.Z., Lin S.H., Maiese K. Nicotinamide modulates mitochondrial membrane potential and cysteine protease activity during cerebral vascular endothelial cell injury. J Vasc Res. 2002;39:131–147. doi: 10.1159/000057762. [DOI] [PubMed] [Google Scholar]
- Crowley C.L., Payne C.M., Bernstein H., Bernstein C., Roe D. The NAD+ precursors, nicotinic acid and nicotinamide protect cells against apoptosis induced by a multiple stress inducer, deoxycholate. Cell Death Differ. 2000;7:314–326. doi: 10.1038/sj.cdd.4400658. [DOI] [PubMed] [Google Scholar]
- Dengjel J., Abeliovich H. Roles of mitophagy in cellular physiology and development. Cell Tissue Res. 2017;367:95–109. doi: 10.1007/s00441-016-2472-0. [DOI] [PubMed] [Google Scholar]
- Du H., Yan S.S. Mitochondrial permeability transition pore in Alzheimer’s disease: cyclophilin D and amyloid beta. Biochim Biophys Acta. 2010;1802:198–204. doi: 10.1016/j.bbadis.2009.07.005. [DOI] [PMC free article] [PubMed] [Google Scholar]
- Eiyama A., Okamoto K. PINK1/Parkin-mediated mitophagy in mammalian cells. Curr Opin Cell Biol. 2015;33:95–101. doi: 10.1016/j.ceb.2015.01.002. [DOI] [PubMed] [Google Scholar]
- Feldman J.L., Dittenhafer-Reed K.E., Kudo N., Thelen J.N., Ito A., Yoshida M., Denu J.M. Kinetic and structural basis for acyl-group selectivity and NAD(+) dependence in sirtuin-catalyzed deacylation. Biochemistry. 2015;54:3037–3050. doi: 10.1021/acs.biochem.5b00150. [DOI] [PMC free article] [PubMed] [Google Scholar]
- Ghosh D., LeVault K.R., Barnett A.J., Brewer G.J. A reversible early oxidized redox state that precedes macromolecular ROS damage in aging nontransgenic and 3xTg-AD mouse neurons. J Neurosci. 2012;32:5821–5832. doi: 10.1523/JNEUROSCI.6192-11.2012. [DOI] [PMC free article] [PubMed] [Google Scholar]
- Hafner A.V., Dai J., Gomes A.P., Xiao C.Y., Palmeira C.M., Rosenzweig A., Sinclair D.A. Regulation of the mPTP by SIRT3-mediated deacetylation of CypD at lysine 166 suppresses age-related cardiac hypertrophy. Aging (Albany NY) 2010;2:914–923. doi: 10.18632/aging.100252. [DOI] [PMC free article] [PubMed] [Google Scholar]
- Harlan B.A., Pehar M., Sharma D.R., Beeson G., Beeson C.C., Vargas M.R. Enhancing NAD+ salvage pathway reverts the toxicity of primary astrocytes expressing amyotrophic lateral sclerosis-linked mutant superoxide dismutase 1 (SOD1) J Biol Chem. 2016;291:10836–10846. doi: 10.1074/jbc.M115.698779. [DOI] [PMC free article] [PubMed] [Google Scholar]
- Huang J., Gan Q., Han L., Li J., Zhang H., Sun Y., Zhang Z., Tong T. SIRT1 overexpression antagonizes cellular senescence with activated ERK/S6k1 signaling in human diploid fibroblasts. PLoS One. 2008;3:e1710. doi: 10.1371/journal.pone.0001710. [DOI] [PMC free article] [PubMed] [Google Scholar]
- Huang J.Y., Hirschey M.D., Shimazu T., Ho L., Verdin E. Mitochondrial sirtuins. Biochim Biophys Acta. 2010;1804:1645–1651. doi: 10.1016/j.bbapap.2009.12.021. [DOI] [PubMed] [Google Scholar]
- Hwang E.S., Song S.B. Nicotinamide is an inhibitor of SIRT1 in vitro, but can be a stimulator in cells. Cell Mol Life Sci. 2017 doi: 10.1007/s00018-017-2527-8. [DOI] [PMC free article] [PubMed] [Google Scholar]
- Hwang E.S., Yoon G., Kang H.T. A comparative analysis of the cell biology of senescence and aging. Cell Mol Life Sci. 2009;66:2503–2524. doi: 10.1007/s00018-009-0034-2. [DOI] [PMC free article] [PubMed] [Google Scholar]
- Jang S.Y., Kang H.T., Hwang E.S. Nicotinamide-induced mitophagy: event mediated by high NAD+/NADH ratio and SIRT1 protein activation. J Biol Chem. 2012;287:19304–19314. doi: 10.1074/jbc.M112.363747. [DOI] [PMC free article] [PubMed] [Google Scholar]
- Jendrach M., Pohl S., Voth M., Kowald A., Hammerstein P., Bereiter-Hahn J. Morpho-dynamic changes of mitochondria during ageing of human endothelial cells. Mech Ageing Dev. 2005;126:813–821. doi: 10.1016/j.mad.2005.03.002. [DOI] [PubMed] [Google Scholar]
- Kaneko S., Wang J., Kaneko M., Yiu G., Hurrell J.M., Chitnis T., Khoury S.J., He Z. Protecting axonal degeneration by increasing nicotinamide adenine dinucleotide levels in experimental autoimmune encephalomyelitis models. J Neurosci. 2006;26:9794–9804. doi: 10.1523/JNEUROSCI.2116-06.2006. [DOI] [PMC free article] [PubMed] [Google Scholar]
- Kang H.T., Hwang E.S. Nicotinamide enhances mitochondria quality through autophagy activation in human cells. Aging Cell. 2009;8:426–438. doi: 10.1111/j.1474-9726.2009.00487.x. [DOI] [PubMed] [Google Scholar]
- Kang H.T., Lee H.I., Hwang E.S. Nicotinamide extends replicative lifespan of human cells. Aging Cell. 2006;5:423–436. doi: 10.1111/j.1474-9726.2006.00234.x. [DOI] [PubMed] [Google Scholar]
- Kim I., Rodriguez-Enriquez S., Lemasters J.J. Selective degradation of mitochondria by mitophagy. Arch Biochem Biophys. 2007;462:245–253. doi: 10.1016/j.abb.2007.03.034. [DOI] [PMC free article] [PubMed] [Google Scholar]
- Kiuchi K., Yoshizawa K., Shikata N., Matsumura M., Tsubura A. Nicotinamide prevents N-methyl-N-nitrosourea-induced photoreceptor cell apoptosis in Sprague-Dawley rats and C57BL mice. Exp Eye Res. 2002;74:383–392. doi: 10.1006/exer.2001.1127. [DOI] [PubMed] [Google Scholar]
- Klaidman L.K., Mukherjee S.K., Adams J.D., Jr Oxidative changes in brain pyridine nucleotides and neuroprotection using nicotinamide. Biochim Biophys Acta. 2001;1525:136–148. doi: 10.1016/s0304-4165(00)00181-1. [DOI] [PubMed] [Google Scholar]
- Kushnareva Y., Murphy A.N., Andreyev A. Complex I-mediated reactive oxygen species generation: modulation by cytochrome c and NAD(P).+ oxidation-reduction state. Biochem J. 2002;368:545–553. doi: 10.1042/BJ20021121. [DOI] [PMC free article] [PubMed] [Google Scholar]
- Lee H.C., Yin P.H., Chi C.W., Wei Y.H. Increase in mitochondrial mass in human fibroblasts under oxidative stress and during replicative cell senescence. J Biomed Sci. 2002;9:517–526. doi: 10.1007/BF02254978. [DOI] [PubMed] [Google Scholar]
- Lee E.J., Wu T.S., Chang G.L., Li C.Y., Chen T.Y., Lee M.Y., Chen H.Y., Maynard K.I. Delayed treatment with nicotinamide inhibits brain energy depletion, improves cerebral microperfusion, reduces brain infarct volume, but does not alter neurobehavioral outcome following permanent focal cerebral ischemia in Sprague Dawley rats. Curr Neurovasc Res. 2006;3:203–213. doi: 10.2174/156720206778018749. [DOI] [PubMed] [Google Scholar]
- Lee H.I., Jang S.Y., Kang H.T., Hwang E.S. p53-, SIRT1-, and PARP-1-independent downregulation of p21WAF1 expression in nicotinamide-treated cells. Biochem Biophys Res Commun. 2008;368:298–304. doi: 10.1016/j.bbrc.2008.01.082. [DOI] [PubMed] [Google Scholar]
- Lee I.H., Cao L., Mostoslavsky R., Lombard D.B., Liu J., Bruns N.E., Tsokos M., Alt F.W., Finkel T. A role for the NAD-dependent deacetylase Sirt1 in the regulation of autophagy. Proc Natl Acad Sci USA. 2008;105:3374–3379. doi: 10.1073/pnas.0712145105. [DOI] [PMC free article] [PubMed] [Google Scholar]
- Leung A.W., Halestrap A.P. Recent progress in elucidating the molecular mechanism of the mitochondrial permeability transition pore. Biochim Biophys Acta. 2008;1777:946–952. doi: 10.1016/j.bbabio.2008.03.009. [DOI] [PubMed] [Google Scholar]
- Li F., Chong Z.Z., Maiese K. Navigating novel mechanisms of cellular plasticity with the NAD+ precursor and nutrient nicotinamide. Front Biosci. 2004;9:2500–2520. doi: 10.2741/1412. [DOI] [PubMed] [Google Scholar]
- Machida K., Osada H. Molecular interaction between cyclophilin D and adenine nucleotide translocase in cytochrome c release: does it determine whether cytochrome c release is dependent on permeability transition or not? Ann. N Y Acad Sci. 2003;1010:182–185. doi: 10.1196/annals.1299.031. [DOI] [PubMed] [Google Scholar]
- Maiese K., Chong Z.Z., Hou J., Shang Y.C. The vitamin nicotinamide: translating nutrition into clinical care. Molecules. 2009;14:3446–3485. doi: 10.3390/molecules14093446. [DOI] [PMC free article] [PubMed] [Google Scholar]
- Matsuda N., Sato S., Shiba K., Okatsu K., Saisho K., Gautier C.A., Sou Y.S., Saiki S., Kawajiri S., Sato F., et al. PINK1 stabilized by mitochondrial depolarization recruits Parkin to damaged mitochondria and activates latent Parkin for mitophagy. J Cell Biol. 2010;189:211–221. doi: 10.1083/jcb.200910140. [DOI] [PMC free article] [PubMed] [Google Scholar]
- Menzies K.J., Hood D.A. The role of SirT1 in muscle mitochondrial turnover. Mitochondrion. 2012;12:5–13. doi: 10.1016/j.mito.2011.03.001. [DOI] [PubMed] [Google Scholar]
- Milne J.C., Lambert P.D., Schenk S., Carney D.P., Smith J.J., Gagne D.J., Jin L., Boss O., Perni R.B., Vu C.B., et al. Small molecule activators of SIRT1 as therapeutics for the treatment of type 2 diabetes. Nature. 2007;450:712–716. doi: 10.1038/nature06261. [DOI] [PMC free article] [PubMed] [Google Scholar]
- Murphy M.P. How mitochondria produce reactive oxygen species. Biochem J. 2009;417:1–13. doi: 10.1042/BJ20081386. [DOI] [PMC free article] [PubMed] [Google Scholar]
- Murray M.F. Nicotinamide: an oral antimicrobial agent with activity against both Mycobacterium tuberculosis and human immunodeficiency virus. Clin Infect Dis. 2003;36:453–460. doi: 10.1086/367544. [DOI] [PubMed] [Google Scholar]
- Narendra D., Tanaka A., Suen D.F., Youle R.J. Parkin is recruited selectively to impaired mitochondria and promotes their autophagy. J Cell Biol. 2008;183:795–803. doi: 10.1083/jcb.200809125. [DOI] [PMC free article] [PubMed] [Google Scholar]
- Oblong J.E. The evolving role of the NAD+/nicotinamide metabolome in skin homeostasis, cellular bioenergetics, and aging. DNA Repair (Amst) 2014;23:59–63. doi: 10.1016/j.dnarep.2014.04.005. [DOI] [PubMed] [Google Scholar]
- Olmos Y., Sanchez-Gomez F.J., Wild B., Garcia-Quintans N., Cabezudo S., Lamas S., Monsalve M. SirT1 regulation of antioxidant genes is dependent on the formation of a FoxO3a/PGC 1alpha complex. Antioxid Redox Signa. 2013;19:1507–1521. doi: 10.1089/ars.2012.4713. [DOI] [PMC free article] [PubMed] [Google Scholar]
- Petronilli V., Miotto G., Canton M., Colonna R., Bernardi P., Di Lisa F. Imaging the mitochondrial permeability transition pore in intact cells. Biofactors. 1998;8:263–272. doi: 10.1002/biof.5520080314. [DOI] [PubMed] [Google Scholar]
- Rao V.K., Carlson E.A., Yan S.S. Mitochondrial permeability transition pore is a potential drug target for neurodegeneration. Biochim Biophys Acta. 2014;1842:1267–1272. doi: 10.1016/j.bbadis.2013.09.003. [DOI] [PMC free article] [PubMed] [Google Scholar]
- Rennie G., Chen A.C., Dhillon H., Vardy J., Damian D.L. Nicotinamide and neurocognitive function. Nutr Neurosci. 2015;18:193–200. doi: 10.1179/1476830514Y.0000000112. [DOI] [PubMed] [Google Scholar]
- Sakakibara Y., Mitha A.P., Ogilvy C.S., Maynard K.I. Post-treatment with nicotinamide (vitamin B(3)) reduces the infarct volume following permanent focal cerebral ischemia in female Sprague-Dawley and wistar rats. Neurosci Lett. 2000;281:111–114. doi: 10.1016/s0304-3940(00)00854-5. [DOI] [PubMed] [Google Scholar]
- Santidrian A.F., LeBoeuf S.E., Wold E.D., Ritland M., Forsyth J.S., Felding B.H. Nicotinamide phosphoribosyltransferase can affect metastatic activity and cell adhesive functions by regulating integrins in breast cancer. DNA Repair (Amst) 2014;23:79–87. doi: 10.1016/j.dnarep.2014.08.006. [DOI] [PMC free article] [PubMed] [Google Scholar]
- Sasaki T., Maier B., Bartke A., Scrable H. Progressive loss of SIRT1 with cell cycle withdrawal. Aging Cell. 2006;5:413–422. doi: 10.1111/j.1474-9726.2006.00235.x. [DOI] [PubMed] [Google Scholar]
- Saunders L.R., Sharma A.D., Tawney J., Nakagawa M., Okita K., Yamanaka S., Willenbring H., Verdin E. miRNAs regulate SIRT1 expression during mouse embryonic stem cell differentiation and in adult mouse tissues. Aging (Albany NY) 2010;2:415–431. doi: 10.18632/aging.100176. [DOI] [PMC free article] [PubMed] [Google Scholar]
- Schneider M.P., Delles C., Schmidt B.M., Oehmer S., Schwarz T.K., Schmieder R.E., John S. Superoxide scavenging effects of N-acetylcysteine and vitamin C in subjects with essential hypertension. Am J Hypertens. 2005;18:1111–1117. doi: 10.1016/j.amjhyper.2005.02.006. [DOI] [PubMed] [Google Scholar]
- Starkov A.A., Fiskum G. Regulation of brain mitochondrial H2O2 production by membrane potential and NAD(P).H redox state. J Neurochem. 2003;86:1101–1107. doi: 10.1046/j.1471-4159.2003.01908.x. [DOI] [PubMed] [Google Scholar]
- Stevens M.J., Li F., Drel V.R., Abatan O.I., Kim H., Burnett D., Larkin D., Obrosova I.G. Nicotinamide reverses neurological and neurovascular deficits in streptozotocin diabetic rats. J Pharmacol Exp Ther. 2007;320:458–464. doi: 10.1124/jpet.106.109702. [DOI] [PubMed] [Google Scholar]
- Stowe D.F., Camara A.K. Mitochondrial reactive oxygen species production in excitable cells: modulators of mitochondrial and cell function. Antioxid Redox Signal. 2009;11:1373–1414. doi: 10.1089/ars.2008.2331. [DOI] [PMC free article] [PubMed] [Google Scholar]
- Thompson A.M., Wagner R., Rzucidlo E.M. Age-related loss of SirT1 expression results in dysregulated human vascular smooth muscle cell function. Am J Physiol Heart Circ Physiol. 2014;307:H533–541. doi: 10.1152/ajpheart.00871.2013. [DOI] [PubMed] [Google Scholar]
- Todisco S., Agrimi G., Castegna A., Palmieri F. Identification of the mitochondrial NAD+ transporter in Saccharomyces cerevisiae. J Biol Chem. 2006;281:1524–1531. doi: 10.1074/jbc.M510425200. [DOI] [PubMed] [Google Scholar]
- Twig G., Elorza A., Molina A.J., Mohamed H., Wikstrom J.D., Walzer G., Stiles L., Haigh S.E., Katz S., Las G., et al. Fission and selective fusion govern mitochondrial segregation and elimination by autophagy. EMBO J. 2008;27:433–446. doi: 10.1038/sj.emboj.7601963. [DOI] [PMC free article] [PubMed] [Google Scholar]
- Vercesi A.E., Castilho R.F., Meinicke A.R., Valle V.G., Hermes-Lima M., Bechara E.J. Oxidative damage of mitochondria induced by 5-aminolevulinic acid: role of Ca2+ and membrane protein thiols. Biochim Biophys Acta. 1994;1188:86–92. doi: 10.1016/0005-2728(94)90025-6. [DOI] [PubMed] [Google Scholar]
- Villalba J.M., Alcain F.J. Sirtuin activators and inhibitors. Biofactors. 2012;38:349–359. doi: 10.1002/biof.1032. [DOI] [PMC free article] [PubMed] [Google Scholar]
- Yang H., Yang T., Baur J.A., Perez E., Matsui T., Carmona J.J., Lamming D.W., Souza-Pinto N.C., Bohr V.A., Rosenzweig A., et al. Nutrient-sensitive mitochondrial NAD+ levels dictate cell survival. Cell. 2007;130:1095–1107. doi: 10.1016/j.cell.2007.07.035. [DOI] [PMC free article] [PubMed] [Google Scholar]
- Yao Y., Yang Y., Zhu W.G. Sirtuins: nodes connecting aging, metabolism and tumorigenesis. Curr Pharm Des. 2014;20:1614–1624. doi: 10.2174/13816128113199990513. [DOI] [PubMed] [Google Scholar]
- Zhang J., Fitsanakis V.A., Gu G., Jing D., Ao M., Amarnath V., Montine T.J. Manganese ethylene-bis-dithiocarbamate and selective dopaminergic neurodegeneration in rat: a link through mitochondrial dysfunction. J Neurochem. 2003;84:336–346. doi: 10.1046/j.1471-4159.2003.01525.x. [DOI] [PubMed] [Google Scholar]
- Zorov D.B., Juhaszova M., Sollott S.J. Mitochondrial reactive oxygen species (ROS) and ROS-induced ROS release. Physiol Rev. 2014;94:909–950. doi: 10.1152/physrev.00026.2013. [DOI] [PMC free article] [PubMed] [Google Scholar]
Associated Data
This section collects any data citations, data availability statements, or supplementary materials included in this article.