Abstract
Early-stage mammalian embryos develop in a low O2 environment (hypoxia). hES cells, however, are generally cultured under an atmosphere of 21% O2 (normoxia), under which conditions they tend to differentiate spontaneously. Such conditions may not be the most suitable, therefore, for hES cell propagation. Here we have tested two hypotheses. The first hypothesis was that hES cells would grow as well under hypoxic as under normoxic conditions. The second hypothesis was that hypoxic culture would reduce the amount of spontaneous cell differentiation that occurs in hES colonies. Both hypotheses proved to be correct. Cells proliferated as well under 3% and 5% O2 as they did under 21% O2, and growth was only slightly reduced at 1% O2. The appearance of differentiated regions as assessed morphologically, biochemically (by the production of human chorionic gonadotropin and progesterone), and immunohistochemically (by the loss of stage-specific embryonic antigen-4 and Oct-4 and gain of stage-specific embryonic antigen-1 marker expression) was markedly reduced under hypoxic conditions. In addition, hES cell growth under hypoxia provided enhanced formation of embryoid bodies. Hypoxic culture would appear to be necessary to maintain full pluripotency of hES cells.
Keywords: H1 cell, hypoxia, pluripotent, human chorionic gonadotropin, Oct-4 transcription factor
The pluripotency of hES cells endows them with an exciting potential for use in tissue repair and replacement. However, a serious shortcoming of hES cells for such application is their tendency to differentiate spontaneously in culture (1-3). In the case of mouse ES cells, differentiation can be prevented and continuous growth can be achieved by providing leukemia inhibitory factor to a complex medium conditioned by embryonic fibroblasts (4, 5). By contrast, ES cell lines from primates differentiate in the presence or absence of leukemia inhibitory factor in the medium (6, 7) and produce products characteristic of trophoblast and endoderm (1, 8, 9). Accordingly, their propagation in culture requires continual efforts, often manual picking or repeated early passage, to minimize the accumulation of differentiated cells.
hES cells are generally derived from the inner cell mass of blastocysts produced by in vitro fertilization techniques (1, 3, 10-13). It is not widely appreciated that the environment of the mammalian reproductive tract, to which naturally conceived embryos are exposed, is 1.5-5.3% O2 (14). Moreover, anaerobic bacteria are able to colonize the uterine lumen (15, 16). Embryos are exceedingly sensitive to oxidative damage (17-24), and blastocysts produced under low O2 have significantly more inner cell mass cells than those produced under higher O2 tensions (25). Accordingly, embryologists generally culture embryos under a low rather than high oxygen atmosphere (17-22). It is surprising, therefore, that general laboratory practice for culture of ES cells is an atmosphere of air and 5% or greater CO2. The hypothesis tested in the present work was that hES cells would grow efficiently under low O2 conditions and that their differentiation would be minimized.
In the paper, we refer to the ambient oxygen concentration as normoxic and to reduced oxygen concentrations in the range of 1-5% as hypoxic. We recognize that the ambient oxygen concentration is not the “normal,” i.e., normoxic, oxygen concentration experienced by most cells in the human body, particularly by the early preimplantation embryo. However, this convention is frequently used in the literature and is used throughout this paper.
Materials and Methods
Culture of hES Cells. A vial of H1 cells at passage 23 (frozen on March 20, 2003) purchased from WiCell Research Institute (Madison, WI) was thawed and plated into one well of a six-well tissue culture plate (Nunc, Sigma-Aldrich) containing a monolayer of γ-irradiated (8,000 cGy) mouse embryonic fibroblast (MEF) feeder cells. The culture medium [80% DMEM/F12 supplemented with 20% KnockOut serum replacement (Invitrogen)/1 mM l-glutamine/0.1 mM 2-mercaptoethanol/1% nonessential amino acids (Sigma-Aldrich)] was changed daily and supplemented with 4 ng/ml recombinant human fibroblast growth factor-2 (Invitrogen). Twelve days later, the six resulting colonies were treated with 1 mg/ml collagenase IV (Invitrogen) and transferred to a single well containing fresh MEF cells. Thereafter, cells were subcultured first 1:1 and subsequently 1:2, 1:3, and 1:4, respectively, at 7-day intervals to provide ≈6 × 10⁵ cells per well at each passage under a standard gas atmosphere of humidified air/5% CO2. In all subsequent passages (until passage 50), cells were subcultured 1:2 to 1:4 depending on the colony density in the well.
To study the effects of hypoxia, the six-well culture plates were kept in sealed chambers (MIC-101, Billups-Rothenberg, Del Mar, CA) filled with the appropriate humidified gas mixture (usually 3-5% O2/5% CO2/92-90% N2) in a standard tissue culture incubator at 37°C. The O2 content of each gas mixture used in an experiment had to be assessed by using a Fyrite gas analyzer (Bacharach, New Kensington, PA) because the gas manufacturer's values were unreliable. For feeder-free cultures, plates were coated with Matrigel (Becton Dickinson) diluted 1:30 in DMEM/F12 (Invitrogen), and the cells were grown in medium conditioned by MEF (26).
Morphometry. ES colonies were photographed under a Leica MZFLIII stereo microscope on a black stage (Fig. 1 A and B) or on an Olympus CKX41 inverted microscope (Figs. 1 C and E and 2; see Figs. 5A and 6) equipped with a digital camera [MagnaFire S99802 (Optronics International, Chelmsford, MA) and Coolpix 5000 (Nikon), respectively]. Areas of total colonies and differentiated areas within colonies were calculated from digital images of multiple colonies by using the MetaMorph imaging system (Universal Imaging, Downingtown, PA). Two-way comparisons, e.g., normoxia vs. hypoxia, were analyzed by an unpaired t test (prism 4, GraphPad, San Diego). For multiple comparisons, data were analyzed by one-way ANOVA followed by Tukey's multiple comparison test to compare selected pairs of experimental groups. Data are presented as the mean ± SEM in μm2. Differences of P < 0.05 were considered significant.
Fig. 1.
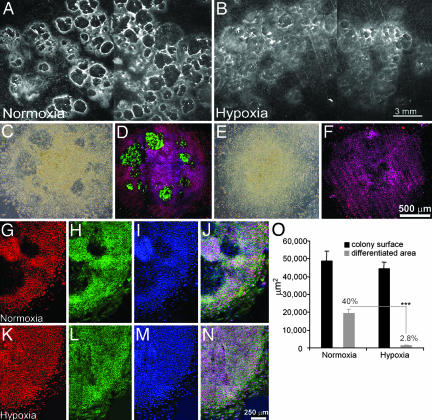
Differentiation of H1 cell colonies cultured under normoxic or hypoxic conditions. (A and B) H1 cells (passage 30) were cultured on MEF feeder cells under normoxic (A) or hypoxic (5% O2)(B) conditions for 12 days and photographed under a stereomicroscope. Differentiated areas appear dark and are surrounded by bright rings. (Bar, 3 mm.) (C-F) H1 cell colonies (passage 36) grown on Matrigel-coated, feeder-free coverslips are shown after culture under normoxic (21% O2)(C and D) or hypoxic conditions (4% O2)(E and F). (C and E) Phase contrast images. Under phase contrast, differentiated areas containing the larger, flatter cells appear darker than the areas occupied by undifferentiated ES cells. (D and F) The colonies have been immunostained for SSEA-1 (green) and Oct-4 (red). Nuclei are colored blue. SSEA-1-positive cells are confined to areas of differentiation, which are not evident in the cells grown under hypoxia. Note the lack of overlap of SSEA-1 and Oct-4 staining. (Bar, 500 μm.) (G-I) Cells cultured as above under normoxia were immunostained for Oct-4 (red) (G), SSEA-4 (green) (H), and TO-PRO-3 (blue) (I) to stain nuclei. (J) The colocalization of Oct-4 and SSEA-4 staining and the absence of both antigens in the differentiated areas. (K-N) Colonies grown under hypoxia and stained as in G-J. (Bar, 250 μm.) (O) Morphometric analysis of differentiated areas within H1 colonies (passage 30) after growth for 12 days under either normoxic or hypoxic (5% O2) conditions. Data for each condition were obtained from the analysis of 15 colonies randomly sampled from three independent culture wells. The graph compares total colony area (black bars) with the overt differentiation area (gray bars). ***, P < 0.0001.
Fig. 2.
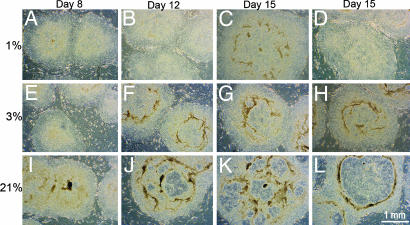
Morphologies of H1 cell colonies cultured under either normoxic or increasingly hypoxic conditions. The H1 cells (passage 36) were cultured under 1%, 3%, or 21% O2, respectively, for 15 days, and representative colonies were photographed at days 8, 12, and 15 with a 4× objective under darkfield illumination. Differentiated areas appear darker than the more uniform, surrounding regions of undifferentiated ES cells. (Bars, 1 mm.)
Fig. 5.
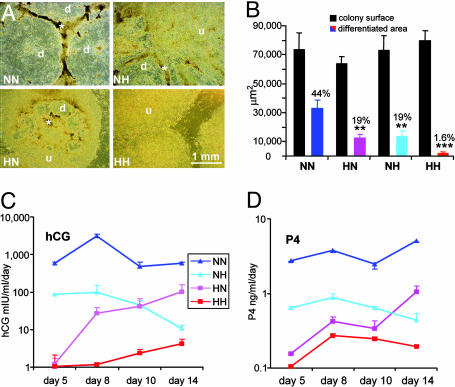
The effects of switching gaseous atmosphere on the morphology and hormone production of hES colonies maintained under normoxic or hypoxic conditions before passage. H1 cells (p31) that were cultured under normoxic or hypoxic conditions for 13 days were subcultured 1:2. (A) The general morphologies of the colonies are presented. d, differentiated areas within colonies; u, undifferentiated areas; *, areas in the transition zones where cells appear to be forming multilayers. (Bar, 1 mm.) (B) Relative areas of overt differentiation were calculated relative to total colony area. Values in columns are means ± SEM for 12-14 colonies from two separate wells per treatment. Black bars show total colony size. Colored bars (NN, blue; HN, pink; NH, azure; HH, red) reflect differentiated areas. (C and D) Daily amounts of hCGβ and P4 produced by the cells.
Fig. 6.
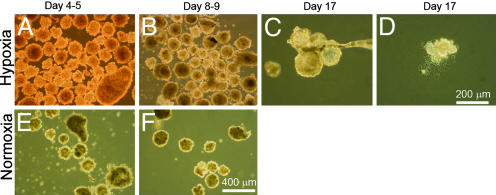
EB formation after culture under normoxic or hypoxic conditions. EB bodies were produced from cells (passage 40; ≈2 × 10⁶ cells per well) that had been continuously passaged under hypoxic (Upper) or normoxic (Lower) conditions for ≈4 months. (A and E) EB on days 4 and 5. (B and F) EB on days 8 and 9. (Bar, 0.4 mm.) (C and D) Cystic bodies (C) and attached EB cell explants (D) derived from cells that had been maintained under hypoxic conditions at day 17. (Bar, 0.2 mm.)
Immunofluorescence Microscopy. ES cell colonies were grown on coverslips coated with poly-l-lysine plus Matrigel and placed in six-well tissue culture plates. After fixation in 2% paraformaldehyde/PBS for 30 min and permeabilization in 1.0% Triton X-100/PBS for 30 min, 0.2 ng/μl anti-Oct-4, 2.5 ng/μl anti-stage-specific embryonic antigen (anti-SSEA)-1 (MC480), and 2.5 ng/μl SSEA-4 (MC813-70) antibodies (Developmental Studies Hybridoma Bank, Iowa City, IA) were probed overnight at 4°C. Affinity-purified anti-Oct-4 antibody was raised by rabbit immunization with GST-fused mouse Oct-4 N-terminal region (amino acids 1-138). Secondary antibody staining was done with fluorescein-labeled (Alexa Fluor 568 and 488) goat anti-rabbit and goat anti-mouse antibodies (Molecular Probes) at a 1:200 dilution. Nuclei were labeled with TO-PRO-3 (Molecular Probes). Immunostaining for chorionic gonadotropin (CG)β was carried out based on a published procedure (27) and incubated with mouse anti-human CGβ antibody (Spring Bioscience, Fre-mont, CA) at a 1:50 dilution (4 ng/μl), followed by fluorescein-labeled (Alexa Fluor 488) goat anti-mouse IgG antibody at a 1:1,000 dilution. Nuclei were stained with 0.5 ng/μl Hoechst 33258 (Sigma-Aldrich), which was included during the secondary antibody incubation step. Images were captured with the Radiance 2000 confocal system (Bio-Rad) coupled to an Olympus IX70 inverted microscope.
Immunoassays. The collected media were stored at -20°C until assay. Human CG (hCG) was measured by using a solid-phase sandwich hCG ELISA kit (catalog no. BQ 047F, Bio-Quant, San Diego). Standards were supplied by the manufacturer, and the sensitivity of the system was 0.53 milliunits/ml. Progesterone (P4) was measured by an RIA (Coat-A-Count, Diagnostic Products, Los Angeles) with a sensitivity of 0.02 ng/ml. α-Fetoprotein (AFP) measurements were performed with a direct solid-phase sandwich ELISA (catalog no. BQ 064T, Bio-Quant) with a sensitivity of 0.348 ng/ml. For all assays, samples were appropriately diluted to fall within the recommended ranges of the standard curves and values were monitored to ensure consistency between assays.
DNA Measurements. DNA samples from cells were prepared by using TRIzol reagent (Invitrogen) according to the manufacturer's instructions. Reagent (1 ml) was added directly to each well. Extracts from three wells representing the same treatment group were combined.
Formation of Embryoid Bodies (EBs). A protocol for EB formation established by Geron (Menlo Park, CA) was used. Briefly, H1 cells growing feeder-free cultures (≈2 × 10⁶ cells per well) were treated with collagenase IV and scraped and transferred into low attachment plates (catalog no. 29443-030, Corning) in a 1:1 split ratio. When the cells were subcultured, the culture media were also changed to differentiation media [80% DMEM/F12 supplemented with 20% FBS (not heat-inactivated), 1 mM l-glutamine, 0.1 mM 2-mercaptoethanol, and 1% nonessential amino acids]. The medium was changed every the other day, and the number of EBs were counted after a week.
Results
Morphology and Stem Cell Marker Expression of hES Colonies. After continuous weekly passage in air/5% CO2, H1 ES cells were subcultured to either hypoxic (3-5% O2) or normoxic (21% O2) conditions on irradiated feeder layers of MEF in culture medium supplemented with 4 ng/ml fibroblast growth factor-2. Little overt morphological differentiation occurred under the contrasting conditions during the first 7 days of culture. At around day 9, circular areas of enlarged and flattened cells with translucent cytoplasms became evident under normoxic conditions (Figs. 1C and 2 I and J). When viewed under a stereomicroscope on a black background, the differentiated areas present in the colonies appeared dark with bright rings around their peripheries (Fig. 1 A). These regions of overt differentiation were SSEA-1-positive and did not express markers of pluripotent stem cells, Oct-4, or SSEA-4 (Fig. 1 C, D, and G-J) (1, 6). Under hypoxic conditions, the differentiated areas were smaller in size and less numerous. Furthermore, expression of Oct-4 and SSEA-4 was maintained throughout the colony (Fig. 1 E, F, and K-N). Although average colony size did not differ between normoxic (48,895.6 ± 5,536.8 μm2) and hypoxic conditions (44,652.6 ± 3,563.5 μm2), the differentiated areas per colony were markedly different (normoxia, 19,513.5 ± 2,254.6 μm2 or 40.0%; hypoxia, 1,238.1 ± 319.0 μm2 or 2.8%; P < 0.0001) after growth for 12 days. The ability of hypoxia to minimize differentiation was observed in hES cells cultured on feeder layers (Figs. 1 A and B and 2) and hES cells cultured under feeder-free conditions (Fig. 1 C and E). Therefore, the effects of O2 are direct and not manifested through the MEF feeder layer.
Colony Growth and Morphology Under Severely Hypoxic Conditions. To examine the colony growth and morphology under more severely hypoxic conditions, ES cells were subcultured and then maintained continuously under atmospheres of 21%, 3%, or 1% O2. Colony numbers and average colony surface areas with 21%, 3%, or 1% O2 did not differ (Table 1). Although less DNA was recovered from the pooled colonies grown at 1% O2 as compared with either 3% or 21% O2, it remains unclear whether this difference is significant. The colonies grown at 21% O2 began to show signs of overt differentiation in the central regions of the colonies by day 10, and these differentiated areas had greatly expanded by day 15 (Fig. 2 I-L). In contrast, colonies grown under hypoxic conditions (3% and 1% O2) demonstrated little, if any, signs of morphological differentiation by day 15 (Fig. 2 A-H).
Table 1. Growth of hES colonies under conditions of increasing hypoxia.
| O2 concentration, % | Colonies, n | Colonies per well, n | Colony surface area, μm2 (n) | DNA per well, μg | DNA per colony, ng | Est. cells per well, n |
|---|---|---|---|---|---|---|
| 21 | 238 | 79.3 ± 15.5 | 72,189 ± 4,343 (35) | 14.2 | 179 | 2.37 × 10⁶ |
| 3 | 260 | 86.7 ± 5.9 | 71,932 ± 3,669 (35) | 14.9 | 172 | 2.48 × 10⁶ |
| 1 | 260 | 86.7 ± 6.4 | 62,833 ± 5,656 (36) | 9.45 | 109 | 1.57 × 10⁶ |
A comparison of hES cell colony growth under normoxic and increasingly severe hypoxic conditions. H1 cells (passage 36) were subcultured into nine wells in three independent six-well plates (three wells per plate) and cultured under 21%, 3%, or 1% O2, respectively. Colony sizes were measured on day 15. DNA from colonies was pooled prior to assay and corrected for the amount of MEF cell DNA (0.735 μg per well) present in equivalent wells without ES cells. The number of colonies (P = 0.85) and colony surface area (P = 0.27) did not differ between O2 concentrations. Under colony surface area, the values in parentheses are the numbers of colonies examined. Est., Estimated.
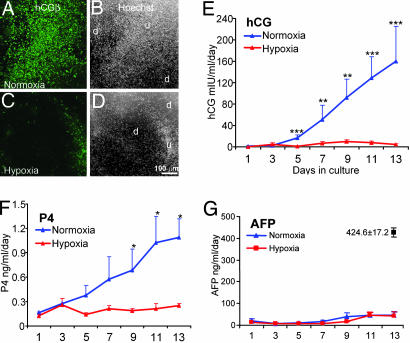
Production of hCG and P4. hES (1, 3) and primate (2, 8, 9) ES cells produce CG during progressive time in culture, possibly reflecting spontaneous differentiation along the trophoblast lineage. The H1 cells did not produce detectable hCG under either hypoxic or normoxic conditions during the initial 3 days after subculture (Fig. 3E). However, by day 5, concentrations began to rise in hES cells under a normoxic atmosphere (16.6 ± 5.4 milliunits·ml-1·day-1; n = 13). After day 5, ES cells under normoxic conditions continued to increase their hCG production, which reached 159.6 ± 65.6 milliunits·ml-1·day-1 by day 13. No hCG expression was detected in hES cells under hypoxic conditions until day 7, and concentrations remained low and somewhat variable thereafter. At day 13, daily production of hCG by hypoxic cultures averaged ≈1/40 that of the normoxic cultures (4.4 ± 1.6 milliunits·ml-1·day-1). Production of P4 remained close to the lower sensitivity limit of the assay over 13 days of hypoxic culture, but daily production increased steadily over time under normoxic conditions (Fig. 3F) and by day 9 began to show significant P4 production difference from those under hypoxia (P < 0.05, n = 4). The biochemical data are consistent with the morphometric measurements and indicate that overt differentiation is much more marked in hES cells under normoxic conditions rather than under hypoxic conditions. The relatively early rise in hCG production suggests that differentiation begins earlier after passage than inferred from the morphology of the ES colonies.
Fig. 3.
Differentiation of hES cell colonies as determined by immunohistochemical and biochemical analysis. (A-D) Detection of hCGβ by immunofluorescence (green) (A and C) and of nuclei by Hoechst 33258 (white) (B and D) in the H1 cells cultured under normoxic (A and B) or hypoxic (C and D) conditions for 12 days. The photographs encompass areas of overt differentiation (d), which have fewer nuclei and, hence, show less fluorescence with Hoechst dye than the areas appearing undifferentiated (u). CGβ signals (green) (A and C) are largely confined to cells in the “transition zone” between the overtly differentiated areas and the more uniform, undifferentiated areas. (Bar, 100 μm.) (E) The mean daily production of hCG by H1 cells from five independent experiments carried out at passages 30, 31, 32, 36, and 50 under normoxic or hypoxic culture. Values are means ± SEM for 15 independent determinations (n = 3 for each experiment). Values that differ significantly are shown with asterisks (***, P < 0.001; **, P < 0.01; *, P < 0.05). (F) The mean daily production of P4 from four wells in two independent experiments (passages 30 and 31). Values that differ significantly (P < 0.05) are shown with an asterisk. (G) The mean daily production of AFP from the same five independent experiments described in E. No significant differences were observed between normoxic and hypoxic conditions on any of the days of culture, and the production levels were much lower than those observed in H9 cells (1) as indicated (▪).
Production of AFP Under Normoxic and Hypoxic Conditions. AFP is expressed by a range of cells derived from embryonic endoderm and by primate ES cells (1, 3, 8). Accordingly, AFP production could provide a measure of differentiation along the endoderm lineage. Cells cultured under oxygen conditions gradually increased AFP production during the 13-day culture period (46.4 ± 16.1 ng/ml under normoxic conditions and 43.3 ± 16.9 ng/ml under hypoxic conditions), and AFP production did not differ significantly between culture conditions on any of the days of culture (P = 0.17 and 0.77 on days 7 and 9, respectively; n = 15) (Fig. 3G). These amounts of AFP are ≈1/10th of those reported by others who used H9 cells cultured under similar conditions (1) compared with those used in the present experiments.
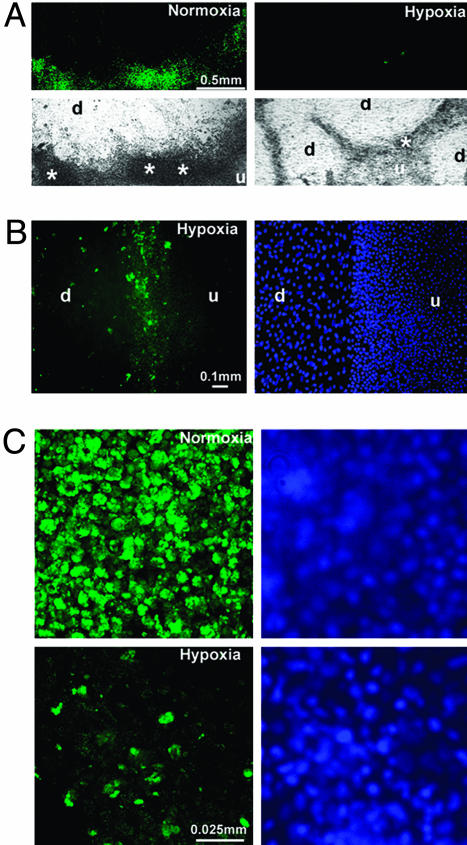
Localization of hCGβ-Producing Cells. The number of cells per colony expressing hCG was much lower and their fluorescence intensities generally less in hypoxic cultures than in normoxic cultures (Fig. 3 A and C). In both culture conditions, the hCGβ-positive cells were concentrated at the periphery of the zones of overt differentiation corresponding to the bright rings in Fig. 1 A. The larger flattened cells in the differentiated areas were generally negative for hCGβ, although a few scattered cells showing fluorescence were evident (Fig. 4 A and B). Fluorescence was particularly intense in the transition zones where the differentiated areas show signs of encroaching on each other (Figs. 3 A and C and 4 A and B). In such regions of the colony, cells formed multilayers and tended to pile up over each other (Figs. 4A and 5A, asterisks). The cells that were positive for hCGβ, although larger than typical neighboring stem cells, appeared to be mononuclear and not syncytial. Under normoxia and hypoxia, the antigen was concentrated in vesicles within the cytoplasm (Fig. 4C).
Fig. 4.
Colony morphology and hCG expression after culture of H1 cells under either normoxic or hypoxic conditions for 12 days. (A) Immunofluorescent localization of hCGβ (green) (Upper) and brightfield images (Lower) of the H1 cell colonies (passage 50) cultured under normoxic (Left) or hypoxic (Right) conditions for 12 days. d, differentiated area; u, undifferentiated area; *, transition zone where cells pile up and express hCGβ. (Bar, 0.5 mm.) (B) Immunolocalization of hCGβ (green) (Left) and corresponding Hoechst nuclear staining (Right) in a colony cultured under hypoxic conditions for 12 days. (Bar, 100 μm.) (C) Immunofluorescent detection of hCGβ (green) (Left) and nuclear staining by Hoechst 33258 (blue) (Right) in the H1 cell colonies (passage 50) cultured under normoxic (Upper) and hypoxic (Lower) conditions for 12 days. (Bar, 25 μm.)
Crossover Study. Preliminary experiments suggested that continuous culture of hES cells for several passages under hypoxia reduced the extent of differentiation even more than as seen in Figs. 1 and 3. Accordingly, we designed a crossover experiment in which 13-day cultures grown under normoxic or hypoxic conditions were passaged without any attempt to remove differentiated areas and subsequently cultured under hypoxic conditions (NH) or normoxic conditions (HN), respectively, for 14 days. As controls, normoxic cells were passaged to normoxic conditions (NN) and hypoxic cells were passaged to hypoxic conditions (HH). As in the earlier experiments, colony size (NN, 73,788 ± 11,194 μm2; NH, 73,166 ± 9,845 μm2; HN, 64,111 ± 4,767 μm2; and HH, 79,809 ± 6,891 μm2) did not differ (P = 0.64) across treatments. In HH conditions, very few areas of overt differentiation were visible in any of the colonies (Fig. 5A), whereas 44% of the areas within NN colonies were overtly differentiated (Fig. 5 A and B). The cultures with a gas atmosphere change from normoxic to hypoxic (NH) and vice versa (HN) provided a much lower degree of overall differentiation (mean value, ≈19%) (Fig. 5B) as compared with that seen in the NN cultures. However, closer examination of the NH and HN colonies did reveal differences. Whereas the HN cultures were quite uniform with regard to differentiated area per culture (Fig. 5A, HN), the NH cultures contained two types of colonies. One type of colony was well differentiated (differentiated area, 26,107 ± 3527 μm2; total colony surface area, 74,781 ± 12,850 μm2; 30.9%; n = 6), whereas the other type of colony was largely undifferentiated (differentiated area, 1,330 ± 355 μm2; total colony surface area, 55,764 ± 6,518 μm2; 2.4%; n = 7) (Fig. 5A, NH). The extent of manifest differentiation of the two types of colonies was significantly different (P < 0.0001), whereas colony sizes did not differ significantly (P = 0.07). A possible explanation for these data are that the enzymatic dissociation used in subculture, which produces clumps rather than individual cells, provides new colonies derived from areas of either high or low differentiation.
The production of hCG over 14 days paralleled the morphological changes described above (Fig. 5C). HH colonies produced no detectable hCG until day 8 and extremely small amounts thereafter (2.4 ± 0.6 and 4.2 ± 1.3 milliunits·ml-1·day-1 on days 10 and 14, respectively). By day 5 of the culture, NN cultures were producing >500 milliunits·ml-1·day-1, and this daily production level was increased to >3,000 milliunits·ml-1·day-1 on day 8. In contrast, NH cultures initially produced relatively high amounts of hCG (98.6 ± 50.5 milliunits·ml-1·day-1 on day 8), but daily production declined markedly thereafter so that by day 14 the amount of hormone released from the cultures was quite low (10.5 ± 2.3 milliunits·ml-1·day-1), suggesting that hypoxia not only halted further differentiation but was actually able to reverse the process. As expected, the HN cultures produced very little hormone immediately after passage. As the cultures continued to grow, the production of hCG increased (26.9 ± 12.3 milliunits·ml-1·day-1 on day 8; 101.2 ± 54.3milliunits·ml-1·day-1 on day 14). Measurement of daily synthesis of P4 was consistent with the hCG data (Fig. 5D).
EB Formation. hES cells can readily be induced to form EBs. To explore the effects of hypoxia on this conversion, H1 cells (≈2 × 10⁶ cells per well), which had been maintained under hypoxic conditions for eight successive passages (passages 33-40), were compared for their ability to form EBs with an identical number of cells that had been maintained under normoxic conditions for a comparable time period. During the early stages of culture, both groups of cells formed dense, simple EBs (Fig. 6 A, B, E, and F), but the number formed was significantly higher from those cells that had previously been maintained under hypoxic conditions and subsequently allowed to form EBs under hypoxic conditions than from the cells and EBs that had been cultured continuously under normoxic conditions (44 ± 3.3, n = 10, vs. 8.6 ± 2.1, n = 6; P < 0.0001). As EB culture progressed, 16% of the EBs under the former, hypoxic conditions attached to the substratum and developed outgrowths (Fig. 6D), and the majority developed cystic structures (Fig. 6C). The EB from the normoxic condition showed poorer attachment (<2%), and fewer of the EBs (≈10%) developed cystic structures.
Discussion
There is little doubt that the early environment to which a human embryo is exposed is hypoxic (28). Indeed, it is only at approximately week 11 of pregnancy that maternal blood begins to flow freely through the spiral arteries at the placental site (29, 30), thereby raising the local partial pressure of O2 (31). The low O2 tensions encountered during early pregnancy have profound effects on trophoblast, maintaining cytotrophoblast in a proliferative state, reducing invasiveness, and limiting differentiation toward end-stage cells (32-35). The ES colonies maintained at low O2 show less signs of overt morphological differentiation than normoxic colonies. This evidence for lack of differentiation derived from the appearance of the colonies is reinforced by immunohistochemical and biochemical analyses. The patches of flattened, larger cells, for example, stained for SSEA-1 but were negative for the pluripotent markers Oct-4 and SSEA-4 (Fig. 1D and G-J), and cultures maintained under low O2 produced very low amounts of hCG and P4 compared with normoxic control cultures. It has also become clear from these experiments that passaging colonies from normoxic to hypoxic conditions results in the carryover of some preexisting differentiated cells, which persist into the subsequent culture period (Fig. 5). Our experience suggests that hES cells are best maintained under an atmosphere 1-4% O2 and that atmospheric 21% O2 is best avoided if spontaneous differentiation is to be minimized. In addition, the colonies do not need to be passaged as frequently when maintained at low O2, and there may be less chance of transferring cells already earmarked for differentiation but not easily distinguished under the microscope.
The regions of overt differentiation that appear in the middle of the hES colonies under normoxic conditions do not comprise a single cell type (Figs. 3A and 4). The cells that produce hCG are a minority of the total cell population and occur most frequently at the very edge of the differentiated area, although cells not synthesizing the hormone appear also to be present among them. The majority of the hCGβ-positive cells are observed in the transition zone around the perimeter of the differentiated area, where the cells are often observed in multilayers (Fig. 4 A and B). A rather similar phenomenon of disorganized differentiation occurs in EBs derived from hES cells (36). This pattern of differentiation is distinct from that occurring when hES colonies are treated with bone morphogenetic protein-4, which causes a synchronized and larger scale differentiation of trophoblast-like cells at the periphery of the colony (37). Preliminary results from this laboratory have shown that hypoxia markedly reduces bone morphogenetic protein-4-regulated hCG production as well as the ring of hCG-positive cells that appear on the colony margins, although cells on the periphery of the colony still appear to be differentiating in the sense that that they are larger, flatter, and less uniform in appearance than those placed internally. These data suggest that hypoxia does not prevent hES cells from differentiating when they are presented with the appropriate cues.
Together, these experiments support our hypothesis that low O2 tension prevents differentiation of hES cell colonies and is likely required to maintain the majority of cells within a colony in a fully pluripotent state. The data also suggest that cryptic differentiation within ES colonies may precede overt differentiation and that there is likely carryover of committed cells when ES cells, grown under normoxic conditions, are passaged. This heterogeneity within cultures may be one explanation as to why hES cells vary so much in gene expression (38-41) and why it has been so difficult to define a “stemness” phenotype (42).
Acknowledgments
We thank Shrikesh Sachdev and Mark Hannink for insightful discussion and critical reading of the manuscript and Mayandi Sivaguru for technical help with the confocal microscopy and the assemblage of the photographic images. Leann Crandall, Daisy Manning, and Kaitie Heuvel (WiCell Research Institute) provided initial training for hES cell culture and technical advice. This work was supported by National Institutes of Health Grants HD042201 and HD21896.
Author contributions: T.E. and R.M.R. designed research; T.E. and P.D. performed research; T.E. analyzed data; T.E. and R.M.R. wrote the paper; and P.D. conducted all the immunohistochemistry experiments.
Abbreviations: MEF, mouse embryonic fibroblast; CG, chorionic gonadotropin; hCG, human CG; P4, progesterone; AFP, α-fetoprotein; EB, embryoid body; SSEA, stage-specific embryonic antigen; NN, normoxic cells passaged to normoxic conditions; HH, hypoxic cells passaged to hypoxic conditions; NH, normoxic cells passaged to hypoxic conditions; HN, hypoxic cells passaged to normoxic conditions.
References
- 1.Thomson, J. A., Itskovitz-Eldor, J., Shapiro, S. S., Waknitz, M. A., Swiergiel, J. J., Marshall, V. S. & Jones, J. M. (1998) Science 282, 1145-1147. [DOI] [PubMed] [Google Scholar]
- 2.Thomson, J. A. & Marshall, V. S. (1998) Curr. Top. Dev. Biol. 38, 133-165. [DOI] [PubMed] [Google Scholar]
- 3.Reubinoff, B. E., Pera, M. F., Fong, C. Y., Trounson, A. & Bongso, A. (2000) Nat. Biotechnol. 18, 399-404. [DOI] [PubMed] [Google Scholar]
- 4.Williams, R., Hilton, D., Pease, S., Willson, T., Stewart, C., Gearing, D., Wagner, E., Metcalf, D., Nicola, N. & Gough, N. (1988) Nature 336, 684-687. [DOI] [PubMed] [Google Scholar]
- 5.Niwa, H. (2001) Cell Struct. Funct. 26, 137-148. [DOI] [PubMed] [Google Scholar]
- 6.Odorico, J. S., Kaufman, D. S. & Thomson, J. A. (2001) Stem Cells 19, 193-204. [DOI] [PubMed] [Google Scholar]
- 7.Rossant, J. (2001) Stem Cells 19, 477-482. [DOI] [PubMed] [Google Scholar]
- 8.Thomson, J. A., Kalishman, J., Golos, T. G., Durning, M., Harris, C. P., Becker, R. A. & Hearn, J. P. (1995) Proc. Natl. Acad. Sci. USA 92, 7844-7848. [DOI] [PMC free article] [PubMed] [Google Scholar]
- 9.Thomson, J. A., Kalishman, J., Golos, T. G., Durning, M., Harris, C. P. & Hearn, J. P. (1996) Biol. Reprod. 55, 254-259. [DOI] [PubMed] [Google Scholar]
- 10.Amit, M. & Itskovitz-Eldor, J. (2002) J. Anat. 200, 225-232. [DOI] [PMC free article] [PubMed] [Google Scholar]
- 11.Trounson, A. O. (2001) Reprod. Fertil. Dev. 13, 523-532. [DOI] [PubMed] [Google Scholar]
- 12.Cowan, C. A., Klimanskaya, I., McMahon, J., Atienza, J., Witmyer, J., Zucker, J. P., Wang, S., Morton, C. C., McMahon, A. P., Powers, D., et al. (2004) N. Engl. J. Med. 350, 1353-1360. [DOI] [PubMed] [Google Scholar]
- 13.Heins, N., Englund, M. C., Sjoblom, C., Dahl, U., Tonning, A., Bergh, C., Lindah, A., Hanson, C. & Semb, H. (2004) Stem Cells 22, 367-376. [DOI] [PubMed] [Google Scholar]
- 14.Fischer, B. & Bavister, B. (1993) J. Reprod. Fertil. 99, 673-679. [DOI] [PubMed] [Google Scholar]
- 15.Evaldson, G., Heimdahl, A., Kager, L. & Nord, C. (1982) Scand. J. Infect. Dis. Suppl. 35, 9-15. [PubMed] [Google Scholar]
- 16.Egwari, L., Rotimi, V., Abudu, O. & Coker, A. (1995) Cent. Afr. J. Med. 41, 391-397. [PubMed] [Google Scholar]
- 17.Betterbed, B. & Wright, R. W. (1985) Theriogenology 23, 547-553. [DOI] [PubMed] [Google Scholar]
- 18.Nakao, H. & Nakatsuji, N. (1990) Theriogenology 33, 591-600. [DOI] [PubMed] [Google Scholar]
- 19.Thompson, J. G., Sompson, A. C., Pugh, P. A., Donnelly, P. E. & Tervit, H. R. (1990) J. Reprod. Fertil. 89, 573-578. [DOI] [PubMed] [Google Scholar]
- 20.Fukui, Y., McGowan, L. T., James, R. W., Pugh, P. A. & Tervit, H. R. (1991) J. Reprod. Fertil. 92, 125-131. [DOI] [PubMed] [Google Scholar]
- 21.Bernardi, M. L. & Delouis, C. (1996) Hum. Reprod. 11, 621-626. [DOI] [PubMed] [Google Scholar]
- 22.Lim, J. M., Reggio, B. C., Godke, R. A. & Hansel, W. (1999) Hum. Reprod. 14, 458-464. [DOI] [PubMed] [Google Scholar]
- 23.Olson, S. E. & Seidel, G. E., Jr. (2000) Biol. Reprod. 62, 248-252. [DOI] [PubMed] [Google Scholar]
- 24.De Matos, D. G. & Furnus, C. C. (2000) Theriogenology 53, 761-771. [DOI] [PubMed] [Google Scholar]
- 25.Harvey, A. J., Kind, K. L., Pantaleon, M., Armstrong, D. T. & Thompson, J. G. (2004) Biol. Reprod. 71, 1108-1119. [DOI] [PubMed] [Google Scholar]
- 26.Xu, C., Inokuma, M. S., Denham, J., Golds, K., Kundu, P., Gold, J. D. & Carpenter, M. K. (2001) Nat. Biotechnol. 19, 971-974. [DOI] [PubMed] [Google Scholar]
- 27.Plath, K., Fang, J., Mlynarczyk-Evans, S. K., Cao, R., Worringer, K. A., Wang H., de la Cruz, C. C., Otte, A. P., Panning, B. & Zhang, Y. (2003) Science 300, 131-135. [DOI] [PubMed] [Google Scholar]
- 28.Aplin, J. (2000) J. Clin. Invest. 105, 559-560. [DOI] [PMC free article] [PubMed] [Google Scholar]
- 29.Burton, G., Jauniaux, E. & Watson, A. L. (1999) Am. J. Obstet. Gynecol. 181, 718-724. [DOI] [PubMed] [Google Scholar]
- 30.Jaffe, R., Jauniaux, E. & Hustin, J. (1997) Am. J. Obstet. Gynecol. 176, 695-705. [DOI] [PubMed] [Google Scholar]
- 31.Rodesch, F., Simon, P., Donner, C. & Jauniaux, E. (1992) Obstet. Gynecol. 80, 283-285. [PubMed] [Google Scholar]
- 32.Genbacev, O., Joslin, R., Damsky, C. H., Polliotti, B. M. & Fisher, S. J. (1996) J. Clin. Invest. 97, 540-550. [DOI] [PMC free article] [PubMed] [Google Scholar]
- 33.Genbacev, O., Zhou, Y., Ludlow, J. W. & Fisher, S. J. (1997) Science 277, 1669-1672. [DOI] [PubMed] [Google Scholar]
- 34.Adelman, D., Gertsenstein, M., Nagy, A., Simon, M. C. & Maltepe, E. (2000) Genes Dev. 14, 3191-3203. [DOI] [PMC free article] [PubMed] [Google Scholar]
- 35.Caniggia, I., Mostachfi, H., Winter, J., Gassmann, M., Lye, S. J., Kuliszewski, M. & Post, M. (2000) J. Clin. Invest. 105, 577-587. [DOI] [PMC free article] [PubMed] [Google Scholar]
- 36.Gerami-Naini, B., Dovzhenko, O. V., Durning, M., Wegner, F. H., Thomson, J. A. & Golos, T. G. (2004) Endocrinology 145, 1517-1524. [DOI] [PubMed] [Google Scholar]
- 37.Xu, R., Chen, X., Li, D. S., Li, R., Addicks, G. C., Glennon, C., Zwaka, T. P. & Thomson, J. A. (2002) Nat. Biotechnol. 20, 1261-1264. [DOI] [PubMed] [Google Scholar]
- 38.Henderson, J. K., Draper, J. S., Baillie, H. S., Fishel, S., Thomson, J. A., Moore, H. & Andrews, P. W. (2002) Stem Cells 20, 329-337. [DOI] [PubMed] [Google Scholar]
- 39.Abeyta, M. J., Clark, A. T., Rodriguez, R. T., Bodnar, M. S., Pera, R. A. & Firpo, M. T. (2004) Hum. Mol. Genet. 13, 601-608. [DOI] [PubMed] [Google Scholar]
- 40.Carpenter, M. K., Rosler, E. S., Fisk, G. J., Brandenberger, R., Ares, X., Miura, T., Lucero, M. & Rao, M. S. (2004) Dev. Dyn. 229, 243-258. [DOI] [PubMed] [Google Scholar]
- 41.Rosler, E. S., Fisk, G. J., Ares, X., Irving, J., Miura, T., Rao, M. S. & Carpenter, M. K. (2004) Dev. Dyn. 229, 259-274. [DOI] [PubMed] [Google Scholar]
- 42.Evsikov, A. V. & Solter, D. (2003) Science 302, 393 (lett.). [DOI] [PubMed] [Google Scholar]


