

To the Editor
Diagnosis and control of coronary heart disease (CHD) risk factors have received particular emphasis in the guidelines issued since 1977 (blood pressure) and 1985 (lipids).1,2 Yet on a population level, little is known about how these efforts have altered CHD incidence and its association with modifiable risk factors. This study explored: 1) how the associations between modifiable risk factors and CHD events changed between 1983–1995 and 1996–2011; and 2) during this timeframe, whether or not the population attributable fractions (PAFs) of CHD due to modifiable risk factors were altered.
Methods
Individual patient-level data from five observational cohort studies (Table) available in the National Heart, Lung, and Blood Institute’s Biologic Specimen and Data Repository Information Coordinating Center (BioLINCC) were pooled.3 Two analytic datasets were created: one with baseline data collected between 1983 and 1990 (earlier era) and one with baseline data collected between 1996 and 2002 (later era). Participants aged 40–79 years free of cardiovascular disease were selected from each period and matched on age (within 2 years), race (black vs. non-black), and sex. Each cohort was followed for up to 12 years (final year 2011) for new onset CHD (i.e., myocardial infarction, coronary death, angina, coronary insufficiency) using outcomes available in BioLINCC. A piecewise constant hazards model adjusted for age, sex, and race was used to estimate the hazard ratios (HRs) of CHD due to systolic blood pressure (SBP), diabetes, smoking (current/within past year), and total-to-high-density lipoprotein cholesterol (total:HDL-C) ratio.4 Blood pressure and total cholesterol were adjusted for treatment using a nonparametric approach.5,6 HRs were compared by testing risk factor-era interaction. Population-attributable fractions were computed and compared using 10-year survival probabilities from the model with confidence intervals (CIs) derived using the delta method and log transformation.7 Analysis was approved by the Duke University Institutional Review Board and conducted using SAS version 9.4. Statistical significance used two-sided α=0.05.
Table.
Characteristics of Participants from NHLBI BioLINCC in Earlier and Later Time Periodsa
| Overall | Earlier Era CHD Casesb | No CHDb | Overall | Later Era CHD Casesb | No CHDb | |
|---|---|---|---|---|---|---|
| N | 14009c | 1428 | 12581 | 14009c | 1317 | 12692 |
| Age | 60.4 (8.2) | 64.4 (8.4) | 60.0 (8.1) | 60.6 (8.1) | 65.0 (7.4) | 60.1 (8.1) |
| Sex (female) | 56.0 | 42.2 | 57.6 | 56.0 | 45.6 | 57.1 |
| Black/AA | 15.4 | 15.9 | 15.3 | 15.4 | 14.7 | 15.5 |
| SBP (mmHg) | 127 (20) | 137(21) | 126 (20) | 125 (19) | 134 (21) | 125 (19) |
| SBP ≥140 mmHg | 24.1 | 41.7 | 22.1 | 21.0d | 35.9 | 19.5 |
| On BP treatment | 27.2 | 42.6 | 25.4 | 31.6d | 47.3 | 30.0 |
| Diabetese | 10.4 | 22.4 | 9.0 | 11.0 | 18.5 | 10.2 |
| Smokerf | 21.8 | 25.4 | 21.4 | 14.3d | 18.8 | 13.8 |
| HDL-C (mg/dL) | 53 (17) | 49 (15) | 54 (17) | 52 (16) | 49 (15) | 52 (16) |
| HDL-C <50 mg/dL | 47.0 | 58.4 | 45.7 | 51.0d | 59.1 | 50.2 |
| Total-C (mg/dL) | 217 (40) | 220 (42) | 217 (40) | 200 (36) | 206 (39) | 200 (36) |
| Total-C ≥200 mg/dL | 65.4 | 68.3 | 65.1 | 48.9d | 55.7 | 48.2 |
| Total:HDL-C ratio | 4.4 (1.5) | 4.8 (1.5) | 4.4 (1.5) | 4.2 (1.3) | 4.5 (1.4) | 4.2 (1.3) |
| Total:HDL-C ratio ≥4.0 | 55.8 | 68.2 | 54.3 | 51.4d | 61.7 | 50.3 |
| On LL treatment | 2.9 | 3.4 | 2.8 | 11.3d | 13.7 | 11.1 |
Abbreviations: AA, African American; BioLINCC, Biologic Specimen and Data Repository Information Coordinating Center; CHD, coronary heart disease; HDL-C, high-density lipoprotein cholesterol; NHLBI, National Heart, Lung, and Blood Institute; on BP treatment, on blood pressure medication(s); on LL treatment, on lipid-lowering medication(s); SBP, systolic blood pressure; total-C, total cholesterol; total:HDL-C ratio, total-to-high-density lipoprotein cholesterol ratio
Mean and standard deviation for continuous variables, % for categorical variables; NHLBI BioLINCC cohorts contributing data include:
Framingham Heart Study Original Cohort (FHS Original, examinations in 1983–1985 and 1997–1999): n=522 earlier, 48 later
Framingham Heart Study Offspring Cohort (FHS Offspring, examinations in 1983–1987 and 1998–2001): n=1935 earlier, 1808 later
Atherosclerosis Risk in Communities (ARIC, examinations in 1987–1989 and 1996–1998): n=8145 earlier, 6696 later
Cardiovascular Health Study (CHS, examinations in 1989–1990 and 1997–1998): n=3407 earlier, 1901 later
Multi-Ethnic Study of Atherosclerosis (MESA, examination in 2000–2002): n=3556 later
All adults free of cardiovascular disease at baseline, these are characteristics of adults who do and do not develop CHD in follow-up.
4833 individuals in the earlier and 6080 in the later era were excluded due to no matches
Comparison of prevalence in the overall group in the earlier and later eras, *p<0.001, otherwise p>0.05
Diabetes defined as fasting glucose at or above 126 mg/dL (random glucose above 200 mg/dL in FHS Original Cohort) or on diabetes treatment.
Smoker defined as current or within the past year.
Results
The Table shows characteristics of 14,009 pairs of participants in two cohorts. In the later period, the proportions of smoking, high SBP, and dyslipidemia were lower, while diabetes, SBP, and lipid-lowering treatment were higher. The incidence of new-onset CHD declined from 1.18 (95% CI 1.12–1.25; 1,428 events) to 0.98 (95% CI 0.93–1.04; 1,317 events) per 100 person-years (p<0.001).
For the outcome of CHD, the HRs of smoking, SBP, and total:HDL-C were not significantly different between eras (Figure), but diabetes HRs were lower in the later era (2.01, 95% CI 1.76–2.28 vs. 1.49, 95% CI 1.29–1.71; p=0.002). Numerical decreases in the PAFs of CHD due to smoking, systolic hypertension (SBP ≥140mmHg), and dyslipidemia (total:HDL-C ≥4.0) over time were not statistically significant (Figure); however, the PAF of diabetes declined significantly from 9.8% (95% CI 7.7–11.9) to 5.4% (95% CI 3.3–7.6, difference 4.4%, 95% CI 1.4–7.4; p=0.004).
Figure. PAF of CHD.
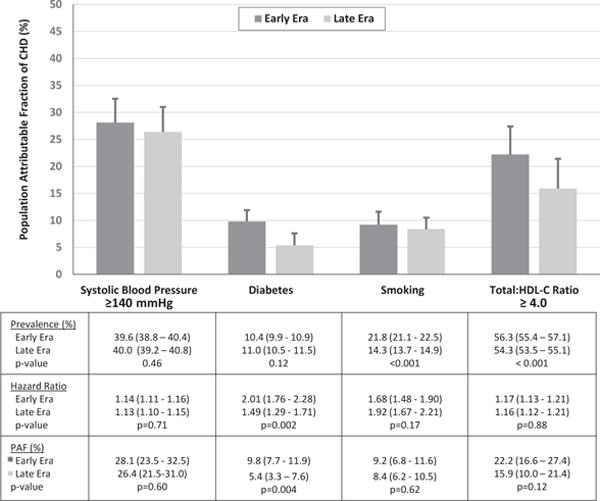
Displayed is the PAF of CHD for treatment-adjusted SBP ≥140, diabetes, smoking, and treatment-adjusted total:HDL-C ≥4.0 in the early and later eras.
Abbreviations: CHD, coronary heart disease; PAF, population attributable fraction; SBP, systolic blood pressure; total:HDL-C, total-to-high-density lipoprotein cholesterol ratio
Discussion
Examination of adults from five large observational cohort studies led to several findings. First, the incidence of CHD declined almost 20% over time. Second, while the prevalence of diabetes increased, the fraction of CHD attributable to diabetes decreased over time, due to attenuation of the association between diabetes and CHD; this may have resulted from changing definitions and awareness of diabetes, improvements in diabetes treatment and control, and/or better primary prevention. Third, there was no evidence that the strength of the association between smoking, SBP, or dyslipidemia and CHD changed between time periods, nor was there evidence that the proportion of CHD due to these factors changed; this underscores the importance of continued prevention efforts targeting these risk factors. Study limitations include the unknown effect of increasing treatment rates on follow-up, the variability of population-attributable fractions with classification thresholds, and one of the cohorts only contributing to the later period.
Acknowledgments
The authors would like to thank Tony Schibler, MPA and Brian Tinga, MSAE for their data programming assistance, and Erin Hanley, MS for her editorial assistance with this manuscript (all from the Duke Clinical Research Institute).
The authors also recognize the intellectual contributions of Irfan Khan, PhD of Sanofi and Joseph Elassal, MD of Regeneron in data interpretation and study design.
The above individuals did not receive compensation beyond their regular salary provided by their employers.
Sources of Funding
This study was supported by Regeneron and Sanofi Pharmaceuticals. The funder had no role in the design and conduct of the study; collection, management, analysis, and interpretation of the data; preparation, review, or approval of the manuscript; and decision to submit the manuscript for publication beyond the contributions of its employees as outlined in the Acknowledgments and in the description of Dr. Sanchez’s role.
Footnotes
Disclaimer: Dr Peterson, an associate editor for JAMA, was not involved in the editorial review of or the decision to publish this article.
Author Contributions
All authors have been involved in the study design, analysis, and manuscript revision. All authors read and approved the final manuscript. Dr. Pencina is the guarantor who accepts full responsibility for the work and the conduct of the study and controlled the decision to publish.
AM Navar: Dr. Navar contributed to the conception and design of the study, the data analysis, the data interpretation, the manuscript drafting, and the critical revision of the manuscript.
ED Peterson: Dr. Peterson contributed to the conception and design of the study, the data interpretation, and the critical revision of the manuscript.
D Wojdyla: Dr. Wojdyla contributed to the conception and design of the study, the data interpretation, and the critical revision of the manuscript.
R Sanchez: Dr. Sanchez contributed to the conception and design of the study, the data interpretation, and the critical revision of the manuscript.
A Sniderman: Dr. Sniderman contributed to the conception and design of the study, the data interpretation, and the critical revision of the manuscript.
RB D’Agostino: Dr. D’Agostino contributed to the conception and design of the study, the data interpretation, and the critical revision of the manuscript.
MJ Pencina: Dr. Pencina contributed to the conception and design of the study, the data analysis, the data interpretation, the manuscript drafting, and the critical revision of the manuscript.
Mr. Wojdyla had full access to all of the data in the study and takes responsibility for the integrity of the data and the accuracy of the data analysis.
Conflict of Interest Disclosures
All authors will complete the ICMJE uniform disclosure form at www.icmje.org/coi_disclosure.pdf.
AM Navar: Dr. Navar reports research funding from Sanofi and Regeneron and consulting from Sanofi.
ED Peterson: Dr. Peterson grant support from American College of Cardiology, American Heart Association, Janssen; and consulting from Bayer, Boehringer Ingelheim, Merck, Valeant, Sanofi, Astra Zeneca, Janssen, Regeneron, Genentech.
D Wojdyla: Dr. Wojdyla has no relevant disclosures to report.
R Sanchez: Dr. Sanchez reports stockholding with Regeneron.
A Sniderman: Dr. Sniderman reports no relevant disclosures.
RB D’Agostino: Dr. D’Agostino reports no relevant disclosures.
MJ Pencina: Dr. Pencina reports funding from Regeneron and Sanofi to DCRI.
References
- 1.Moser M. From JNC 1 to JNC 7—what have we learned? Prog Cardiovasc Dis. 2006;48(5):303–315. doi: 10.1016/j.pcad.2006.02.003. [DOI] [PubMed] [Google Scholar]
- 2.Talwalkar PG, Sreenivas CG, Gulati A, Baxi H. Journey in guidelines for lipid management: from adult treatment panel (ATP)-I to ATP-III and what to expect in ATP-IV. Indian J Endocrinol Metab. 2013;17(4):628–635. doi: 10.4103/2230-8210.113753. [DOI] [PMC free article] [PubMed] [Google Scholar]
- 3.Giffen CA, Carroll LE, Adams JT, Brennan SP, Coady SA, Wagner EL. Providing contemporary access to the historical biospecimen collections: development of the NHLBI Biologic Specimen and Data Repository Information Coordinating Center (BioLINCC) Biopreserv Biobank. 2015;13(4):271–279. doi: 10.1089/bio.2014.0050. [DOI] [PMC free article] [PubMed] [Google Scholar]
- 4.Laaksonen MA, Knekt P, Härkänen T, Virtala E, Oja H. Estimation of the population attributable fraction for mortality in a cohort study using a piecewise constant hazards model. Am J Epidemiol. 2010;171(7):837–847. doi: 10.1093/aje/kwp457. [DOI] [PubMed] [Google Scholar]
- 5.Levy D, DeStefano AL, Larson MG, et al. Evidence for a gene influencing blood pressure on chromosome 17. Genome scan linkage results for longitudinal blood pressure phenotypes in subjects from the Framingham Heart Study. Hypertension. 2000;36(4):477–483. doi: 10.1161/01.hyp.36.4.477. [DOI] [PubMed] [Google Scholar]
- 6.Tobin MD, Sheehan NA, Scurrah KJ, Burton PR. Adjusting for treatment effects in studies of quantitative traits: antihypertensive therapy and systolic blood pressure. Stat Med. 2005;24(19):2911–2935. doi: 10.1002/sim.2165. [DOI] [PubMed] [Google Scholar]
- 7.Laaksonen MA, Virtala E, Knekt P, Oja H, Härkänen T. SAS Macros for Calculation of Population Attributable Fraction in a Cohort Study Design. J Stat Software. 2011;43(7):1–25. [Google Scholar]