

Summary
Neural circuits must transform new inputs into outputs without prematurely affecting downstream circuits, while still maintaining other ongoing communication with these targets. We investigated how this isolation is achieved in motor cortex when macaques received visual feedback signaling a movement perturbation. To overcome limitations in estimating the mapping from cortex to arm movements, we also conducted brain-machine interface (BMI) experiments where we could definitively identify neural firing patterns as output-null or output-potent. This revealed that perturbation-evoked responses were initially restricted to output-null patterns that cancelled out at the neural population code readout, and only later entered output-potent neural dimensions. This mechanism was facilitated by the circuit's large null space and its ability to strongly modulate output-potent dimensions when generating corrective movements. These results show that the nervous system can temporarily isolate portions of a circuit's activity from its downstream targets by restricting this activity to the circuit's output-null neural dimensions.
Introduction
It is easy to take for granted that if someone bumps your arm as you are trying to hand them a cup of coffee, your initial response is not undirected arm flailing. Instead, your nervous system processes sensory feedback related to the perturbation in order to generate corrective movements that still deliver the cup without spilling the coffee. But this seeming simplicity belies sophisticated computations. Sensory afferents cause widespread neural activity changes throughout your sensorimotor system, including in areas such as motor cortex that can generate muscle contractions (Archambault et al., 2011; Dum and Strick, 2002; Georgopoulos et al., 1983; Pruszynski et al., 2014). Eventually this evoked response is transformed into a corrective action (i.e., sensorimotor feedback), but there is a period of time when it is not yet suitable for output to the muscles. This leads to the central question: what keeps the initial response from “leaking out” and prematurely moving the arm before the appropriate commands to downstream motor system targets are ready? This question is germane at multiple levels of the motor system and its interaction with multiple sensory modalities, as well as the broader question of how neural circuits flexibly isolate their activity from downstream targets. Here we investigated how the early phase of a visually signaled perturbation's motor cortical response avoids affecting ongoing voluntary movement.
Feedback-related neural activity needs to be decoupled from directly causing behavioral output because cortex is not just a one-to-one relay between sensory afferents and motor efferents. Movement corrections depend not only on the specifics of the perturbation, but also on the movement goal and state of the musculoskeletal system (Cluff et al., 2014; Scott, 2012). This presents three possibilities for motor cortex's role in this input-output isolation. The first is that the transformation is finished upstream, such that inputs to motor cortex immediately cause the right movement-generating activity. This, however, just pushes the question of how computation is isolated from output upstream: how do areas projecting to motor cortex transform their inputs without prematurely affecting motor cortex? A variant of this it-is-solved-upstream possibility is that the necessary computations happen via dendritic processing at the motor cortical inputs (Mel, 1994). Arguing against this are studies showing that initial motor cortical spiking responses to mechanical arm perturbations are non-specific to the perturbation and behavioral context, and differ from subsequent correction-specific responses (Herter et al., 2008; Omrani et al., 2014, 2016, Pruszynski et al., 2011, 2014). Furthermore, the motor cortical data we will present show that initial responses to visual perturbations are inappropriate for generating corrections. These results are inconsistent with sensorimotor transformations being fully completed prior to (or in the synapses arriving at) motor cortex. They instead suggest that at least some portion of the process, and its isolation from downstream targets, can be investigated in motor cortex.
A second possibility is that the initial motor cortical response fails to cause movement due to temporary inhibitory “gating” of its downstream targets. This mechanism was proposed to explain how movement preparation avoids prematurely contracting muscles (Benjamin et al., 2010; Bullock and Grossberg, 1988; Duque and Ivry, 2009; Todorov, 2000). However, previous studies have argued against inhibitory gating being generated by motor cortex (Kaufman et al., 2010, 2013) and suggested that such gating is unnecessary (Kaufman et al., 2014). Furthermore, gating feedback-related activity would be particularly difficult because, unlike when withholding all movements, the mechanism would have to selectively pass through ongoing movement commands but block premature corrective commands.
We will present evidence consistent with a third possibility: perturbation-evoked motor cortical activity changes, putatively reflecting the area's role in sensorimotor transformations, have population-level structure such that this activity does not cause premature movement-generating output. Under the ‘output-null’ hypothesis, the nervous system takes advantage of there being a redundant many-to-few mapping between a neural circuit and its downstream targets. This redundancy means that there are a variety of different ‘output-null’ firing rate patterns that will nonetheless be read out identically downstream. Neuroscientists have long recognized that this property of null spaces could allow a circuit's read-out to be invariant to certain types of changes, such as in perceptual color constancy (Maloney and Wandell, 1986), time-invariant working memory of a sensory stimulus (Druckmann and Chklovskii, 2012), or the output from cortex to muscles (Todorov, 2000). More recent studies have suggested that reliable motor planning (Li et al., 2016) and motor control (Flint et al., 2016) is achieved by motor cortical circuits tolerating output-null firing rate changes while selectively maintaining the stability of different, ‘output-potent’ patterns that do affect movements.
It was recently proposed that neural circuits could not only “ignore” irrelevant output-null activity changes, but also exploit this phenomenon to isolate their computations from downstream targets (Kaufman et al., 2014). Kaufman and colleagues presented evidence that this allows “preparatory” activity in primary motor cortex (M1) to vary without causing movement, and dorsal premotor cortex (PMd) activity to vary without affecting M1, during the instructed delay period of a reaching task. The present report extends this hypothesis to the case where feedback-related activity needs to be prevented from prematurely affecting ongoing movement. Figure 1 depicts a simple two-neuron example to illustrate this hypothesis. This mechanism does not require a separate gating command from motor cortex or other sensorimotor loop nodes, and allows interactions between motor cortex's state and new perturbation-related inputs (e.g., error-correcting computations) to initially occur without changing downstream activity. Motor corrections could subsequently be generated by projecting the appropriate activity patterns into the ‘output-potent’ neural dimensions. We present key new evidence consistent with the prediction that cortical activity is isolated from downstream targets using an output-null mechanism. In particular, we exploit certain advantages of BMI experiments, discussed below, to definitively show for the first time that this mechanism is sufficient to isolate motor cortical activity from its effector.
Figure 1. How motor cortex could avoid premature output of feedback-related activity.
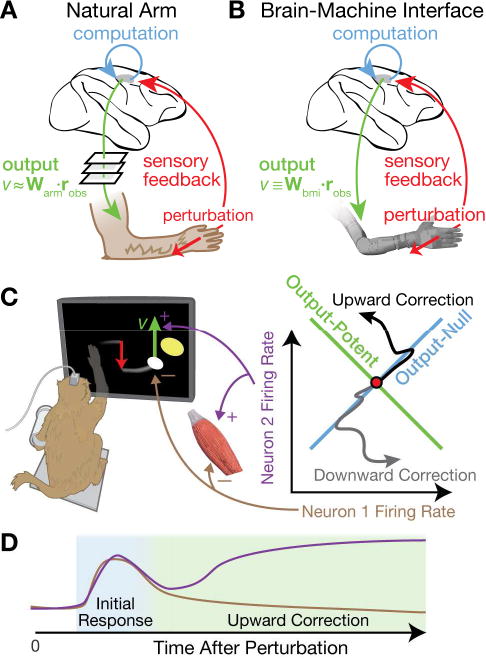
(A) Conceptual schematic of this study's central question and approach. Motor cortical areas (shaded) causally generate movements and receive relevant sensory feedback. The sensorimotor system corrects perturbations by transforming sensory input into an appropriate motor output. We asked how perturbation-evoked motor cortical changes avoid affecting downstream targets until the correct output activity is “ready”. The answer hinges on how motor cortical activity causes movement, but identifying this exactly is intractable because it is an unknown transfer function between all efferent neurons and all muscles. We instead approximated a linear mapping, Warm, between the firing rates of the observed neural ensemble, robs, and measured hand velocity v.
(B) We bolstered the arm-controlled experiments with BMI experiments in which the motor output depends solely and completely on robs according to a known linear mapping, Wbmi.
(C) (Left) We used a Cursor Jump Task to study neural dynamics following a visually-signaled movement perturbation. An arm- or BMI-controlled cursor (white) was suddenly “jumped” to a new position while the monkey tried to move it to the yellow target. The monkey could not see his hand. In this example, a downward perturbation necessitates an upward correction. (Right) We propose that a neural population-level mechanism prevents early activity changes from prematurely affecting output. Here this ‘output-nullhypothesis’ is illustrated for a simple two-neuron system (adapted from Kaufman et al., 2014). Assume each neuron has an opposite effect on vertical cursor velocity, either through a muscle raising the arm, or directly via the BMI. Both neurons' simultaneous activity is plotted in a 2D state space. If both increase or decrease their activity, the net effect on the cursor cancels out; this defines an ‘output-null’ neural dimension. But if one neuron increases its rate while the other decreases, there will be a net change in movement output; this defines an ‘output-potent’ dimension. We've drawn two neural state trajectories corresponding to upward or downward corrections. In both, the initial activity is confined to the output-null dimension, but subsequent activity traverses output-potent dimensions.
(D) Cartoon of output-null to output-potent dynamics in neuron 1 and 2's firing rates following a downward perturbation. Early responses cancel out (blue shaded epoch), but later the responses cause a corrective upward cursor movement (green shaded epoch).
In principle, the output-null hypothesis is straightforward to test: here it reduces to testing whether the initial perturbation-evoked motor cortical response cancels out when read out by the motor effector. The analytical and experimental difficulty lies in determining what firing rate patterns are output-null versus output-potent. Relating motor cortex activity to arm movements is complicated by the fact that corticospinal commands are modulated by other cortical, subcortical, cerebellar, and spinal circuits, many of which also affect movements themselves (Cisek and Kalaska, 2010; Ramnani, 2006; Scott, 2004). Furthermore, current techniques are limited to recording but a small fraction of both the motor cortical population (e.g., hundreds of electrodes) and neuromuscular activity (e.g., EMG from a few muscles). Nonetheless, it is possible to approximate this relationship as a linear mapping described by a matrix multiplication; this allows output-potent and output-null neural dimensions to be identified from the row and null spaces of this matrix, respectively (Kaufman et al., 2014).
In this study, we used a two-pronged strategy for determining output-potent and output-null firing rate patterns. We first estimated a linear mapping Warm between motor cortical activity and hand endpoint velocity (Figure 1A). This allowed us to examine whether the initial neural response to step perturbations of the position of a visual cursor that otherwise tracked the hand was (putatively) output-null. However, this approach is limited by the aforementioned inexactness of Warm: it is a linear approximation of a mapping from an incomplete view of the brain acting upon an incomplete view of the body. To overcome this limitation – at the cost of using a simplified experimental preparation – we took advantage of the ability to completely define the mapping Wbmi between recorded motor cortical activity and cursor movement (Figure 1B). During BMI use, cortical activity directly and fully determines the behavior of the effector, making this a powerful experimental paradigm for studying cortical control of movement (Athalye et al., 2017; Flint et al., 2016; Golub et al., 2016). Examining perturbation-evoked neural activity during both arm-controlled and BMI-controlled movements allowed us to bolster the understanding arising from studying natural reaching with complementary understanding of BMI behavior, where more comprehensive measurements are possible. These BMI experiments also allowed us to test a secondary question of practical relevance to motor neural prosthesis development: should we be concerned that directly linking cortex to an effector will result in sensory feedback causing deleterious decoder output? A preliminary report on this aspect of the study appeared in a conference proceeding (Stavisky et al., 2015a).
Results
Cursor jumps during arm movement evoke visuomotor feedback
In this first section, we describe experiments probing motor cortical population dynamics following perturbations during arm movements. Our goal, subject to the aforementioned caveats, was to test whether the output-null hypothesis explains why early visual feedback-related responses do not cause movement. We recorded a combination of single- and multi-unit spikes from multielectrode arrays implanted in M1 and caudal PMd of macaques performing arm-controlled Radial 8 Target and Cursor Jump Tasks. Data were collected from monkeys J and L specifically for this study. When we found that partitioning monkey L's neural data during arm reaching into putatively output-null and output-potent components (described below) yielded results that were less clear than monkey J's, we also analyzed data from a third monkey, R, who had performed variants of these arm-controlled tasks as part of a different study. The tasks required making arm reaches in a vertical plane in order to move a cursor from the workspace center to a radial target and hold it there for half a second. The key ‘cursor jump’ manipulation was that on a random 20-30% of trials, the cursor's position was suddenly offset perpendicular to the ‘Task Axis’ connecting the workspace center to the radial target. This large perturbation was randomly chosen be in one of two directions and occurred after a specific ‘jump event type’ condition was met; Figure 2A shows representative arm-controlled cursor trajectories for each jump event type. Jumps occurred either mid-movement (near the time of peak reach speed) or while the monkey tried to hold his hand still during the target hold period (Figure 2B). Monkeys responded to perturbations mid-movement by curving the cursor's trajectory towards the target and to jumps during hold by returning the cursor to the target. They did not require additional training to perform this task and showed little to no improvement over the course of these experiments (Figure S1A). Figure 2C insets show that across jump event types and monkeys, mean times to target for jump trials increased from 49% to 111% compared to unperturbed trials. Jumps during hold took longer to correct than jumps at 6 cm (J and L), and larger displacement jumps at 4 cm took longer to correct than smaller displacement jumps at 3 cm (R); both of these effects were expected given the task and jump geometries.
Figure 2. Initial neural responses to arm-controlled cursor jumps are putatively output-null.
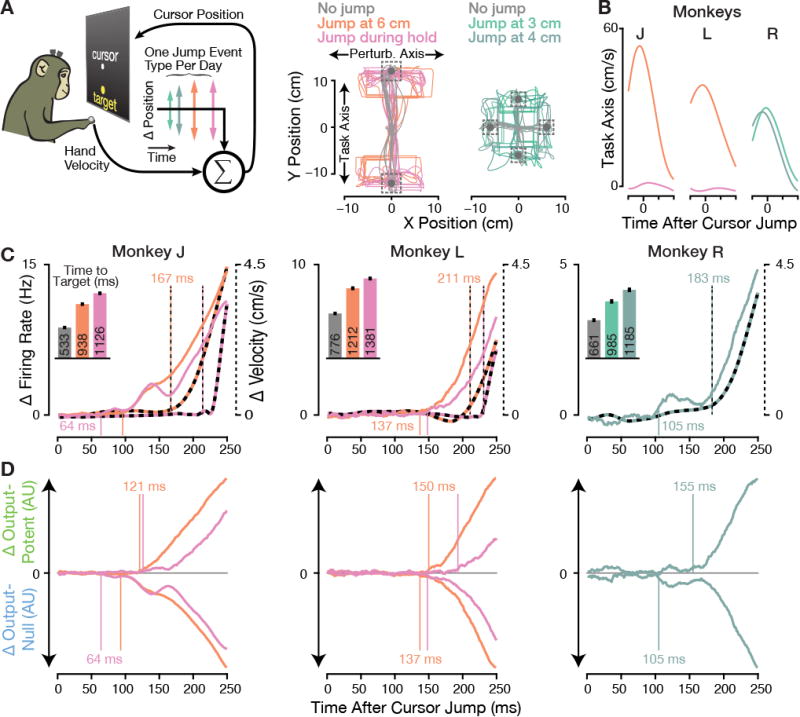
(A) In the arm-controlled Cursor Jump Task, monkeys controlled a cursor's velocity by moving their hand. Random trials were perturbed with an instantaneous step in the hand-to-cursor mapping, causing a ‘cursor jump’ orthogonal to the target direction. Monkeys experienced one jump event type per experiment day. Example cursor trajectories (starting from the workspace center) are shown for twenty trials of each event type (colored traces) and unperturbed trials (gray). The visual targets and their acquisition areas are shown with gray disks and dashed boxes, respectively. (Center) Monkeys J and L performed a two-target task with 6 cm cursor jumps occurring after the cursor traveled either 6 cm along the Task Axis (orange trajectories from dataset J.2015.06.19) or during the target hold period (pink, J.2015.06.16). (Right) Monkey R performed a four-target task variant with either 4 cm jumps occurring after the cursor traveled 3 cm along the Task Axis (light teal, R.2015.04.03), or 5 cm jumps after the cursor traveled 4 cm along the Task Axis (dark teal, R.2015.03.27).
(B) Unperturbed trials' hand velocities from 100 ms before to 200 ms after each jump event type's‘fauxjump’ time, i.e., when the jump would have occurred if these had been jump trials. Traces show the mean Task Axis velocity component averaged over all datasets' analyzed no jump trials.
(C) Multiunit firing rates changed well before the earliest perturbation-evoked behavioral response. Solid traces show population firing rate changes for each jump event type, i.e., the vector norm across all electrodes' difference between jump and faux-jump aligned PSTHs. Monkey R's jump at 3 cm and 4 cm trials were analyzed together. Dashed traces show the same analysis applied to the difference in 2D hand velocity. Vertical lines in this and all subsequent figures mark the earliest detectable change in each series (p < 0.01 for three consecutive bins, shuffle test). (Insets) Mean ± SEM time to target for unperturbed trials (gray) and each jump event type's trials. See Figure S1A for day-by-day performance metrics.
(D) The same perturbation-evoked neural responses were decomposed into putatively output-potent and output-null components by projecting the firing rate change into the row and null spaces of Warm, respectively. Output-potent change magnitude is plotted upwards, while output-null change magnitude is plotted downwards. Output-null changes consistently preceded output-potent responses.
Firing rates and hand velocity exhibited strong changes in response to cursor jumps (Figure 2C). We could detect changes in hand velocity as early as 167 ms (J), 183 ms (R), and 211 ms (L) following the perturbation. Across monkeys and jump event types, the earliest detectable jump-evoked neural responses preceded kinematic changes: firing rate changes led velocity changes by 71 ms (J jump at 6 cm), 150 ms (J jump during hold), 74 ms (L jump at 6 cm), 83 ms (L jump during hold), and 78 ms (R jump at 3-4 cm). The observed differences between the three monkeys' neural response latencies may partially reflect underlying individual monkey differences: the {J earliest, R second, L latest} order is the same as both the ordering of mean times to target and hand velocity change latencies. This could indicate a relationship between motor cortical visual feedback latency and other aspects of sensorimotor system swiftness, but comprehensively testing this would require data from more animals and behaviors. Monkey L's older age (19 years, compared to J's 13 and R's 9), as well as monkey R's different task layout, may also have affected their respective response latencies. However, these differences were likely magnified by monkey J having the highest trial counts and the greatest number of working electrodes; this provided the statistical power to detect very small firing rate changes 64 ms after the cursor jump, rather than the more prominent response ∼35 ms later.
Initial firing rate changes are confined to putatively output-null dimensions
Two features of these cursor jump response data are suggestive of the initial motor cortical responses somehow avoiding affecting arm movements. First, the aforementioned latencies between firing rate and kinematic changes exceed the minimum time it takes for motor cortical stimulation to evoke kinematic changes (less than 50 ms in Graziano, 2005; Graziano et al., 2002). This implies that feedback-related information reached motor cortex fast enough that anatomically it could have – but did not – generate a kinematic output sooner. Second, monkey J and R's (but not L's) firing rate changes showed two distinct phases of increasing divergence from otherwise similar unperturbed trials’ time-varying firing rates. We speculate that these reflect an early transient “burst” of output-null activity, perhaps corresponding to the arrival of perturbation-related sensory information to motor cortex, followed later by a ramping output-potent response corresponding to the corrective movement.
In order to directly examine whether the early perturbation-evoked neural response cancelled out at the downstream readout as predicted by the output-null hypothesis, we need to partition this activity into output-potent and output-null components. Unfortunately, this cannot be done fully and precisely in these arm-controlled experiments, because it would require complete knowledge of the causal relationship between motor cortex and all muscles. Nonetheless, we could estimate which dimensions of our neural data were output-potent and output-null by approximating a linear mapping, Warm, between measured neural population activity and hand kinematics. We are not suggesting that the relationship between motor cortical activity and muscles is purely linear (though it may be close, see Churchland et al., 2012; Rokni and Sompolinsky, 2012). Rather, we are asking whether the output-null mechanism provides a way to sequester computations from the circuit's output even within a simple linear readout model, without resorting to the additional computational opportunities afforded by nonlinearities. We fit Warm using firing rates and hand velocity data collected while the monkey performed an unperturbed Radial 8 Target Task. Across datasets, this linear mapping captured from 56% to 63% of monkey J's, 45% to 52% of L's, and 49% to 55% of R's velocity variance.
Equipped with this linear mapping, we projected the cursor jump-evoked firing rate changes into putatively output-potent dimensions (the row space of Warm) and putatively output-null dimensions (the null space of Warm). Figure 2D shows the neural response dynamics partitioned into these two orthogonal neural subspaces. Output-null responses consistently began before output-potent responses, leading by 28 ms (J jump at 6 cm), 62 ms (J jump during hold), 13 ms (L jump at 6 cm), 45 ms (L jump during hold), and 50 ms (R jump at 3-4 cm). The aforementioned initial response transients were indeed largely confined to output-null dimensions. This also demonstrates that the earliest motor cortical perturbation responses differed from the later responses in an important way: they avoided the putatively output-potent neural dimensions that were highly modulated during the later corrective movements. These results suggest that motor cortical dynamics transition from an initially output-null to a subsequently output-potent response following visual perturbations of natural arm movements. But to more convincingly show that feedback-related dynamics unfold as predicted by the output-null hypothesis, we needed to more accurately identify the output-potent and output-null neural dimensions during a closed-loop motor task. This motivated a second set of BMI experiments, described below, which sacrifice having “natural” reaching behavior in exchange for allowing us to accurately and completely partition neural activity into output-potent and output-null components.
Monkeys rapidly correct cursor jumps during BMI use
Monkeys J and L performed a BMI variant of the Cursor Jump Task in which the cursor was now directly controlled with motor cortical activity using a ‘ReFIT’ velocity Kalman filter, without accompanying arm movement (Figure 3A). Decoders were initially seeded from automated cursor movement observation and then updated from closed-loop BMI data (Gilja et al., 2012). There were two additional jump event types: jump at 3 cm and jump at 10 cm. The four event types were intermixed during each session and probed perturbation responses during a variety of movement phases (Figure 3C). No additional training was needed for these monkeys – who had years of BMI experience – to adjust to the Cursor Jump Task. Figure 3B shows both perturbed and unperturbed cursor trajectories from a representative dataset. We observed similar behavior in the arm-controlled and BMI-controlled tasks, suggesting that the latter is a reasonable and relevant experimental paradigm for dissecting neural dynamics following perturbations during motor control. Much like the kinematic responses following jumps mid-arm reach, BMI-controlled cursor trajectories following jumps at 3 cm and 6 cm initially continued along the Task Axis and then, after a delay, curved towards the target. Shortly after jumps during hold, the BMI cursor headed back towards the target, similar to the trajectories following jumps during arm-controlled target hold. Jump at 10 cm corrections were intermediate between mid-movement and hold period responses.
Figure 3. BMI Cursor Jump Task.
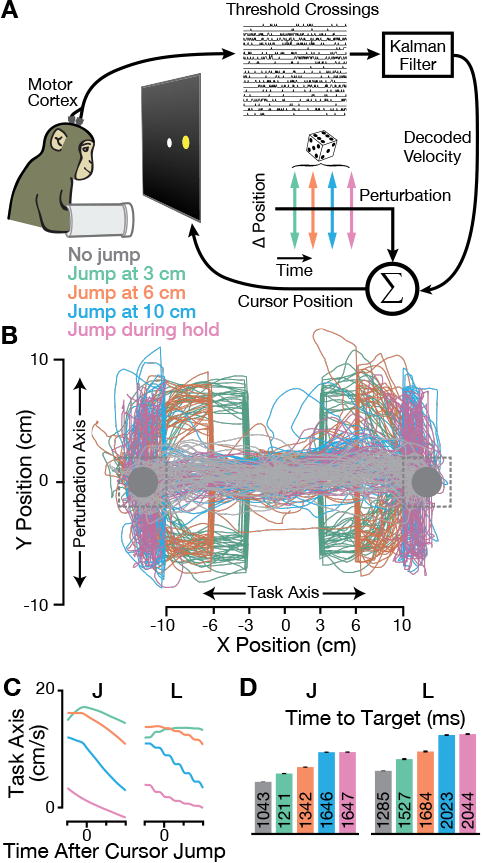
(A) In the BMI Cursor Jump Task, cursor velocity was directly decoded from multiunit spikes (‘thresholdcrossings') using a Kalman filter. After decoder training, monkeys performed the two-target center-out-and-back task with 6 cm cursor jumps on 25% of trials. Perturbations were randomly selected from one of four jump event types interleaved within a given experiment day.
(B) Cursor trajectories from one example dataset (J.2015.01.19) showing all analyzed cursor jump trials. The perturbation was applied once the cursor had traveled 3 cm (teal), 6 cm (orange), or 10 cm (blue) along the Task Axis towards the target, or during the target hold period (pink). 100 example unperturbed trials' trajectories are shown in gray.
(C) Similar to Figure 2B, but now plotting BMI cursor velocity along the Task Axis for monkeys J (left) and L (right). The “wobbliness” of monkey L's cursor velocity is due to his less frequent (20 Hz) decoder updates being noticeable when trial-averaged data are aligned to faux-jumps, which occurred during decoder updates.
(D) Cursor jumps modestly increased the time to target on perturbed trials, with greater increases for later perturbations. Bars show the mean ± SEM of time to target. See Figure S1B for day-by-day performance metrics.
We draw attention to the high quality of BMI control, which enabled quick and direct movements to the targets and suggests that the BMI cursor was a fairly precisely controlled motor effector. BMI Cursor Jump Task success rates on individual datasets ranged from 99.0% to 99.9% in monkey J and 96.0% to 99.2% in monkey L. Cursor jumps substantially increased times to target (Figure 3D). Monkey J's increase, compared to unperturbed trials, ranged from 16% (jump after 3 cm) to 58% (jump during hold). Monkey L's increase ranged from 19% to 59%. Larger increases for later jump events were not surprising because the task geometry allows for a shorter overall trajectory following earlier jumps. As was the case for the arm-controlled task, we observed minimal BMI Cursor Jump Task performance improvement over the course of these experiments (Figure S1B). The experimenters' impression was that the monkeys were similarly unfazed by perturbations during BMI and arm use.
Early perturbation responses do not affect BMI cursor velocity
The neural responses following BMI cursor jumps (Figure 4A) reveal that the key phenomenon we saw during natural arm control – early feedback-related firing rate changes that did not appear to cause motor output – was robustly present during BMI control. We could detect statistically significant firing rate changes (p <0.01, shuffle test) as early as 67 ms after the perturbation in monkey J and 120 ms in monkey L. Both monkeys' neural responses had a more pronounced form of monkey J's “biphasic” arm control response, and involved both firing rate increases and decreases across the ensemble (Figure S2). These firing rate changes' instantaneous effect on BMI cursor velocity is shown in aggregate in Figure 4B and for single example conditions in Figure S3. This ‘neural push’ measurement has two key advantages over the measured hand velocity changes following arm-controlled cursor jumps: it captures the entirety of the brain's effect on the motor plant, and it has no delay relative to firing rate changes. This allows us to conclude that the early perturbation-evoked firing rate changes did not cause BMI output changes. When neural push did start to change after the cursor jump, it was a corrective push opposing the perturbation.
Figure 4. Motor cortex responds rapidly to BMI cursor jumps but velocity output is unchanged.
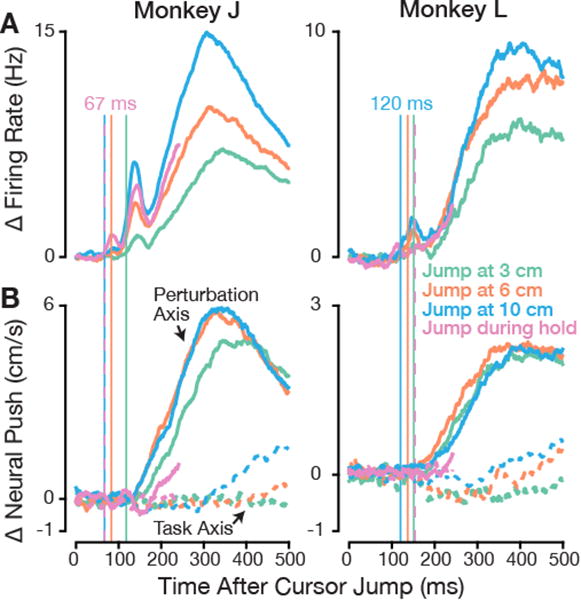
(A) Changes in firing rates attributable to the cursor jump were computed as in Figure 2C. Each trace is the mean response across all dataset-conditions for one jump event type. See Figure S2 for example PSTHs from individual electrodes and additional population-level firing rate change quantifications.
(B) Change in neural push following the perturbation, i.e. how the neural response contributed to change in cursor velocity. Neural push was projected separately onto the Perturbation Axis (solid traces, positive means opposing the perturbation) and Task Axis (dashed traces, positive means in the center-to-target direction). To aid visual comparison, the vertical lines marking initial firing rate change from (A) are extended onto this panel. The large early firing rate changes had minimal effect on BMI velocity output. See also Figure S3 for single dataset-condition examples and Figure S6B, which shows that early neural push was stable over time within and across days.
Early perturbation responses cancel out via the output-null mechanism
In order for motor cortex's initial perturbation-evoked response to not affect cursor velocity, the pattern of firing rates across the ensemble must, by definition, lie in the output-null space of the decoder's mapping from firing rates to velocity, Wbmi. The neural push changes that we observed occurring later must, also by definition, correspond to changing activity in the row space of Wbmi. We can therefore directly visualize the time-courses of these response components by projecting firing rate changes into the null and row spaces of Wbmi (Figure 5A). We observed output-null neural responses as early as 66 ms after the jump in monkey J (121 ms in monkey L). Output-potent activity changes were first detectable later: 103 ms post-jump in monkey J (177 ms in monkey L). The more substantial output-potent response started ∼170 ms post-jump, which was ∼25 ms after the peak of the early output-null transient.
Figure 5. Initial responses are restricted to BMI output-null dimensions and are perturbation-specific.
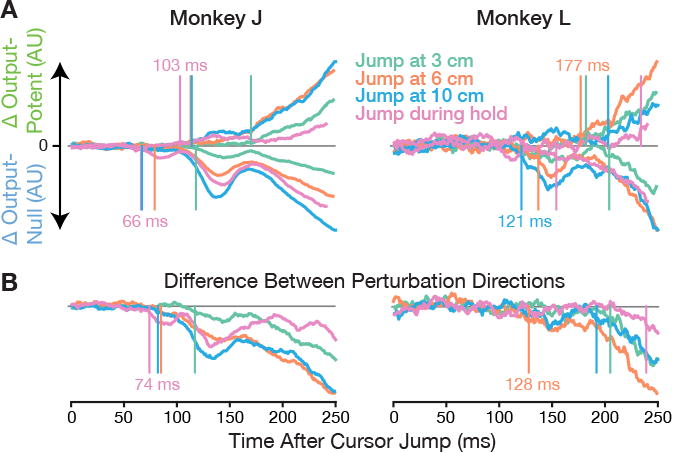
(A) Neural responses to cursor jumps during BMI control were projected into output-potent and output-null dimensions, similarly to the analysis of jump-evoked responses during arm control in Figure 2D. Here the projections are defined with respect to Wbmi and therefore are definitively output-potent or output-null. The earliest activity changes were confined to the output-null subspace, and only later entered output-potent dimensions. See Figure S4 for control analyses showing that this effect was not due to separate early responding and output-potent neural subpopulations, nor due to decoders being trained to ignore possibly perturbation-like signals in the training data.
(B) The early output-null response contains perturbation direction-specific information. Instead of plotting the difference between perturbed and unperturbed trials as in the previous panel, here we show the output-null population response differences between cursor jumps in opposite directions. See Figure S5 for an analysis showing that the direction-selectivity of these early neural responses (e.g. after upward jumps vs. downward jumps) differed from the direction-selectivity when initiating unperturbed movements in the corresponding (opposite) directions (e.g., starting movements towards down vs. up targets).
One interpretation of these results is the mechanism we've illustrated in Figure 1C,D: early firing rate changes on different electrodes caused neural push in opposing directions, resulting in no net cursor velocity change. This is consistent with the individual electrode PSTHs in Figure S2A, which show a transient initial firing rate increase across many electrodes. Afterwards, firing decreases on electrodes that direct the cursor in the perturbation direction and increases on those that oppose the perturbation. Nonetheless, we still had to verify that initial motor cortical responses “cancel out” at the whole-population level. Specifically, we had to rule out a more trivial mechanism: what if the neural subpopulation sending outputs to downstream targets was largely distinct from the subpopulation that responds to the initial feedback-related inputs? For natural movements, these subpopulations could separate based on whether they project to the spinal cord. During BMI use, the early response could be restricted to electrodes that minimally affect decoded velocity. Kaufman and colleagues previously presented evidence that during instructed delay arm reaches, the estimated output-null and output-potent neural dimensions were not composed of segregated groups of neurons (Kaufman et al., 2014). Here, we could directly and comprehensively test for this in the BMI data by repeating the output-potent/output-null projection analysis for a subset of the electrodes that contributed substantially to the decoded velocity. Figure S4A,B shows that the initial perturbation-evoked transient was still present in these high-weight electrodes' output-null dimensions. This confirms that early feedback-related activity in motor cortex avoids causing BMI output by cancelling out at the population level, rather than by being isolated in a non-output subpopulation. The key result that early feedback-related changes in firing rates had minimal effect on decoder output also cannot be explained by the decoder training procedures optimizing the decoder to ignore jump responses due to their similarity to training data decoding errors or target onset activity (Figure S4C,D).
Perturbation-specific information in the early output-null response
Although the question of why the initial perturbation-evoked motor cortical response does not cause movement can be agnostic to this activity's specific function, our data allowed us to make several additional characterizations of this activity. We took advantage of having presented the monkeys with cursor jumps in two different directions for any given jump event type. If the early response was invariant to the perturbation's details – for instance, if it signals a nonspecific visual change, surprise, or “something went wrong” – we would not expect to see early differences between opposite jump directions. If, however, this response encoded specific aspects of the perturbation – for instance, relating to the new difference between cursor and target positions – then we would expect to see neural responses diverge after different jump directions. Figure 5B shows the magnitude of this jump-direction difference in the BMI data. Monkey J's data show perturbation-specific responses as early as 74 ms after the perturbation. For all jump event types, these jump direction-related differences emerged in the output-null dimensions before the earliest significant output-potent jump-evoked response. In monkey L's noisier data, this effect was only significant for the jump at 6 cm condition. Our data also allowed us to examine to what extent the early motor cortical response preceding a corrective movement resembled activity when initiating unperturbed reaches in a similar direction. Figure S5 compares PSTHs after cursor jumps to those during the beginning of unperturbed Radial 8 Target Task movements. This reveals that while jump-evoked neural responses do not appear to explore additional neural dimensions not otherwise traversed during unperturbed movements, there are substantial differences between early perturbation responses and movement initiation at the single electrode level.
To summarize, while our experiments do not reveal the purpose of the early feedback-related response, we were able to make several observations about this signal: 1) it reaches motor cortex rapidly; 2) it is confined to the circuit's output-null dimensions; 3) it varies depending on the direction of the cursor jump; 4) it differs from the later activity that generates corrective movements; and 5) it differs from the activity observed when initiating movements. These observations are consistent with this response reflecting motor cortex's involvement in transforming perturbation-related sensory feedback into output-potent corrective output. An important open question where these input signals fall in the visuomotor transformation process: for example, should they be thought of as movement error signals (more sensory), or as inchoate corrective movement commands (more motor)?
A large null space and targeted corrective output are key ingredients
Returning to the main story, we wanted to identify the key factors that facilitated the early feedback-related response not prematurely causing movement. In particular, did this result depend on a precise relationship between motor cortical activity and the circuit's output-potent dimensions? This could take on two forms: early activity specifically avoiding output-potent dimensions, and/or late correction-generating activity specifically targeting output-potent dimensions. We are in effect framing a goal of feedback-related processing as trying to minimize the ‘noise’ of premature output-potent leakage prior to generating an appropriate and large corrective output ‘signal’. A high signal-to-noise ratio (SNR) achieves this goal because the relatively small noise (output-potent leakage) would minimally affect movements in comparison to intentional output. Importantly, the circuit's SNR could be increased by amplifying the signal or by reducing the noise.
We looked for evidence of these two possible mechanisms by comparing how strongly the early and late perturbation-evoked responses projected onto the output-potent dimensions of the true BMI decoders in used in the experiments, versus onto shuffled decoders (Figure 6). The ratio of Late: Early output-potent activity (SNR) was much higher for true decoders (Figure 6B), but the Early null: potent ratio (noise-1) was similar between true and shuffled decoders (Figure 6C). This reveals that the early perturbation-evoked activity did not selectively avoid motor cortical output-potent dimensions, but the later response was particularly well targeted to movement-causing dimensions. In the SNR framing, the circuit appears to amplify its signal rather than specifically reduce its noise. We also found no evidence of learning-related changes in the early output-potent response (Figure S6), which is consistent with the circuit not being specifically structured to steer this activity away from output-potent dimensions.
Figure 6. Responses selectively target output dimensions during corrections rather than avoiding them initially.
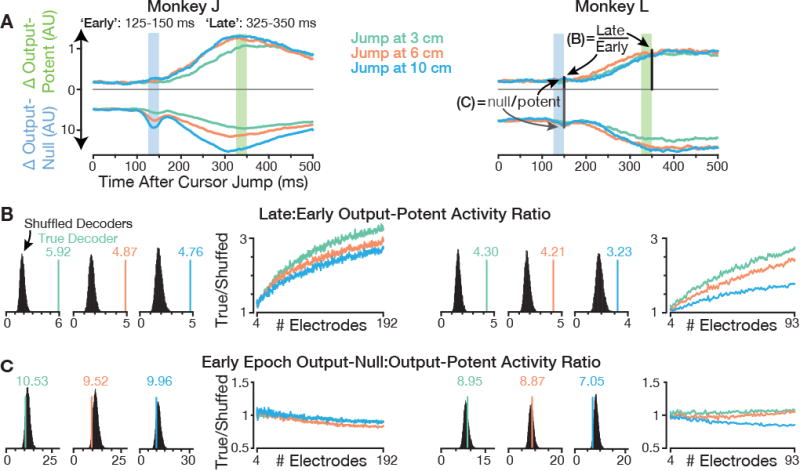
(A) Overview of analyses showing that strong late corrective output and minimal early output-potent leakage depends only on a specific alignment between the neural population's corrective response and the decoder. ‘Early’ and ‘Late’ epochs are shaded atop traces showing output-null and output-potent activity changes. Panel B shows that the ratio of Late to Early output-potent activity is much higher for true decoders than for shuffled decoders. Panel C shows that the Early response did not avoid output-potent dimensions more for true decoders than shuffled decoders. Together, these results show that the Late response is specifically aligned with true decoders’ output-potent dimensions, whereas Early activity does not selectively avoid these dimensions. Unlike in Figure 5, neural responses were calculated without subtracting a baseline difference norm estimate. To show the much larger magnitude of output-null firing rate changes, a fixed 10× scale is used between the potent and null vertical axes.
(B) Early and Late epoch responses were projected into the output-potent dimensions of either the true decoder (similar to Figure 5A), or decoders constructed by shuffling electrodes' neural push directions (Wbmi columns). Each monkey's left plots show the ratios between Late and Early output-potent magnitudes. The vertical line shows the true decoder's ratio; its color denotes the plot's jump event type. Black histograms show shuffled decoders' ratios. True decoders' ratios exceeded all shuffled decoders' ratios. The right plot compares the average true decoder's Late:Early output-potent ratio to that of a shuffled decoder when subsampling electrodes. This true/shuffled quotient decreases as the sampled neural population becomes smaller, indicating that decoders fit to read out velocity from smaller ensembles have more early perturbation-evoked output leakage.
(C) Ratios of Early output-null to output-potent response magnitudes are shown in the same format as in panel B. True decoder ratios were within the shuffled decoder distributions, and the true/shuffled quotient remained close to one across the number of subsampled electrodes. This reveals that Early jump-evoked responses were not “remarkable” in terms of avoiding output-potent dimensions. Figure S6 shows that over the course of the experiments, these responses' small output-potent leakage did not diminish, nor did it more beneficially affect cursor velocity.
Motor cortex's many-to-few projections to downstream targets may explain why early feedback-related activity did not need to specifically avoid output-causing dimensions. Since the output-null subspace is much larger than the output-potent subspace, inputs will tend to only weakly project onto output-potent dimensions even without special structure. As long as the circuit can subsequently transform these inputs into corrective output-potent activity with much larger magnitude than that of any premature leakage, this will adequately isolate early activity from downstream targets. This effect relies on having many more output-null dimensions than output-potent dimensions, which leads to the prediction that reducing the number of output-null dimensions will reduce the SNR. We tested this by recalculating the Late: Early output-potent ratios for smaller subsampled neural ensembles (Figure 6B). Consistent with this prediction, our measure of circuit SNR diminished as the size of the output-null subspace shrank.
Discussion
This study investigated how motor cortex prevents changes in its activity following movement perturbations from prematurely “leaking out” to downstream targets before the appropriate corrective movement output is ready. We will first relate our results to previous perturbation studies and summarize our working model of sensory feedback-related motor cortical dynamics. Next, we will connect this work to other emerging evidence that separating distinct computations into orthogonal neural subspaces is a widely used neural computational strategy. Finally, we will discuss what these results reveal about how the brain controls a BMI and their implications for the design of neural prostheses that will encounter real-world perturbations.
Early motor cortical visuomotor feedback activity
We observed feedback-related modulation in motor cortex as early as 65 ms after cursor jump perturbations, consistent with the earliest reported visually-driven responses in this area (Ames et al., 2014; Archambault et al., 2011; Georgopoulos et al., 1983). This first response did not appear to directly cause movement during arm reaches, which is broadly consistent with previous studies showing differences between initial and subsequent motor cortical activity following mechanical perturbations (Herter et al., 2008; Omrani et al., 2014, 2016, Pruszynski et al., 2011, 2014). The present study extends prior work to the case of perturbations signaled only by vision, while also showing that the initial response definitely did not affect cursor velocity during BMI use. This result further validates the question of how the initial activity was isolated from the circuit's movement-causing downstream targets.
A noteworthy difference between this and previous studies is that the early motor cortical responses we observed were perturbation-specific; this was not the case in past mechanical perturbation studies (though task engagement-specific initial responses were seen in parietal area A5 in Omrani et al., 2016). While the different sensory feedback modality is our prime suspect to explain this difference, the behaviors used to probe early response perturbation-specificity in (Omrani et al., 2014, 2016) were also different from ours. Future experiments using a mechanical perturbation variant of the Cursor Jump Task would help clarify whether sensory modality or behavioral requirements explain the perturbation-specific early responses we found.
Output-null to output-potent dynamics
Our results provide strong evidence that an output-null mechanism (Kaufman et al., 2014) isolates early feedback-related motor cortical responses from downstream targets by cancelling out at the population read out. Later responses – now appropriately patterned for correcting the perturbation – enter output-potent dimensions corresponding to firing rate patterns that affect movement. We observed that neural trajectories following distinct cursor jump directions traversed different paths through output-null and output-potent dimensions. We have summarized this process, which we view as likely being part of the transformation of perturbation-specific inputs into distinct corrective outputs, in Figure 7.
Figure 7. Summary schematic.
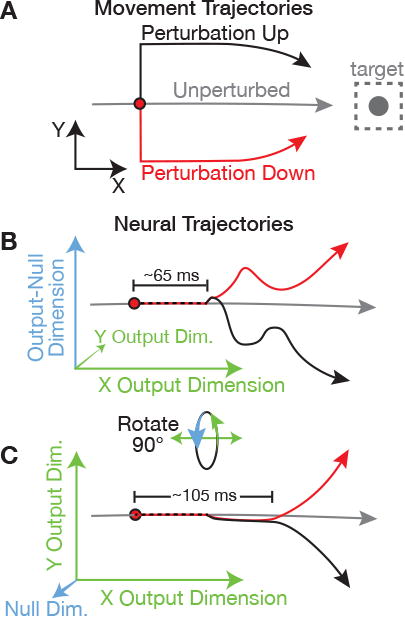
(A) Example movement for this schematic. Rightward cursor movement is perturbed either up (black trajectory) or down (red trajectory).
(B) Neural dynamics viewed such that an output-null dimension is on the vertical axis, and an output-potent dimension that affects cursor × velocity is on the horizontal. For visual clarity, the horizontal axis also approximates time, as if rightward neural push is increasing over time. The perturbation-evoked response is initially restricted to output-null dimensions, where neural trajectories due to different perturbations (red and black) diverge both from the unperturbed trajectory (gray) and from each other. Latency labels are based on monkey J's BMI results.
(C) The same neural activity, now rotated out of the page such that the vertical axis is a second output-potent dimension that affects y velocity. Initial feedback-related neural responses do not change y velocity. Later, the diverging red and black trajectories cause opposite y output corrections. A key feature of these motor cortical dynamics is a period of time during which activity is changing but is decoupled from the downstream motor effector.
There are two caveats to this interpretation. First, while we've precisely shown that an output-null mechanism was used during BMI control, our arm-controlled results rely on an approximate neural-to-movement mapping and can only suggest that this same arrangement was used. Thus, although the BMI data shows that an output-null mechanism can prevent feedback-related activity from causing movement, there may be alternative or additional mechanisms that isolate motor cortical activity from muscles. Second, we only examined responses to visually signaled perturbations. Movement feedback is often signaled by proprioception, and these inputs reach motor cortex with shorter latency via different pathways (Cluff et al., 2014; Pruszynski et al., 2011). Future studies are needed to examine whether the same output-null to output-potent dynamics occur after mechanical perturbations.
This study adds to a growing body of knowledge suggesting that the brain makes wide use of a computational motif in which processes are isolated from one another in orthogonal neural subspaces. The output-null mechanism is a candidate for explaining how many different neural circuits isolate their activity from downstream targets because most circuits have many more neurons than outputs. As such, restricting circuit activity to population-level patterns that cancel out downstream may not be an onerous constraint. In the motor system, this mechanism is well-suited for shaping circuit output without requiring that every signal present in the neurons is sent to the muscles: prior work suggests it permits motor cortical activity to modulate during reach planning without causing movement (Kaufman et al., 2014), to ignore sensory inputs until movement is needed (Zagha et al., 2015), and to permit neural ensemble changes to produce the same net output during learning (Li et al., 2001). In prefrontal cortex, sensory discrimination using different stimulus features appears to confine activity related to the non-relevant cue to output-null dimensions of the integration process (Mante et al., 2013). In these previous studies, specific neural activity patterns were ascribed to be output-potent or output-null (not necessarily using these terms) with respect to the computation being studied based on estimates from limited neural measurements. A major contribution of the present study is that for the BMI task, it definitively shows, for the first time, one process (visual feedback-related activity) being sequestered from another (motoric output) in the null space of a cortical circuit whose output-potent read-out is truly linear and fully observed. This substantially advances the hypothesis that output-null neural subspaces allow for isolated computations within and between circuits, despite sharing the same underlying neurons or direct connections.
These results motivate additional research to understand how circuits develop output-null to output-potent dynamics. One specific question is whether the sensorimotor system will redirect early feedback-related inputs into output-null dimensions if they otherwise would project strongly onto output-potent dimensions. This can be tested either by changing the circuit's inputs so that they target existing output-potent dimensions, or by changing the output-potent dimensions such that they align with early responses. BMI experiments provide a tractable way to do the latter manipulation: the decoder could be deliberately modified so that early responses affect cursor velocity. This decoder could then be held fixed in a long-term learning study (Ganguly and Carmena, 2009; Ganguly et al., 2011) that asks if early responses change to avoid BMI output dimensions.
Understanding BMI use as a sensorimotor process
This study primarily used BMIs as tools for neuroscience, but it also provides new insights into how the brain responds to perturbations when operating a BMI. Previous BMI studies have examined neural adaptation after remapping decoders, which results in decoding errors (Golub et al., 2015; Jarosiewicz et al., 2008; Sadtler et al., 2014; Salas and Tillery, 2016), and have shown that users can re-acquire a jumped target (Shanechi et al., 2016). However, to the best of our knowledge this is the first study to explicitly examine neural dynamics after a BMI is externally perturbed. This let us answer whether the “unnatural” BMI arrangement of bypassing many of the cortical and subcortical circuits involved in natural movements (Green and Kalaska, 2011) would cause deleterious feedback following perturbations. We did find strong cursor jump responses in the neural population used to drive the BMI, but this early activity was not problematic because it was output-null with respect to the decoder.
Resilience to interference from these visual feedback-related responses did not require learning on the part of the monkeys or BMI decoder adaptation (Shenoyand Carmena, 2014). Rather, it resulted from BMI output being caused only by neural changes in a specific low-dimensional subspace. Critically, the monkeys could volitionally modulate these output-potent dimensions strongly enough that the minimal projection of early activity into these dimensions was inconsequential. In this study, BMI output-potent dimensions were ‘biomimetic’ in the sense that we sought to match them to an intuitive pre-existing neural-to-kinematic mapping (Shenoy and Carmena, 2014). It remains to be seen whether less biomimetic decoders, especially those with output-potent dimensions that the animal modulates more weakly, would be more susceptible to deleterious perturbation-evoked activity. More broadly, the similarities we observed in neural and behavioral perturbation responses during arm and BMI-controlled tasks support the notion that high-performing BMI use engages many of the same sensorimotor processes as natural movements (Golub et al., 2015, 2016; Green and Kalaska, 2011). This argues for studying this type of BMI as a form of motor control, as opposed to operant conditioning and biofeedback.
This study also provides the most direct measurement to date of the control loop latency of an intracortical spike-driven BMI relying on visual feedback: 103 and 177 ms for the two monkeys. Latency is a critical control system characteristic and has profound consequences for BMI controllability (Chase et al., 2009; Cunningham et al., 2011; Stavisky et al., 2015b). Our perturbation correction latency measurements are broadly consistent with those reported in (Golub et al., 2015), which were based on target presentation reaction times. These latencies can provide parameter values in feedback control models used in several BMI decoding methods (Gilja et al., 2012; Shanechi et al., 2016). They also provide a benchmark against which to measure control loop latency reductions that will hopefully be achieved by artificially writing proprioceptive and somatosensory feedback into the BMI user's brain (Dadarlat et al., 2014; Flesher et al., 2016).
We observed that during both BMI and arm control, corrective responses ramped up slower after perturbations during target hold compared to during movement. We speculate that the sensorimotor network responds differently to hold period perturbations because it is in a different regime: a postural control state in the arm-controlled task, and an analogous stability-optimizing state during the BMI task. This regime may need to be disengaged before the system re-enters a movement control state in order to correct the perturbation (Cluff and Scott, 2016; Kurtzer et al., 2005).
Implications for using BMIs in a perturbation-prone world
How the nervous system responds after detecting errors will have practical consequences during real-world BMI use. Feedback-related activity can be triggered by decoding mistakes, external perturbations of the effector (e.g., bumping a prosthetic arm), or changes in the movement target. The latter two scenarios are increasingly relevant now that BMIs in human clinical trials are being used not only to control computer cursors (Jarosiewicz et al., 2015; Pandarinath et al., 2017), but also to restore arm function with robotic arms (Hochberg et al., 2012; Wodlinger et al., 2015) or stimulating the user's paralyzed muscles (Ajiboye et al., 2017). Our finding perturbation-evoked signals in macaque homologues of areas targeted in human BMIs means that neural engineers should be on guard for deleterious sensory feedback effects. That said, we predict that these responses will not interfere with prosthetic limb control, as was the case for two-dimensional cursor control. Although the output-potent subspace's dimensionality will be larger when decoding higher degree-of-freedom control signals, it will still be far smaller than the output-null subspace if a sufficiently sized neural population is used to drive the BMI. Unintended feedback-related output should be minimal if the SNR of intended output to early “leakage” is high, meaning that 1) neural activity preceding the corrective response does not project strongly onto output-potent dimensions, and 2) the user can generate strong modulation in output-potent dimensions. If this turns out not to be the case, a possible solution is to adjust the decoder to better fit either (or both) of these criterion using training data that include perturbations. Our observation that the early cursor jump response is low-dimensional (Figure S5D) makes us anticipate that it can be contained in the output-null subspace.
There is one class of perturbation-evoked responses that could be particularly problematic: internally generated movement intentions. A BMI user's response to perceiving an error could include, in addition to corrective BMI commands, other fully-formed movement commands such as flinching, compensatory movements of other parts of the body, or initiating additional voluntary movement. Regardless of whether these responses move muscles, the additional neural activity patterns recruited may be more likely to align with BMI output-potent dimensions. If this interfered with BMI control, potential solutions include training the decoder in the presence of these other movements to improve its ability to discriminates them from BMI commands, as well as leaning on neural adaptation to reduce the overlap between BMI commands and other movements (Orsborn et al., 2014).
Thus far we have framed the early perturbation-evoked motor cortical response as a potential nuisance, but it also presents an opportunity. We found that information about perturbation direction could be detected in this signal before the monkeys generated corrective BMI output. If a parallel BMI ‘execution error decoder’ could infer perturbation specifics or the desired correction quickly and with high accuracy, the system could automatically correct the error faster than the BMI user would otherwise be able to. This proposed motor execution error auto-correction has parallels to our ongoing work to detect and correct for task outcome errors (Even-Chen et al., 2015).
Star*Methods
Contact for Reagent and Resource Sharing
Further information and requests for resources and reagents should be directed to and will be fulfilled by the Lead Contact, Dr. Sergey D. Stavisky (sergey.stavisky@stanford.edu).
Experimental Model and Subject Details
Three adult male rhesus macaques (monkeys J, L, and R) were trained to sit head-fixed in a primate chair and perform 2D target acquisition tasks by controlling an on-screen cursor's velocity with either their hand movements (‘arm-controlled’) or via a BMI (‘BMI-controlled’). The monkeys were 13 (J), 19 (L), and 9 (R) years old and weighed 16 kg (J), 9 kg (L), and 13 kg (R) at the time of these experiments. They were implanted with 96-electrode arrays (1 mm electrodes spaced 400 μm apart, Blackrock Microsystems) using standard neurosurgical techniques. Monkey J had one array implanted into primary motor cortex (M1) and the other into dorsal premotor cortex (PMd) of the same hemisphere 64 months prior to the BMI experiments and 68-69 to months prior to the arm reaching experiments. Monkey R had a similar dual array implant 42 months prior to the experiments. Monkey L was implanted with a single array at the M1/ PMd border 83 months prior to the BMI experiments and 88 months prior to the arm reaching experiments.
All procedures and experiments were approved by the Stanford University Institutional Animal Care and Use Committee.
Method Details
Behavioral Tasks
The experiments and analyses were implemented using custom MATLAB and Simulink Real time software (Mathworks). The task was displayed in virtual reality using a Wheatstone stereograph with a latency of 7 ± 4 ms as described in (Gilja et al., 2012). Arm reaches were made in a fronto-parallel plane, with the display blocking the monkey's view of his own arm. The position of a reflective bead taped to the monkey's hand was tracked with an infrared system at 60 Hz (Polaris, Northern Digital Inc.). The non-reaching arm was gently restrained.
Radial 8 Target Task
We used data collected while the monkeys performed an arm-controlled Radial 8 Target Task to estimate Warm, the mapping from motor cortical firing rates to 2D arm endpoint velocity. Passively observed and BMI-controlled variants of this task were also used during BMI decoder training that determined Wbmi, the mapping from firing rates to BMI cursor velocity. In this task, the monkey controlled the cursor's velocity to acquire targets whose locations alternated between the workspace center and one of eight peripheral targets equidistantly spaced along a circle with a 12 cm radius that was centered on the workspace center. To successfully acquire a target, the monkey had to bring the cursor within a 4 × 4 cm target acquisition area and hold it there for a continuous 500 ms. The target changed color to signify when the cursor was within the acquisition zone. Leaving the target during this hold period reset the timer but did not result in immediate failure. If the monkey acquired the target within a time limit of 2 s (arm control) or 5 s (BMI control), he received a liquid reward. Otherwise, he heard a failure tone and was presented with the center target again. Radial targets were only presented following successful acquisition of the center target. Inter-trial intervals were 40 ms. Radial 8 Target Task blocks used to fit Warm or Wbmi consisted of ∼500 trials at the start of each experiment session in monkeys J and L and ∼300 trials in monkey R. In BMI experiments, we also collected ∼200 trials of the Radial 8 Task (all targets 12 cm from workspace center) using the finalized ReFIT decoder prior to starting the main Cursor Jump task described below; these data were used to compare unperturbed and perturbed reaches with this decoder (Figure S5).
Cursor Jump Task
This study's core task was a two-target variant of the Radial 8 Target Task with perturbations. We used only two targets to increase the number of repetitions of each target/perturbation condition. The two possible radial targets were arranged 12 cm from the workspace center along either the horizontal axis or vertical axis; we refer to the axis connecting the workspace center and target as the trial's ‘Task Axis’. To increase the number of repetitions of a given jump event type per dataset, the Task Axis orientation was fixed within a given experiment session, but varied across experiment sessions. The sequence of radial targets was random.
The key experiment manipulation was that on a random 25% of trials towards radial targets, a perturbation was applied. This perturbation consisted of offsetting (‘jumping’) the cursor position by 6 cm perpendicular to the Task Axis (we call this dimension the ‘Perturbation Axis’, see Figure 2A). Cursor jumps were applied on the next decode update time step (BMI control) or cursor position update (arm control) after one of four possible ‘jump event type’ criteria were met. Three of the jump event types had a spatial criterion: the jump happened after the cursor travelled either 3 cm, 6 cm, or 10 cm towards the target along the Task Axis. In the fourth ‘jump during hold’ event type, the cursor jump occurred on the decode time step prior to 300 ms into the target hold period. Empirically, the mean time when this happened was 287.0 ms into the hold for monkey J BMI experiments (25 ms decode time steps) and 274.0 ms for monkey L BMI experiments (50 ms decode time steps). During arm control, the jump occurred 288 ms into the hold. Only one perturbation occurred per trial. In arm-controlled experiments, only a single event type was used per experiment session, whereas the different jump event types were interleaved throughout each BMI session with equal probability of each jump event type occurring on a given perturbed trial. For each jump event, the position offset was equally likely to be applied in either of the two directions along the Perturbation Axis.
The time when the cursor jump command was sent to the display computer was recorded with 1 ms resolution, after which it appeared at the next 120 Hz monitor update. These jump event types corresponded to different phases of the reach (starting movement, mid movement, acquiring target, or trying to keep the cursor still), and so we analyzed responses to each event type separately. The delivery of cursor jump position offsets in arm-controlled experiments required us to counteract this offset at the end of each perturbed outward trial so as to not carry a (possibly accumulating) hand-to-cursor offset over multiple trials. Thus, we applied a second, opposite cursor jump as soon as the center target reappeared, resulting in a consistent hand-to-cursor position relationship at the start of each outward trial. Cursor Jump Task return-to-center trials were not analyzed in this study.
Monkeys J and L's data were collected specifically for this study. We found that the evidence for putatively output-null to output-potent neural dynamics following perturbations during arm control was substantially weaker in monkey L than J. This prompted us to examine arm control cursor jump responses in a third monkey, R, to bolster confidence in our results. Monkey R's data had been collected for a different study but shared the essential experiment elements of monkey J and L's Radial 8 Target and Cursor Jump Tasks. The specific differences in monkey R's tasks were as follows. The Radial 8 Target Task targets were located 8 cm rather than 12 cm from the workspace center. In his Cursor Jump Task, there were four rather than two radial targets presented during each experiment session; these were located 6 cm from the workspace center along the cardinal axes. Furthermore, these targets had smaller 3 × 3 cm acquisition areas and the trial time limit was slightly longer at 2.5 s. The probability of a jump on outward trials was 20% or 30%, depending on the dataset. Monkey R experienced two different jump event types: either 1) jump at3 cm along the Task Axis with a 4 cm displacement (3 datasets), or 2) jump at 4 cm with a 5 cm displacement (5 datasets). His center target hold period was 1 s long, during which time the cursor “locked” to the workspace center as long as the hand didn't move outside the target. It unlocked upon presentation of the radial target, at which time hand velocity once again moved the cursor. This meant that the cursor always started exactly from the workspace center during monkey R's outward reaches. When we analyzed monkey R's two jump event types separately, we found them to be very similar; these data are therefore combined into a single ‘jump at 3-4 cm’ jump event type to increase trial count and statistical power when calculating neural and kinematic differences and in Figure 2C,D.
Monkeys were motivated to acquire and hold the target quickly in order to receive their liquid reward. We therefore used the time to target performance metric to quantify how much cursor jumps interfered with target acquisition performance. Time to target is defined for successful trials only as the time elapsed between when the radial target is presented and when the cursor entered the target acquisition area prior to a successful target hold. Neither the 500 ms final target hold time, nor the “stolen” hold time preceding a jump during hold event, were included in this performance metric because these time costs were outside the monkey's control. Mean and standard deviation of times to target are reported aggregating across all experiment sessions' trials in Figures 2 and 3. They are separated by individual sessions in Figure S1.
Neural recording
Voltage signals from each of the array electrodes were band-pass filtered from 250 to 7500 Hz and then processed to obtain multiunit ‘threshold crossings’ spikes. A spike was detected whenever the voltage crossed below a threshold set at the beginning of each day to be -4.5 times rms voltage. We did not spike sort to assign spikes to individual putative neurons and instead grouped together threshold crossings on a given electrode; the population activity will therefore include both single- and multiunit activity. We believe that this is justified because: 1) threshold crossings were the signal actually driving the output during the BMI Cursor Jump Task, in keeping with best practices for delivering high BMI performance (e.g., Gilja et al., 2012; Pandarinath et al., 2017); 2) decoding multiunit spikes in addition to well-isolated single-unit activity often increases the quantity of information that can be obtained from chronically implanted multielectrode arrays (Oby et al., 2016); and 3) we are making claims about information present in the population ensemble activity and in lower-dimensional linear projections of this activity, rather than characterizing responses of individual neurons. Monkey J and monkey L's arrays detected single- or multiunit spikes on almost every electrode. Monkey R's arrays were more degraded, with a number of disabled electrodes on his M1 array and predominantly small-amplitude, putatively multiunit spikes from working electrodes. Across all datasets, the number of electrodes recording spikes was 190 to 192 (monkey J arm-controlled), 95 (L arm), 165 to 167 (R arm), 192 (J BMI), and 93 to 95 (L BMI).
BMI decoding
To establish BMI control of cursor velocity, we used the ‘recalibrated feedback-intention trained’Kalman filter (ReFIT) training protocol and decoding algorithm (Gilja et al., 2012). This involved a two-stage decoder training process to first initialize and then refine a decoder in the absence of overt arm movements. At the start of each experiment, the monkey first observed the cursor perform ∼500 automated trials of the Radial 8 Target Task. These movements went straight to the target at a constant speed and were error-free. When training Monkey L's decoder, the three targets forming the upper quadrant were placed slightly further (13 and 14 cm) based on previous experience that this improved his ability to acquire targets in that quadrant following decoder training. We used the neural and automated kinematic data from these trials to train an initial position-velocity Kalman filter. This first-pass decoder was used to complete an additional ∼500 trials of the Radial 8 Target Task under BMI control. This closed-loop data was then used to fit the final ReFIT velocity decoder after several modifications of the kinematics training data to improve the estimation of the animal's true intent, described in (Gilja et al., 2012). However, because we would subsequently be manipulating cursor position via cursor jumps, we did not apply the ‘position subtraction’ReFIT operation so that the cursor jump would not directly affect decoded velocity. For the BMI experiments in this study, we used a ‘hand restrained training, hand restrained BMI control’ paradigm (Shenoy and Carmena, 2014) in which the monkey's arms were gently restrained during all experiment phases, including the initial open-loop observation training. During decoder training and BMI use, no distinction was made between M1 and PMd electrodes in monkey J, who had an array in each area. For the purpose of the subsequent analyses in this study, they were also analyzed together. This does not preclude there being more nuanced differences based on electrode location, which may be deserving of future study.
Quantification and Statistical Analysis
Datasets
The study includes a total of 39 datasets, each consisting of one day's experiment session with a particular monkey. The arm-controlled experiments consist of 7 sessions from monkey J (4,366 total jump trials, 14,667 no jump trials), 7 from monkey L (2,272 jump trials, 8,596 no jump trials), and 8 from monkey R (700 jump trials, 2,200 no jump trials). The BMI-controlled experiments consist of 8 sessions from monkey J (2,719 jump trials, 8,297 no jump trials) and 9 from monkey L (1,636 jump trials, 5,039 no jump trials). When dataset identifiers are provided (e.g., “J.2015.01.19”), they are of the format <monkey initial>.<year>.<month>.<date>.
Trial exclusion criteria
Both monkeys almost always successfully acquired targets in both the arm-controlled and BMI-controlled Cursor Jump Tasks, with failures likely attributable to the monkey disengaging from the task. We thus restricted our analyses to successful trials. To exclude trials where the monkey is likely to have briefly disengaged from the task, we removed outlier trials with times to target more than three standard deviations longer than the dataset's mean. This comprised a mean of 1.3% and maximum of 2.6% of individual datasets' trials. For analyses in which the monkey's responses to the cursor jump perturbation were averaged across trials of the same dataset-condition (i.e. unique jump-event-type/target/jump-direction/dataset), we also excluded any dataset-conditions with fewer than 5 trials. This excluded 0/28 monkey J and L arm-controlled dataset-conditions, 1/64 monkey R arm-controlled dataset-conditions, 2/128 monkey J BMI-controlled dataset-conditions, and 13/144 monkey L BMI-controlled dataset-conditions.
Estimating Warm
We determined the putatively output-potent and output-null neural dimensions during arm control by approximating a linear mapping, Warm, between measured firing rates, N, and two-dimensional hand endpoint velocity, V, of the form V =WarmN. This mapping was fit separately for each experiment session from neural and kinematic data collected while the monkey performed the arm-controlled Radial 8 Target Task. Neural data from E electrodes were binned every 25 ms, while hand velocity was calculated from hand positions (smoothed to account for the 60 Hz updates) and then sampled every 25 ms. We used data from all successful trials' target onset until when the hand entered the target acquisition area, yielding T ≈ 3,000 to 7,000 data bins for each dataset. To allow for a bias term in the regression, N was augmented by stacking it above a 1 row vector. Thus, the dimensionality of V was [2, T] and N was [E+1, T]. Warm was found via the least-squares solution to this system of equations, computed using MATLAB's mrdivide function.
To better accommodate the delay between motor cortical activity and hand velocity, we tried different latencies (in steps of 25 ms bins) between neural and kinematic data when constructing V and N. We used the Warm from the latency that yielded the best fit for this regression. Specifically, fit quality was evaluated by computing the Pearson's linear correlation between true and reconstructed V on leave-one-trial-out test data that was not used for fitting Warm. The best fit was achieved with neural activity leading velocity by 75 ms in monkeys J and L, and 50 or 75 ms, depending on the dataset, in monkey R. We defined the putatively output-potent component of measured firing rate changes by projecting the firing rates into the row space of Warm, and the putatively output-null component by projecting into the null space of Warm. It is worth emphasizing that output-potent and output-null dimensions were identified from wholly separate data that did not contain cursor jumps; thus, Warm was optimized to predict unperturbed hand velocity from firing rates, with no constraint that early perturbation-evoked activity had to lie in this neural-to-kinematic mapping's null space.
Firing rate and hand velocity changes
To measure how neural activity evolved after a cursor jump, we calculated firing rates using a 25 ms boxcar window slid by 1 ms steps. Whenever data is presented, its timestamp corresponds to the last millisecond of the window, thereby conservatively estimating neural response latencies. We were interested in the change in neural activity specifically due to the perturbation. Therefore, when analyzing perturbation-evoked responses, we first subtracted away the mean responses of otherwise similar unperturbed trials. This served to largely remove underlying firing rate changes related to performing the task. More specifically, for every perturbation trial j, we aligned trial j's firing rate to the time of the cursor jump. We then subtracted away the mean firing rate of all unperturbed trials to the same target in trial j's dataset. These unperturbed trials' responses were aligned to ‘faux jumps’ by assigned them a jump time based on when a jump would have happened on that trial if trial j's jump event type had been in effect. We then calculated a mean jump-evoked firing rate difference for each dataset-condition by averaging across all jump trials in a given dataset that were to the same target, had the same jump event type, and perturbed the cursor in the same jump direction. Thus, as an example, most BMI datasets contributed (4 jump event types) × (2 targets) × (2 jump directions) = 16 dataset-conditions' trial-averaged neural change time series. Unless otherwise noted, all results presented are averaged across all of the monkey's dataset-conditions of a particular jump event type. This was done so that every dataset contributed roughly equally to the final analysis, removing the risk that our results unduly weighted a few dataset-conditions with the most trials.
Shuffle test for change significance
To calculate overall change of firing rates across the E electrodes, we calculated the vector norm of this E-dimensional difference vector at each time point. This captures neural changes due to both increases and decreases in firing rates. Since norms must be non-negative, there will be some ‘baseline difference norm’ just due to single-trial variability unrelated to the difference between unperturbed and perturbed trials. We estimated this baseline difference norm noise floor with a resampling procedure in which we performed the same processing on data that we knew had no perturbation-related activity: we assigned P unperturbed trials to be labeled as perturbed trials, where P was the number of actual perturbed trials for this dataset-condition, and used the remaining unperturbed trials for the mean unperturbed response subtraction. This resampled analysis was repeated 10,001 times. The mean of the resulting resampled difference norms was subtracted from the true data's difference norm to yield time series with baseline difference norms close to zero as shown in, for example, Figure 2D. The resampled data also provided a nonparametric statistical shuffle test for determining when the post-perturbation firing rate change first reached significance. Specifically, the p-value of whether the perturbed trials' firing rates were significantly different from unperturbed trials was calculated by counting, at each time point, how many of the resampled norms the real data's difference was larger than. To minimize false positives due to multiple comparisons, we required the difference to be significant for three consecutive non-overlapping bins in order for the first of these samples to be labeled as a significant change. For example, in order for a firing rate change at time t after a cursor jump to be significant at p < 0.01 required that the true neural difference was larger than 100 of the 10,001 resampled differences, and that this was also the case at t + 25 ms and t + 50 ms. In the rare event that there were not enough subsequent data samples to look for three consecutive bins with significant differences, a more stringent p value of 0.001 was used.
Changes in hand velocity (Figure 2C) were computed in the same manner as described above for changes in firing rates, substituting two-dimensional hand velocity data for the E-dimensional neural firing rates. For significance testing, the bin size for defining an independent sample was 17 ms, corresponding to the frequency of hand position tracking.
Output-potent and output-null neural activity
Putatively output-null and output-potent neural dimensions during arm control were found as described earlier in the Estimating Warm section. To assess how changes in neural activity affected BMI output, we took advantage of the fact that the closed-loop Kalman filter almost immediately converges to a steady-state linear decoder (Malik et al., 2011) of the form:
where x(t) is a 5 × 1 state vector of x- and y- positions and velocities and 1 for bias offset; y(t) is a E × 1 vector of each electrode's spike rate in the current time step; and M1 is a state dynamics matrix that smooths velocity over time and lawfully integrates velocity to change position. The steady-state Kalman gain matrix, here called Wbmi, applies no neural contribution to position but has two rows of weights that linearly map each electrode's firing rate to a cursor x- and y-velocity component. Henceforth we ignore the other rows of Wbmi and treat it as 2 × E. The effect of observed neural activity on time step t onto velocity is the summation of these velocity components. We therefore multiplied firing rates by the Wbmi matrix to calculate the ‘neural push’, i.e. how instantaneous neuralactivity affects BMI output velocity. Firing rates projected through Wbmi are output-potent projections of the neural activity. Note that neural push is an offline analysis measurement and is not quite the same as the true velocity of the closed-loop BMI cursor. This difference has two causes: first, true cursor velocity was subject to a momentum-like term imposed by the M1 state update matrix. Second, true cursor velocity is computed once every (non-overlapping) decode time step, with cursor velocity then interpolated between decode steps. Offline neural push can be computed for any given millisecond using firing rates computed using arbitrary time windows, and should be interpreted as showing how the instantaneous neural activity would affect velocity had the decoder updated at that time. A useful analogy is that neural push is similar to instantaneous muscle force, which is closely related to – but is distinct from – the movement of the arm, which is subject to physical dynamics.
Perturbation-evoked changes in neural push viewed separately along the Perturbation Axis and Task Axis (Figures 4B and S3) is a signed quantity; random variation in neural push would therefore tend to average out to zero and thus no baseline difference norm subtraction was needed. This is not to be confused with subtracting the unperturbed trials' neural push, which we did do as shown in Figure S3. However, the magnitude of output-potent activity change (Figures 2D, 5A, S4), which in the BMI-controlled case is equivalent to the vector norm of the difference between perturbed and unperturbed trials' neural push, is again a non-negative quantity. As such, these measurements had the same source of baseline difference norm noise as described above for perturbation-evoked changes in firing rates. We therefore performed the same resampled baseline norm subtraction and nonparametric significance shuffle testing.
To compute the perturbation-evoked response changes in the output-null subspace, we analyzed the data exactly as for the output-potent subspace, except that instead of multiplying firing rates by Wbmi (in the BMI-controlled experiments) or Warm (in the arm-controlled experiments), we multiplied them by the orthogonal complement of Wbmi or Warm. The rows of Warm and null(Wbmi)T define orthogonal neural subspaces, and are similar to the BMI ‘task-relevant’ and ‘task-null’ neural dimensions in (Flint et al., 2016). The output-null subspace had a dimensionality of E – 2, which comes out to 188 to 190 for monkey J arm-controlled datasets, 93 for L arm datasets, 163 to 165 for R arm datasets, 190 for J BMI datasets, and 91 to 93 for L BMI datasets. The output-potent and output-null neural activity change magnitudes shown in Figures 2D, 5, and S4 are in arbitrary units. More specifically, these are the vector norms of each millisecond's jump – faux jump firing rate difference (in spikes/second) multiplied by W or by null( W )T. The mean of these norms was taken across all dataset-conditions, after which we subtracted the mean across all dataset-conditions' resampled baseline norm differences.
Output-potent and output-null magnitudes were plotted using a shared horizontal time axis and opposite direction vertical axes (potent going up from the midline, null going down) to better show the relative timing of when perturbation-evoked changes in each of these subspaces diverged from zero. To display both the output-null and output-potent time-series (which had very different magnitudes) on the same plot, we scaled each vertical axis such that the largest potent value (across jump event types) would reach the top of the plot and the largest null value would reach the bottom of the plot. Thus, while different jump event types' response magnitudes within a given axis can be directly compared to one another, the magnitude scaling differs between a given plot's null and potent axes, between panels, and between monkeys. In Figure 6, the output-potent and output-null difference norms are reported without resampled baseline difference norm subtraction. For this figure we also normalized Wbmi and null(Wbmi) to each have a matrix 2-norm of 1 and then displayed potent and null activity change magnitudes using a fixed 10:1 scaling. Doing so allows this figure to reveal how much more neural activity projected into the higher-dimensional output-null subspace.
Jump direction related neural differences
We also examined the differences between output-null responses following cursor jump events that displaced the cursor in opposite directions during movements to the same target (Figure 5B). To do so, we calculated the difference between jump-aligned neural activity for a given condition and that of the condition with the opposite jump direction. We then took the vector norm of this difference's output-null projection at each millisecond. Since vector norms are non-negative, we performed a shuffle control to subtract the baseline difference norm and calculate statistically significant differences. This was done using the same process described for jump versus no jump differences in the Shuffle test for change significance section, except that instead of resampling from unperturbed trials, we performed the same analysis after randomly permuting the jump direction labels 10,001 times. To aggregate results across targets and datasets, each dataset/jump-event-type/target contributed one trial-averaged time-series, which were then averaged across datasets/targets.
Electrodes' neural push direction and weight
The decoder training data were used to compute each electrode's velocity“tuning” and its decoder contribution weight. We used the Wbmi matrix described earlier, where the j'th column of Wbmi is the decoder weight vector wj=[wx,jwy,j]T that describes how yj(t), the neural activity observed on electrode j, contributes to x- and y- velocity. Electrode j's decoder contribution is then computed as its average effect on cursor velocity:
where the expectation is taken over every bin of the training dataset. An electrode's relative contribution to the decoder is then calculated by dividing that electrode's contribution by the sum of all electrodes' contributions. Its ‘decoder push direction’ is determined by the angle specified by wj.
Comparing true and shuffled decoders
The purpose of this analysis, which is presented in Figure 6, was to determine whether a specific relationship between the perturbation-evoked response and the BMI decoder explains why initial activity changes were minimally output-potent while later activity changes were strongly output-potent. We did this by comparing the output-potent and output-null firing rate change projections with respect to the true decoder against projections into the output-potent and output-null dimensions of ‘shuffled decoders’ constructed by randomly permuting the true decoder's neural push directions (i.e. columns of Wbmi). This shuffled decoder construction was more conservative than generating random decoder weights because it preserves the distribution statistics of electrodes' decoder contribution weights; while this scrambles electrodes' physiological relationship with movement intentions, it preserves, for example, the number of very low weight electrodes (which effectively increases the size of the null space). With this analysis, if a particular result was similar between the true and shuffled decoders (for example, observing much larger output-potent responses later), it would suggest that the result depended solely on the structure of the neural data (for example, much larger firing rate changes in the later epoch), as opposed to the specific relationship between the neural activity and the motor cortex-to-output mapping defined by the true decoder. In other words, this analysis asks how “interesting” or “unexpected” it is that the observed patterns of neural responses to perturbations were initially confined mostly to output-null dimensions, and later projected strongly into output-potent dimensions.
We defined two analysis epochs for the BMI Cursor Jump Task data: an ‘Early’ epoch (125 to 150 ms after the cursor jump) during which there were substantial firing rate changes that were mostly output-null, and a ‘Late’ epoch (325 to 350 ms) when there was a strong output-potent corrective response. Since the jump during hold event type lacked Late epoch faux-jump activity against which to calculate jump-evoked changes, it was excluded from this analysis. Output-potent and output-null projection magnitudes of the Early and Late activity were defined either with respect to the true decoder (as in Figure 5A), or 10,001 randomly shuffled decoders. We were specifically interested in two ratios: 1) the ratio between the Late and Early epochs' output-potent response magnitudes, shown in Figure 6B, and 2) the ratio between the Early output-null and output-potent response magnitudes, shown in Figure 6C. The first ratio tests whether the high Late:Early SNR we observed was dependent on the decoder used, or whether it could fell out trivially from the neural data alone. Since firing rate changes were larger during the Late epoch, we already expected this ratio to be greater than one for both the true and shuffled decoders; we were interested in whether it was markedly larger for the true decoder. The second ratio tests whether the true decoder was especially well-suited for “ignoring” the early perturbation-evoked response, i.e. projecting it into its null-space. Given the larger number of output-null dimensions, we already expected the null:potent ratio to be greater than one for both the true and shuffled decoders; the question was, would it be markedly larger for the true decoder? If the true decoder's Late:Early output-potent ratio did turn out to be superlatively high, then the combination of both of these analyses would disambiguate whether this stemmed from the true decoder being particularly good at not “letting through” Early neural responses, versus having an unusually large Late response output.
In these analyses we did not subtract away the baseline norm differences as in previous calculations of output-potent and output-null response magnitudes. This was because doing so would cause some shuffled decoders' Early output-potent projection magnitudes to be very close to 0, which results in divide-by-near-zero singularities. Not subtracting baseline norm differences made the analysis results more stable but affected them in the conservative direction of underestimating the Late:Early output-null ratio and the early null:potent ratio. This is because adding similar values to both the numerator and denominator of what would otherwise be a large ratio will reduce the ratio.
To test whether these results depend on the relative sizes of the output-null and output-potent neural subspaces, we also repeated these analyses using subsets of our recorded neural population. We calculated Early:Late output-potent ratios and Early null:potent ratios as described above, using between four electrodes and the maximum number of electrodes present in all of the monkey's datasets. For each electrode count Esub, we repeated the analyses 100 times using Esub randomly chosen electrodes out of the monkey's E electrodes. A reduced electrode count Wbmi was recalculated for each resampled electrode subset using the same decoder fitting algorithm (i.e., we fit the ReFIT decoder from the same closed-loop BMI neural and kinematic data but pretended we had only recorded that set of Esub electrodes). For each subsampled decoder we also generated one shuffled decoder. Thus, each dataset-condition provided 100 true decoder and 100 shuffled decoder output-null and output-potent projection magnitudes. We aggregated across dataset-conditions as in previous analyses, and then divided the resulting true and shuffled decoders' ratios. The curves in Figure 6B,C show, for each number of electrodes, the mean of these true/shuffled quotients across the 100 subsamples. Generating just one shuffled decoder from each true subsampled decoder was for the sake of simplicity and compute speed, rather than inherently necessary for this analysis.
Comparing movement initiation and correction
This section, and the next, describe analyses that seek to better characterize the early perturbation-evoked neural response by asking whether they resemble the beginning of unperturbed movements. For example, is the initial neural response to a leftward perturbation essentially the same as the beginning of a rightward reach? Or are jump-evoked responses substantially different from movement initiation activity? In designing an appropriate analysis, we had to define what kind of difference we considered “substantial”. The high-dimensional neural population activities recorded during these two different behaviors would likely be statistically different if we were to compare, for example, PSTHs or neural population states. However, we felt that this would be an overly sensitive and therefore unsatisfactory test. Instead, here we describe a comparison of a simple but intuitive summary metric: directional preference or “tuning.” Consider an electrode that increases its firing rate more after leftward perturbations than rightward perturbations during the Cursor Jump Task. We would characterize this electrode as having a leftward jump direction preference. A leftward perturbation necessitates initiating a correction that points rightward (though not necessarily directly to the right, since there is still a Task Axis component towards the target). Therefore, one possibility is that the initial neural response to this perturbation would resemble the neural activity when initiating unperturbed Radial 8 Task movements to the right (or perhaps up-right or down-right). Under this hypothesis, we would expect that this electrode would also exhibit rightward direction preference in the Radial 8 Task, meaning it would have higher firing rates when movements were initiated to the right of the workspace midline than to the left (here we are treating directional “tuning” as a binary preference along the Perturbation Axis). If an electrode exhibited higher firing rates for a given Radial 8 Task direction and a larger change in rates after perturbations in the opposite direction during the Cursor Jump Task, we categorize it as having ‘consistent’ direction preference across these two behaviors. If, instead, it preferred Radial 8 movements in one direction but Cursor Jump Task corrections in the opposite direction, we categorized its direction preference as ‘inconsistent’ between these tasks. A brief caveat: we chose this analysis because it is conceptually simple and serves as an effective initial foray into asking whether there were noteworthy differences between motor cortical activity during movement initiation and cursor jump correction. We do not mean to imply that this is the only way to characterize these differences, or that directional tuning is the fundamental “meaning” of neural activity in this area; we believe that a more comprehensive comparison between movement initiation and perturbation corrections would be of value in future studies.
We performed this analysis on both BMI and arm-controlled data, using the Radial 8 Task and Cursor Jump Task data recorded during each experiment session. The analysis details are as follows. We defined an early epoch from 0 to 170 ms after the perturbation (Cursor Jump Task) or after target onset (Radial 8 Task). This epoch was chosen because it captured most of the initial transient of output-null perturbation-evoked firing rate changes. We also analyzed directional tuning during a subsequent late epoch from 170 to 340 ms after Radial 8 target onset or the cursor jump. This epoch contained strongly output-potent corrective responses in the Cursor Jump Task and thus served as a point of comparison to show what our metric reported when a similar directional preference was expected between the two behaviors (monkeys actively moved the cursor in similar directions during this epoch). Direction preference comparisons were conducted within a given dataset, and then the number of consistent and inconsistent responses was averaged across datasets. Trial-averaged PSTHs were generated for each condition of the Radial 8 Task and Cursor Jump Task. The analysis was restricted to electrodes that showed statistically significant direction preference during the Radial 8 Task, as determined by a Wilcoxon rank sum test (p < 0.01) between epoch-averaged firing rates of all trials in which the target was to one side of the Task Axis, versus all trials where the target was to the other side (the two targets falling right on the Task Axis didn't belong to either group). For each electrode with tuned Radial 8 Task activity, a Cursor Jump Task perturbation direction preference was calculated separately for movements towards the two different radial targets; thus, each electrode contributed two datums to this analysis per dataset if the 5 trial minimum requirement was met for each target's jump conditions. Perturbation direction preference was determined by asking which jump direction evoked more positive epoch-averaged firing rate changes. For BMI data, we increased the number of trials that were used to generate the underlying PSTHs by first taking the grand mean PSTH across the four jump event types' perturbation-evoked responses. Near the end of the late epoch, when there was no faux jump during hold data from which to calculate firing rate changes, this grand mean PSTH was averaged over just the three remaining jump event type PSTHs. In the arm-controlled data there was only one jump event type per dataset, but consequently there were more jump trials for this one event type.
Figure S5C shows, for the early and late epochs, the breakdown of how many electrode-target pairs with significant Radial 8 Task direction preferences exhibited consistent versus inconsistent preference in the Cursor Jump Task. Note that the higher overall electrode-target counts during the late epoch reflect that during this epoch, more electrodes showed Radial 8 directional tuning. We also tried this analysis with a minimum firing rate difference criterion for determining a Cursor Jump Task preference and saw similar results, but with fewer electrodes passing all of the tuning checks; for simplicity, we present the results using a simple which-direction's-rates-are-higher preference rule.
To help illustrate the type of direction preference differences we are trying to capture with this analysis, Figure S5A,B shows an example electrode's BMI Radial 8 Task and BMI Cursor Jump Task PSTHs. That particular dataset/electrode was chosen to clearly illustrate an early direction preference that is different between the start of unperturbed movements versus corrective movements evoked by a cursor jump. This electrode has above average, but not exceptional, direction preference. To assist in this example, Figure S5B also shows condition-averaged Cursor Jump Task kinematics as a visual reminder of what each target/jump-direction/jump-event-type was. These plots show cursor positions from 100 ms before to 400 ms after the jump. Trial-averaging was performed by taking the mean across trials of each jump-aligned millisecond's x-and y- cursor positions.
Neural dimensionality reduction using PCA
We used principal components analysis (PCA) dimensionality reduction to ask whether the neural population state (Cunningham and Yu, 2014) explored additional neural dimensions during the early response to perturbations. By additional dimensions, we mean patterns of population firing rates that otherwise showed little modulation during regular unperturbed reaches. At a high level, the goal of this analysis was to first identify a set of neural dimensions (via PCA) that captured most of the variance during unperturbed Radial 8 Task movements. We then projected Cursor Jump Task neural activity from either jump-aligned perturbation trials or from faux jump-aligned unperturbed trials into the lower-dimensional subspace defined by these top principal components (PCs), which we will call the Radial 8 Task subspace. Comparing the resulting jump and faux jump cumulative variance explained curves is informative for the following reasons. Since behavior during the faux jumps is similar to reaches in the same directions during the Radial 8 Task, we expect that the Radial 8 Task subspace will capture much of the faux jump neural variance. If perturbation-evoked activity stayed within the same low-dimensional manifold as during unperturbed movements (meaning that most of the firing rate differences due to jumps involved the same patterns of covarying electrodes) then we would expect the Radial 8 Task subspace to capture a similar fraction of the jump variance. Note that the Radial 8 Task includes both outward and inward reaches in eight directions; therefore, if jump responses resembled activity during unperturbed movements in the directions opposing the perturbations, these responses should still be captured well by the Radial 8 Task subspace. If, on the other hand, jump-evoked responses explored altogether new neural dimensions, then we would expect the Radial 8 Task subspace to explain substantially less jump variance than faux jump variance.
We now describe the details of these analyses. We analyzed the BMI Cursor Jump Task because these data had four jump event types per dataset, compared to only one per arm-controlled dataset. This larger number of conditions was better suited to measuring whether the dominant population covariance patterns across time and conditions were consistent between perturbed and unperturbed movements. A trial-averaged, condition-concatenated firing rate data matrix was constructed for each behavior type as follows. For the BMI Radial 8 Task, we constructed PSTHs spanning most of this task: from 0 to 400 ms after target appearance of both outward and inward movements, as well as the entire 500 ms radial target hold period. The Radial 8 Task target hold period was included to sample neural activity patterns likely to be similar to those of the faux jump during hold conditions. This yielded a ‘BMI Radial 8’ data matrix of dimensionality [T·C, E], where E is the number of electrodes, T = 375 (25 less than 400 due to 25 ms bins slid every 1 ms), and C = 24 conditions consisting of 8 targets inward + 8 targets outward + 8 target hold epochs. A ‘BMIJump’ data matrix was constructed using epochs from 0 to 170 ms after the cursor jump for all target/jump-direction/jump-event-type conditions of the BMI Cursor Jump Task. This yielded C = 16 conditions (2 targets × 4 jump event types × 2 jump directions) with T = 150. As with previous analyses, if a condition had fewer than five trials, it was excluded. Special care was needed when constructing the ‘BMI Faux Jump’ data matrix to avoid introducing an analysis artifact because of these trials' different number of conditions (2 targets × 4 jump event types) and higher trial counts (which reduces private spiking noise due to trial averaging). We therefore created two synthetic conditions from each faux jump target/jump-event-type condition. These two synthetic conditions were constructed by choosing a number of faux jump trials, without replacement, to match the trial counts of the two corresponding jump conditions (i.e., those that had the same target and jump event type). This yielded a faux jump data matrix that was the same size as the jump data matrix, and was created by averaging firing rates from the same number of trials. Within all data matrices used for this analysis, the mean activity of each electrode was subtracted, as is standard practice for PCA.
A basis set was obtained by performing PCA on the Radial 8 Task data and arranging the resulting PCs (loadings) in order from highest to lowest corresponding eigenvalue. We measured what fraction of the BMI Jump or BMI Faux Jump variance the first n BMI Radial 8 PCs captured by right multiplying the BMI Jump or BMI Faux Jump data matrix by the PC loadings matrix and dividing the variance of the first n columns of the resulting matrix by the total variance of the matrix. Projections into up to the top 15 PCs are shown in Figure S5D. While there is not consensus on how exactly to define the dimensionality of a certain behavior's neural data, especially when averaging over a limited number of trials per condition, we consider the “elbow” of the curves (e.g., at 4-5 PCs in the BMI data shown), after which additional PCs do not capture substantially more variance, a reasonable rule of thumb.
We also performed PCA directly on the perturbation-evoked firing rate changes (the difference between BMI Jump and BMI Faux Jump PSTHs). The resulting cumulative fraction variance explained curve is labeled ‘∆ BMI Jump (self)’ and provides a measure of the early perturbation-evoked response's dimensionality. A shallow curve would indicate that perturbations cause changes throughout the high-dimensional neural subspace (i.e., with little consistent covariation between electrodes), whereas a steep curve with an elbow after a few PCs would indicate that much of the response is limited to a lower dimensional neural subspace (i.e., it tends to cause consistent covariation across a few patterns of electrodes). Note that the PCs for this dimensionality reduction were identified from the same data whose variance was being explained, as is the standard practice for PCA; here we refer to this as ‘self-PCA’ to differentiate it from using one data matrix's PCs to explain the variance of different data. Self-PCA variance explained will be higher than when projecting the BMI Jump or BMI Faux Jump responses into the Radial 8 Task subspace. As such, it is more useful to compare these curves' shapes to that of ∆ BMI Jump (self), rather than absolute fraction variance explained.
To help contextualize the results of these analyses in terms of the dimensionality of the unperturbed neural data, we also performed PCA directly on the BMI Radial 8 Task PSTHs. These curves are labeled ‘BMI Radial 8 (self)’. The resulting PCs are the same as those that the BMI Jump and BMI Faux Jump data were projected into. Again, it is more helpful to compare the shapes of these variance explained curves to those of the BMI Jump or BMI Faux Jump curves, both because the BMI Radial 8 (self) curve is from self-PCA, and because these data had different trial and condition counts. Lastly, to compare the dimensionality of the BMI and arm-controlled Radial 8 tasks, we also generated ‘Arm Radial 8 Task (self)’ variance explained curves by performing self-PCA on Arm Radial 8 Task PSTHs constructed using the same epochs as the BMI Radial 8 Task. Comparison of the Arm and BMI Radial 8 curves is subject to the caveat that the Arm Radial 8 Task data had higher trial counts and was recorded several months after the BMI Radial 8 Task.
Supplementary Material
Highlights.
Early feedback-related activity cancels out at the motor cortexdownstream readout
Brain-machine interfaces clearly identify output-null and output-potent activity
A large output-null subspace helps early activity avoid causing premature movement
Later corrective output is specifically aligned with output-potent dimensions
Acknowledgments
We thank M. Risch, M. Wechsler, J. Aguayo, C. Sherman, E. Morgan, and L. Yates for surgical assistance and veterinary care; B. Davis, S. Eisensee, and E. Castaneda for administrative support; B. Oskotsky for information technology support. This work was supported by the NSF GRFP (S.D.S. and J.C.K.); NSF IGERT 0734683 (S.D.S.); Christopher and Dana Reeve Paralysis Foundation(S.I.R. and K.V.S.); and the following to K.V.S.: Burroughs Welcome Fund Career Awards in the Biomedical Sciences, DARPA REPAIR N66001-10-C-2010 and NeuroFAST W911NF-14-2-0013, NIHINDS R01NS076460, NIH 8DP1HD075623-04, NIMH #5R01MH09964703, Simons Foundation. K.V.S. is a consultant to Neuralink Inc. and on the Scientific Advisory Boards of Cognescentand Heal; these entities in no way influenced or supported this work.
Footnotes
Author Contributions: S.D.S. and K.V.S. conceived and designed the study. S.I.R and K.V.S. planned and performed the array surgeries. S.D.S. and J.C.K. performed the experiments. S.D.S. analyzed the data and wrote the manuscript. All authors reviewed and edited the manuscript.
Publisher's Disclaimer: This is a PDF file of an unedited manuscript that has been accepted for publication. As a service to our customers we are providing this early version of the manuscript. The manuscript will undergo copyediting, typesetting, and review of the resulting proof before it is published in its final citable form. Please note that during the production process errors may be discovered which could affect the content, and all legal disclaimers that apply to the journal pertain.
References
- Ajiboye AB, Willett FR, Young DR, Memberg WD, Murphy BA, Miller JP, Walter BL, Sweet JA, Hoyen HA, Keith MW, et al. Restoration of reaching and grasping movements through brain-controlled muscle stimulation in a person with tetraplegia: a proof-of-concept demonstration. Lancet. 2017 doi: 10.1016/S0140-6736(17)30601-3. [DOI] [PMC free article] [PubMed] [Google Scholar]
- Ames KC, Ryu SI, Shenoy KV. Neural Dynamics of Reaching following Incorrect or Absent Motor Preparation. Neuron. 2014;81:438–451. doi: 10.1016/j.neuron.2013.11.003. [DOI] [PMC free article] [PubMed] [Google Scholar]
- Archambault PS, Ferrari-Toniolo S, Battaglia-Mayer A. Online control of hand trajectory and evolution of motor intention in the parietofrontal system. J Neurosci. 2011;31:742–752. doi: 10.1523/JNEUROSCI.2623-10.2011. [DOI] [PMC free article] [PubMed] [Google Scholar]
- Athalye VR, Ganguly K, Costa RM, Carmena JM. Emergence of Coordinated Neural Dynamics Underlies Neuroprosthetic Learning and Skillful Control. Neuron. 2017:1–16. doi: 10.1016/j.neuron.2017.01.016. [DOI] [PubMed] [Google Scholar]
- Benjamin PR, Staras K, Kemenes G. What roles do tonic inhibition and disinhibition play in the control of motor programs? Front Behav Neurosci. 2010;4:30. doi: 10.3389/fnbeh.2010.00030. [DOI] [PMC free article] [PubMed] [Google Scholar]
- Bullock D, Grossberg S. Neural dynamics of planned arm movements: Emergent invariants and speed-accuracy properties during trajectory formation. Psychol Rev. 1988;95:49–90. doi: 10.1037/0033-295x.95.1.49. [DOI] [PubMed] [Google Scholar]
- Chase SM, Schwartz AB, Kass RE. Bias, optimal linear estimation, and the differences between open-loop simulation and closed-loop performance of spiking-based brain-computer interface algorithms. Neural Networks. 2009;22:1203–1213. doi: 10.1016/j.neunet.2009.05.005. [DOI] [PMC free article] [PubMed] [Google Scholar]
- Churchland MM, Cunningham JP, Kaufman MT, Foster JD, Nuyujukian P, Ryu SI, Shenoy KV. Neural population dynamics during reaching. Nature. 2012 doi: 10.1038/nature11129. [DOI] [PMC free article] [PubMed] [Google Scholar]
- Cisek P, Kalaska JF. Neural mechanisms for interacting with a world full of action choices. Annu Rev Neurosci. 2010;33:269–298. doi: 10.1146/annurev.neuro.051508.135409. [DOI] [PubMed] [Google Scholar]
- Cluff T, Scott SH. Online Corrections Are Faster because Movement Initiation Must Disengage Postural Control. Motor Control. 2016;20:162–170. doi: 10.1123/mc.2015-0027. [DOI] [PubMed] [Google Scholar]
- Cluff T, Crevecoeur F, Scott SH. A perspective on multisensory integration and rapid perturbation responses. Vision Res. 2014:1–8. doi: 10.1016/j.visres.2014.06.011. [DOI] [PubMed] [Google Scholar]
- Cunningham JP, Yu BM. Dimensionality reduction for large-scale neural recordings. Nat Neurosci. 2014:1–10. doi: 10.1038/nn.3776. [DOI] [PMC free article] [PubMed] [Google Scholar]
- Cunningham JP, Nuyujukian P, Gilja V, Chestek CA, Ryu SI, Shenoy KV. A closed-loop human simulator for investigating the role of feedback control in brain-machine interfaces. J Neurophysiol. 2011;105:1932–1949. doi: 10.1152/jn.00503.2010. [DOI] [PMC free article] [PubMed] [Google Scholar]
- Dadarlat MC, O’Doherty JE, Sabes PN. A learning-based approach to artificial sensory feedback leads to optimal integration. Nat Neurosci. 2014 doi: 10.1038/nn.3883. [DOI] [PMC free article] [PubMed] [Google Scholar]
- Druckmann S, Chklovskii DB. Neuronal circuits underlying persistent representations despite time varying activity. Curr Biol. 2012;22:2095–2103. doi: 10.1016/j.cub.2012.08.058. [DOI] [PMC free article] [PubMed] [Google Scholar]
- Dum R, Strick P. Motor areas in the frontal lobe of the primate. Physiol Behav. 2002;77:677–682. doi: 10.1016/s0031-9384(02)00929-0. [DOI] [PubMed] [Google Scholar]
- Duque J, Ivry RB. Role of Corticospinal Suppression during Motor Preparation. Cereb Cortex. 2009;19:2013–2024. doi: 10.1093/cercor/bhn230. [DOI] [PMC free article] [PubMed] [Google Scholar]
- Even-Chen N, Stavisky SD, Kao JC, Ryu SI, Shenoy KV. An auto-correcting brain machine interface: Error detection using spiking neuronal activity in the motor cortex. 37th Annual International Conference of the IEEE Engineering in Medicine and Biology Society. 2015 doi: 10.1109/EMBC.2015.7318303. [DOI] [PubMed] [Google Scholar]
- Flesher SN, Collinger JL, Foldes ST, Weiss JM, Downey JE, Tyler-Kabara EC, Bensmaia SJ, Schwartz AB, Boninger ML, Gaunt RA. Intracortical microstimulation of human somatosensory cortex. Sci Transl Med. 2016:1–11. doi: 10.1126/scitranslmed.aaf8083. [DOI] [PubMed] [Google Scholar]
- Flint RD, Scheid MR, Wright ZA, Solla SA, Slutzky MW. Long-Term Stability of Motor Cortical Activity: Implications for Brain Machine Interfaces and Optimal Feedback Control. J Neurosci. 2016;36:3623–3632. doi: 10.1523/JNEUROSCI.2339-15.2016. [DOI] [PMC free article] [PubMed] [Google Scholar]
- Ganguly K, Carmena JM. Emergence of a stable cortical map for neuroprosthetic control. PLoS Biol. 2009;7:e1000153. doi: 10.1371/journal.pbio.1000153. [DOI] [PMC free article] [PubMed] [Google Scholar]
- Ganguly K, Dimitrov DF, Wallis JD, Carmena JM. Reversible large-scale modification of cortical networks during neuroprosthetic control. Nat Neurosci. 2011;14:662–667. doi: 10.1038/nn.2797. [DOI] [PMC free article] [PubMed] [Google Scholar]
- Georgopoulos A, Kalaska J, Caminiti R, Massey J. Interruption of Motor Cortical Discharges Subserving Aimed Arm Movements. Exp Brain Res. 1983;49:327–340. doi: 10.1007/BF00238775. [DOI] [PubMed] [Google Scholar]
- Gilja V, Nuyujukian P, Chestek CA, Cunningham JP, Yu BM, Fan JM, Churchland MM, Kaufman MT, Kao JC, Ryu SI, et al. A high-performance neural prosthesis enabled by control algorithm design. Nat Neurosci. 2012;15:1752–1757. doi: 10.1038/nn.3265. [DOI] [PMC free article] [PubMed] [Google Scholar]
- Golub MD, Yu BM, Chase SM. Internal models for interpreting neural population activity during sensorimotor control. Elife. 2015;4 doi: 10.7554/eLife.10015. [DOI] [PMC free article] [PubMed] [Google Scholar]
- Golub MD, Chase SM, Batista AP, Yu BM. Brain–computer interfaces for dissecting cognitive processes underlying sensorimotor control. Curr Opin Neurobiol. 2016;37:53–58. doi: 10.1016/j.conb.2015.12.005. [DOI] [PMC free article] [PubMed] [Google Scholar]
- Graziano MSA. Arm Movements Evoked by Electrical Stimulation in the Motor Cortex of Monkeys. J Neurophysiol. 2005;94:4209–4223. doi: 10.1152/jn.01303.2004. [DOI] [PubMed] [Google Scholar]
- Graziano MSA, Taylor CSR, Moore T. Complex movements evoked by microstimulation of precentral cortex. Neuron. 2002;34:841–851. doi: 10.1016/s0896-6273(02)00698-0. [DOI] [PubMed] [Google Scholar]
- Green AM, Kalaska JF. Learning to move machines with the mind. Trends Neurosci. 2011;34:61–75. doi: 10.1016/j.tins.2010.11.003. [DOI] [PubMed] [Google Scholar]
- Herter TM, Korbel T, Scott SH. Comparison of Neural Responses in Primary Motor Cortex to Transient and Continuous Loads During Posture. J Neurophysiol. 2008;101:150–163. doi: 10.1152/jn.90230.2008. [DOI] [PubMed] [Google Scholar]
- Hochberg LR, Bacher D, Jarosiewicz B, Masse NY, Simeral JD, Vogel J, Haddadin S, Liu J, Cash SS, van der Smagt P, et al. Reach and grasp by people with tetraplegia using a neurally controlled robotic arm. Nature. 2012;485:372–375. doi: 10.1038/nature11076. [DOI] [PMC free article] [PubMed] [Google Scholar]
- Jarosiewicz B, Chase SM, Fraser GW, Velliste M, Kass RE, Schwartz AB. Functional network reorganization during learning in a brain-computer interface paradigm. Proc Natl Acad Sci U S A. 2008;105:19486–19491. doi: 10.1073/pnas.0808113105. [DOI] [PMC free article] [PubMed] [Google Scholar]
- Jarosiewicz B, Sarma AA, Bacher D, Masse NY, Simeral JD, Sorice B, Oakley EM, Blabe C, Pandarinath C, Gilja V, et al. Virtual typing by people with tetraplegia using a self-calibrating intracortical brain-computer interface. Sci Transl Med. 2015;7:313ra179–313ra179. doi: 10.1126/scitranslmed.aac7328. [DOI] [PMC free article] [PubMed] [Google Scholar]
- Kaufman MT, Churchland MM, Santhanam G, Yu BM, Afshar A, Ryu SI, Shenoy KV. Roles of Monkey Premotor Neuron Classes in Movement Preparation and Execution. J Neurophysiol. 2010;104:799–810. doi: 10.1152/jn.00231.2009. [DOI] [PMC free article] [PubMed] [Google Scholar]
- Kaufman MT, Churchland MM, Shenoy KV. The roles of monkey M1 neuron classes in movement preparation and execution. J Neurophysiol. 2013;110:817–825. doi: 10.1152/jn.00892.2011. [DOI] [PMC free article] [PubMed] [Google Scholar]
- Kaufman MT, Churchland MM, Ryu SI, Shenoy KV. Cortical activity in the null space: permitting preparation without movement. Nat Neurosci. 2014;17:440–448. doi: 10.1038/nn.3643. [DOI] [PMC free article] [PubMed] [Google Scholar]
- Kurtzer I, Herter TM, Scott SH. Random change in cortical load representation suggests distinct control of posture and movement. Nat Neurosci. 2005;8:498–505. doi: 10.1038/nn1420. [DOI] [PubMed] [Google Scholar]
- Li CSR, Padoa-Schioppa C, Bizzi E. Neuronal Correlates of Motor Performance and Motor Learning in the Primary Motor Cortex of Monkeys Adapting to an External Force Field. Neuron. 2001;30:593–607. doi: 10.1016/s0896-6273(01)00301-4. [DOI] [PubMed] [Google Scholar]
- Li N, Daie K, Svoboda K, Druckmann S. Robust neuronal dynamics in premotor cortex during motor planning. Nature. 2016;532:459–464. doi: 10.1038/nature17643. [DOI] [PMC free article] [PubMed] [Google Scholar]
- Malik WQ, Truccolo W, Brown EN, Hochberg LR. Efficient decoding with steady-state Kalman filter in neural interface systems. IEEE Trans Neural Syst Rehabil Eng. 2011;19:25–34. doi: 10.1109/TNSRE.2010.2092443. [DOI] [PMC free article] [PubMed] [Google Scholar]
- Maloney LT, Wandell BA. Color constancy: a method for recovering surface spectral reflectance. J Opt Soc Am A. 1986;3:29–33. doi: 10.1364/josaa.3.000029. [DOI] [PubMed] [Google Scholar]
- Mante V, Sussillo D, Shenoy KV, Newsome WT. Context-dependent computation by recurrent dynamics in prefrontal cortex. Nature. 2013;503:78–84. doi: 10.1038/nature12742. [DOI] [PMC free article] [PubMed] [Google Scholar]
- Mel BW. Information Processing in Dendritic Trees. Neural Comput. 1994;6:1031–1085. [Google Scholar]
- Oby ER, Perel S, Sadtler PT, Ruff DA, Mischel JL, Montez DF, Cohen MR, Batista AP, Chase SM. Extracellular voltage threshold settings can be tuned for optimal encoding of movement and stimulus parameters. J Neural Eng. 2016;13:36009. doi: 10.1088/1741-2560/13/3/036009. [DOI] [PMC free article] [PubMed] [Google Scholar]
- Omrani M, Pruszynski JA, Murnaghan CD, Scott SH. Perturbation-evoked responses in primary motor cortex are modulated by behavioral context. J Neurophysiol. 2014;112:2985–3000. doi: 10.1152/jn.00270.2014. [DOI] [PubMed] [Google Scholar]
- Omrani M, Murnaghan CD, Pruszynski JA, Scott SH. Distributed task-specific processing of somatosensory feedback for voluntary motor control. Elife. 2016;5 doi: 10.7554/eLife.13141. [DOI] [PMC free article] [PubMed] [Google Scholar]
- Orsborn AL, Moorman HG, Overduin SA, Shanechi MM, Dimitrov DF, Carmena JM. Closed-Loop Decoder Adaptation Shapes Neural Plasticity for Skillful Neuroprosthetic Control. Neuron. 2014;82:1380–1393. doi: 10.1016/j.neuron.2014.04.048. [DOI] [PubMed] [Google Scholar]
- Pandarinath C, Nuyujukian P, Blabe CH, Sorice BL, Saab J, Willett FR, Hochberg LR, Shenoy KV, Henderson JM. High performance communication by people with paralysis using an intracortical brain-computer interface. Elife. 2017;6:1–27. doi: 10.7554/eLife.18554. [DOI] [PMC free article] [PubMed] [Google Scholar]
- Pruszynski JA, Kurtzer I, Nashed JY, Omrani M, Brouwer B, Scott SH. Primary motor cortex underlies multi-joint integration for fast feedback control. Nature. 2011;478:387–390. doi: 10.1038/nature10436. [DOI] [PMC free article] [PubMed] [Google Scholar]
- Pruszynski JA, Omrani M, Scott SH. Goal-Dependent Modulation of Fast Feedback Responses in Primary Motor Cortex. J Neurosci. 2014;34:4608–4617. doi: 10.1523/JNEUROSCI.4520-13.2014. [DOI] [PMC free article] [PubMed] [Google Scholar]
- Ramnani N. The primate cortico-cerebellar system: anatomy and function. Nat Rev Neurosci. 2006;7:511–522. doi: 10.1038/nrn1953. [DOI] [PubMed] [Google Scholar]
- Rokni U, Sompolinsky H. How the Brain Generates Movement. Neural Comput. 2012;24:289–331. doi: 10.1162/NECO_a_00223. [DOI] [PubMed] [Google Scholar]
- Sadtler PT, Quick KM, Golub MD, Chase SM, Ryu SI, Tyler-Kabara EC, Yu BM, Batista AP. Neural constraints on learning. Nature. 2014;512:423–426. doi: 10.1038/nature13665. [DOI] [PMC free article] [PubMed] [Google Scholar]
- Salas MA, Tillery SIH. Uniform and Non-uniform Perturbations in Brain-Machine Interface Task Elicit Similar Neural Strategies. Front Syst Neurosci. 2016;10:1–12. doi: 10.3389/fnsys.2016.00070. [DOI] [PMC free article] [PubMed] [Google Scholar]
- Scott SH. Optimal feedback control and the neural basis of volitional motor control. Nat Rev Neurosci. 2004;5:532–546. doi: 10.1038/nrn1427. [DOI] [PubMed] [Google Scholar]
- Scott SH. The computational and neural basis of voluntary motor control and planning. Trends Cogn Sci. 2012;16:541–549. doi: 10.1016/j.tics.2012.09.008. [DOI] [PubMed] [Google Scholar]
- Shanechi MM, Orsborn AL, Carmena JM. Robust Brain-Machine Interface Design Using Optimal Feedback Control Modeling and Adaptive Point Process Filtering. PLOS Comput Biol. 2016;12:e1004730. doi: 10.1371/journal.pcbi.1004730. [DOI] [PMC free article] [PubMed] [Google Scholar]
- Shenoy KV, Carmena JM. Combining Decoder Design and Neural Adaptation in Brain-Machine Interfaces. Neuron. 2014;84:665–680. doi: 10.1016/j.neuron.2014.08.038. [DOI] [PubMed] [Google Scholar]
- Stavisky SD, Kao JC, Sorokin JM, Ryu SI, Shenoy KV. System identification of brain-machine interface control using a cursor jump perturbation. 2015 7th International IEEE/EMBS Conference on Neural Engineering (NER), (IEEE) 2015a:643–647. [Google Scholar]
- Stavisky SD, Kao JC, Nuyujukian P, Ryu SI, Shenoy KV. A high performing brain–machine interface driven by low-frequency local field potentials alone and together with spikes. J Neural Eng. 2015b;12:36009. doi: 10.1088/1741-2560/12/3/036009. [DOI] [PMC free article] [PubMed] [Google Scholar]
- Todorov E. Direct cortical control of muscle activation in voluntary arm movements: a model. Nat Neurosci. 2000;3:391–398. doi: 10.1038/73964. [DOI] [PubMed] [Google Scholar]
- Wodlinger B, Downey JE, Tyler-Kabara EC, Schwartz AB, Boninger ML, Collinger JL. Ten-dimensional anthropomorphic arm control in a human brain-machine interface: difficulties, solutions, and limitations. J Neural Eng. 2015;12:16011. doi: 10.1088/1741-2560/12/1/016011. [DOI] [PubMed] [Google Scholar]
- Zagha E, Ge X, McCormick DA. Competing Neural Ensembles in Motor Cortex Gate Goal-Directed Motor Output. Neuron. 2015;88:565–577. doi: 10.1016/j.neuron.2015.09.044. [DOI] [PMC free article] [PubMed] [Google Scholar]
Associated Data
This section collects any data citations, data availability statements, or supplementary materials included in this article.