

Abstract
Importance
The heterogeneity of rate of clinical progression among patients with Alzheimer disease leads to difficulty in providing clinical counseling and diminishes the power of clinical trials using disease-modifying agents.
Objective
To gain a better understanding of the factors that affect the natural history of progression in Alzheimer disease for the purpose of improving both clinical care and clinical trial design.
Design, Setting, and Participants
A longitudinal cohort study of aging from 2005 to 2014 in the National Alzheimer Coordinating Center. Clinical evaluation of the participants was conducted in 31 National Institute on Aging’s Alzheimer Disease Centers. Nine hundred eighty-four participants in the National Alzheimer Coordinating Center cohort study who died and underwent autopsy and met inclusion and exclusion criteria.
Main Outcomes and Measures
We sought to model the possibility that knowledge of neurofibrillary tangle burden in the presence of moderate or frequent plaques would add to the ability to predict clinical rate of progression during the ensuing 2 to 3 years. We examined the National Alzheimer Coordinating Center autopsy data to evaluate the effect of different neurofibrillary tangle stages on the rates of progression on several standard clinical instruments: the Clinical Dementia Rating Scale sum of boxes, a verbal memory test (logical memory), and a controlled oral word association task (vegetable naming), implementing a reverse-time longitudinal modeling approach in conjunction with latent class estimation to adjust for unmeasured sources of heterogeneity.
Results
Several correlations between clinical variables and neurocognitive performance suggest a basis for heterogeneity: Higher education level was associated with lower Clinical Dementia Rating Scale sum of boxes (β = −0.19; P < .001), and frequent vs moderate neuritic plaques were associated with higher Clinical Dementia Rating Scale sum of boxes (β = 1.64; P < .001) and lower logical memory score (β = −1.07; P = .005). The rate of change of the clinical and cognitive scores varied depending on Braak stage, when adjusting for plaques, age of death, sex, education, and APOE genotype. For example, comparing high vs low Braak stage with other variables fixed, the logical memory score decreased a substantial 0.38 additional units per year (95% CI, −0.70 to −0.06; P = .02). Using these data, we estimate that a 300-participant clinical trial with end point of a 20% improvement in slope in rate of change of Clinical Dementia Rating Scale sum of boxes has 89% power when all participants in the trial are from the high Braak stage, compared with 29% power if Braak stage had not used for eligibility.
Conclusions and Relevance
We found that knowledge of neurofibrillary tangle stage, modeled as the sort of information that could be available from tau positron-emission tomography scans and its use to determine eligibility to a trial, could dramatically improve the power of clinical trials and equivalently reduce the required sample sizes of clinical trials.
Introduction
The rate of progression of cognitive symptoms in Alzheimer disease is quite variable, leading to difficulty in counseling patients and requisite large sample sizes for clinical trials.1 There are several sources of variability in the rate of progression, as measured in natural history data and clinical trials. In addition to diagnostic uncertainties, commonly used measures exhibit floor and ceiling effects and nonlinear patterns, all of which complicate the design and analysis of clinical trials. Individual differences in brain reserve might cause a given clinical presentation to be associated with different levels of neuropathologic change. It is possible that individuals with more advanced disease might experience accelerated progression as cognitive reserve fails. This feature can be incorporated into longitudinal modeling, eg, by including a change point in time at which the rate may change; this has been suggested in community-based epidemiological studies.2,3
In this analysis, we postulated that knowing the extent of neuropathological change in a patient might enhance predictions about their future course and thus also allow clinical trials to be designed with fewer patients compared with enrolling allcomers solely based on clinical criteria. If so, a clinical trial might use inclusion and exclusion criteria based on clinical evaluation, biomarkers, and especially amyloid and tau positron-emission tomography (PET) imaging to both establish diagnosis and stage the disease. We investigated the potential sample size benefit conferred through modeling a scenario in which selection of participants takes into account the Braak stage of tau pathology. Braak stage can be established at autopsy by evaluating the distribution of neurofibrillary tangles across the cortical mantle; cross-sectional studies suggest that it would change from initial deposits in the medial temporal lobe (Braak I) to severe pathology across all cortical areas (Braak VI) during a period that may be as long as 15 to 20 years. However, tau PET imaging advances provide the opportunity to assign an in vivo Braak score during the patient’s life.4–6
These analyses suggest the following conclusions: (1) the rate of progression of Alzheimer disease reflects both clinical stage and the extent of neurofibrillary tangle involvement; (2) specific clinical and neuropsychological measures are differentially sensitive to these effects; (3) statistical modeling suggests change points as a technical feature of the models that accommodates rates of progression that change with disease progression as well as floor and ceiling effects of the measurement scales that are also disease-state dependent; and (4) stratification by neurofibrillary staging may dramatically improve power in certain clinical trial settings because taking into account the extent of neurofibrillary involvement as measured by tau PET scan (sufficient to estimate an in vivo Braak score) at enrollment would reduce heterogeneity of patients in a trial.7 Our goal was to achieve major reductions in sample size required for an 80%-powered longitudinal clinical trial designed to detect treatment benefits on rate of progression of 20% to 30%.
Methods
Inclusion and Exclusion Criteria
Participants in this study were autopsied participants in a National Alzheimer’s Coordinating Center (NACC) cohort study of aging based on 31 past and present National Institute on Aging–funded Alzheimer’s Disease Centers.8–11 Alzheimer’s Disease Centers data collected and submitted to NACC between September 2005 and December 2014 were included. Institutional review boards approved the study procedures at each individual Alzheimer’s Disease Center. Informed consent was provided at each center. All data were deidentified. Participants had undergone a baseline visit and approximately annual follow-up visits in which a Uniform Data Set was completed including a minimum participant demographics data set as well as standard motor, behavioral, functional, and neuropsychological assessments. Participants were eligible for this study if they met the following inclusion criteria: (1) no primary neuropathological diagnosis other than Alzheimer disease neuropathological changes, (2) age at death older than 50 years, and (3) apolipoprotein E (APOE) genotype was available. Exclusion criteria included those individuals with non-Alzheimer causes of dementia or mixed underlying pathology felt to contribute to the neurocognitive picture. Of note, these inclusion/exclusion criteria mimic those that may be available during a clinical trial, with clinical examination, magnetic resonance imaging scan, cognitive testing, and amyloid and tau PET providing an opportunity to select individuals with Alzheimer pathological changes but without stroke, Lewy body diseases, and frontotemporal dementia. We excluded those participants with no or minimal plaques (assessed by the Consortium to Establish a Registry for Alzheimer’s Disease [CERAD] score) to explore the potential role of knowing tangle stage in individuals with amyloid plaques present, mimicking a clinical study with positive amyloid PET as an inclusion criterion.
Data Collection
Demographic and clinical data used in this study included sex, years of education, age at death, APOE genotype, neuropsychological tests at each clinical visit including dementia rating sum of boxes score (Clinical Dementia Rating Scale sum of boxes [CDR-SOB])10(ranging from 0 to 18), logical memory testing score11 (using the total number of story units recalled, ranging from 0 to 25), and vegetable naming testing score10 (measured by total number of vegetables named in 60 seconds, ranging from 0 to 77). These measures were chosen because they are widely used measures (and were available in the NACC database), represent different neural systems, may have different slopes and ceiling and floor effects with regard to stage of clinical disease, and provided a limited set of markers of clinical disease.
Neuropathological variables included the Braak stage of neurofibrillary tangles, the CERAD score of neuritic plaques (moderate vs frequent), the presence of incidental Lewy bodies in any region, and the extent of vascular pathology (cerebral amyloid angiopathy, small and large vessel disease, and hippocampal sclerosis).
Statistical Analysis
Our primary goal was to evaluate the association between neuropathological measures and rate of cognitive decline in Alzheimer disease as reflected in longitudinal neuropsychological tests. Several analytical complications arise in this context. One issue is that we could not treat the neuropathological measures as baseline covariates using start of follow-up in NACC as the time origin because they are time varying and measured at autopsy. To address this issue, we modeled the longitudinal trajectories in reverse time using linear models, beginning from the clinic visit closest to death and moving backward in time to the first NACC visit. In reverse time, the autopsy variables are appropriately treated as baseline covariates. The longitudinal modeling of the cognitive outcomes begins at time zero, which is defined to be the last clinic visit. We chose to treat that time as an outcome rather than including it as a covariate at all subsequent times so that all participants could be aligned at their last clinic visit. In fact, the slope estimates from the 2 approaches are the same, while the intercepts differ. Additionally, our use of latent class as a covariate captures cognitive status at last clinic visit.
A second issue in an analysis that aims to investigate the relationship between neuropathological measures and longitudinal neuropsychological outcomes is that it must account for potential associations between the neuropsychological test trajectories and times to last clinic visit or death because the trajectories are truncated by these events. To address this issue, we implemented a joint latent class model12 for the longitudinal and time-to-event analyses. This model assumes each participant belongs to 1 of a few unknown (latent) classes, which is associated with that participant’s neuropsychological outcomes and time to event. This acknowledges that there are unmeasured features that are associated with all facets of disease progression and that must be accounted for in an analysis in which cognitive decline and death are intertwined. The model assumes that given the latent class, the neuropsychological outcomes and time to death are independent, while without adjustment for latent class, they are not. The joint latent class model consists of 3 submodels: (1) a mixed-effects submodel for the longitudinal neuropsychological test trajectory, (2) a Cox proportional hazards submodel for the time to event, and (3) a logistic submodel for latent class membership. The data determine the optimal number of latent classes best supported by the data.
A third issue is that it is possible that increasing extent of disease is associated with a change in the neuropsychological trajectories. While a linear model may be approximately correct for most of the disease course, a change in slope is possible in advanced disease.7,8 In addition to any direct effect of advancing disease on the cognitive trajectory, it also may be associated with a floor or ceiling effect of the neuropsychological test. We addressed this through use of a piecewise linear model, in which the linear trajectory had 1 slope from the last clinic visit backward in time through a fixed number of years prior to death and a second slope from that point back to the start of follow-up. The data determine the optimal change point at which the slopes change among 2, 2.5, and 3 years prior to death, as was used in previous analyses2,13.
A fourth issue is that the times to event, which were used in submodel 3, were right truncated, meaning that they were only included in our sample because they were smaller than times to sampling. Not accounting for this differential observation of smaller times to event in the analysis would lead to bias if the association between time to event and covariates, adjusting for latent class, is different for smaller times than for larger times. We considered 3 time-to-event end points in the Cox proportional hazards submodel portion of the joint latent class model. The first end point is time from initial visit to death, the second is time from initial visit to the last clinic visit, and the third is time from last clinic visit to death. This portion of the latent class model serves technical purposes; ie, it allows for adjustment for unmeasured heterogeneity, but it is not of primary interest in the analysis. Thus, we do not report results from fitting this submodel.
The covariates used in both submodels 1 and 2 include sex, education, age at death, APOE genotype (presence vs absence of ε4), CERAD score (frequent vs moderate), and Braak stages (stage V/VI, III/IV, and 0/I/II). To understand the effect of tangles on the cognitive trajectories, we included the interaction of Braak stages with the (reverse) follow-up time in submodel 1. For latent class membership submodel 3, demographic variables sex, education, age at death, and APOE were considered as covariates in addition to class-specific intercept.
We used the Bayesian Information Criterion for model selection. This includes selection of the number of latent classes in our joint longitudinal and survival submodels, selection of optimal latent class membership submodel, the optimal time-to-event end point for the joint modeling, the time of the change point in the linear model, and the inclusion of interaction terms in the models. The joint latent class models were fitted using the R package “lcmm” (Joint lcmm function; R Programming). After identifying the best models using the Bayesian Information Criterion, we then added the concurrent neuropathologies (including cerebral amyloid angiopathy, Lewy bodies, arteriosclerosis, and hippocampal sclerosis), which are significantly associated with the longitudinal neuropsychological tests, into these models.
We calculated the power for future hypothetical trials by calculating approximate standard deviations for the estimated slopes and, from these, standard errors based on sample sizes within Braak groups. We did this by averaging across the latent classes using estimated latent class membership probabilities and approximate sample sizes within latent classes, which are based on highest posterior probability class assignment. We used the slopes prior to the change point for each model to best approximate the decline that would be seen in a short-term clinical trial. These calculations are approximate because they assume that a slope is measured for each participant with a standard deviation that is based on the standard error of the estimated model-based slope.
Results
Demographics
Figure 1 illustrates the selection procedure based on inclusion and exclusion criteria. As of December 2014, the 2005 to 2014 NACC autopsy cohort consisted of 3345 participants; of these, 984 participants met all the eligibility criteria and did not meet any of the exclusion criteria.
Figure 1.
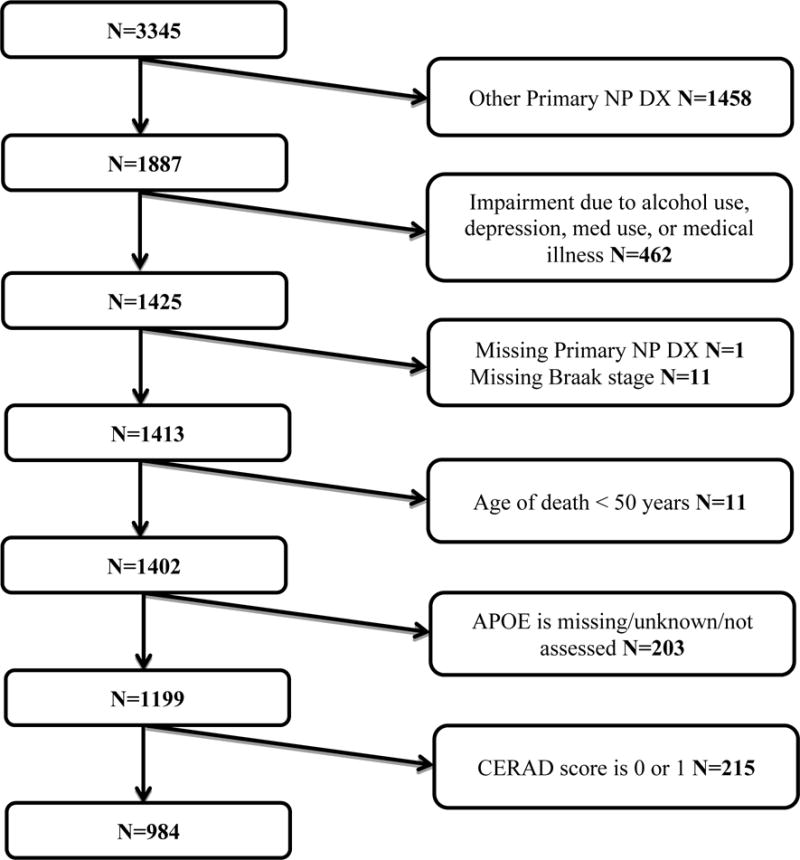
Flow-chart of the selection process from December 2014 data freeze of the National Alzheimer’s Coordinating Center (NACC) autopsy cohort. Other primary np dx: other primary neuropathological diagnoses refer to conditions other from Alzheimer disease and include frontotemporal lobar degeneration, progressive supranuclear palsy, corticobasal degeneration, dementia with Lewy bodies, Parkinson disease, hypoxia, hemorrhage/hematoma, necrosis, vascular dementia, hippocampal sclerosis, and prion-associated diseases.
There are 984 participants in the data set (Table 1). The mean length of follow-up from initial visit to last clinic visit was 2.14 years (median, 1.94 years; interquartile range, 0–3.48 years); 281 participants had a single clinic visit and thus 0 days of follow-up. The time from last clinic visit to death had a mean of 1.26 years (median, 0.85 years; interquartile range, 0.45–1.61 years); 1 participant had an interval of 0. Other demographic features are also listed in Table 1.
Table 1.
Demographic Characteristics of the NACC Autopsy Cohort
| Characteristic | Total (n=984) |
|---|---|
| Female, No. (%) | 435 (44.2) |
| Age of death, mean(SD), year | 82.0 (10.1) |
| Education, mean(SD), yeara | 15.1 (3.2) |
| APOE genotype, No. (%) | |
| Absent of APOE E4 | 428 (43.5) |
| Present of APOE E4 | 556 (56.5) |
| Length of follow-up from initial visit to last clinical visit, median(IQR), year | 1.94 (0, 3.48) |
| Length of follow-up from last clinical visit to death, median(IQR), year | 0.85(0.45, 1.61) |
Abbreviations: IQR, interquartile range.
Not available for 12 individuals.
Participants had a mean of 1.9 clinic visits within 3 years of death, and this is apparently independent of Braak stage at death (Table 2). The median time from last clinic visit to death increased with Braak stage, suggesting that clinic visits decreased with increasing Braak stage. At the last clinic visit prior to death, participants at the highest Braak stage had nearly plateaued in their performances on the logical memory test and the vegetable naming test (Table 2). This motivated us to use piecewise linear models as a technical tool to account for the leveling of the trajectories.
Table 2.
Summary of Clinical Visits and Neuropsychological (NP) Tests by Braak Stages
| Braak stage | |||
|---|---|---|---|
| Low (0/1/2) | Moderate (3/4) | High (5/6) | |
| Average number of clinical visits per subject within 3 years before death (#visits / #subjects) | |||
| CDR-SOBa | 1.94 (95/49) | 1.96 (313/160) | 1.93 (1292/668) |
| Logical memorya | 1.88 (75/40) | 1.92 (236/123) | 1.72 (592/344) |
| Vegetable naminga | 1.80 (79/44) | 1.93 (235/122) | 1.71 (623/365) |
| Time from last clinical visit to death, Median (IQR), year | |||
| 0.56 (0.45, 0.93) | 0.75 (0.43, 1.25) | 0.89 (0.47, 1.73) | |
| Neuropsychological (NP) tests results at the last clinical visit, Median (IQR) | |||
| CDR-SOB | 0 (0, 6.0) | 5.75 (1.0, 12.0) | 16.0 (10.0,18.0) |
| Logical memory | 12 (9.0, 14.0) | 6.0 (2.0, 10.0) | 1.0 (0, 4.0) |
| Vegetable naming | 10.0 (6.0, 12.0) | 6.0 (3.0, 10.0) | 3.0 (1.0, 6.0) |
Abbreviations: IQR, interquartile range.
CDR-SOB was measured at each clinical visit for all the participants who had clinical visits within 3 years before death. The other two neuropsychological tests, logical memory and vegetable naming, were not available for certain participants.
Longitudinal sub-model results
The estimated regression coefficients for the optimal longitudinal submodels for each of the 3 neuropsychological test outcomes are summarized in eTable 1 in the Supplement. For the CDR-SOB and vegetable naming neuropsychological tests, the models with a change point at 3 years are preferred to the ones with a change point at 2 years (similar to Yu et al,2 2012); for the logical memory test, the models with a change point at 2 years are preferred to the ones with a change point at 3 years. Among 3 survival submodels we considered, the one with the time from initial visit to the last clinic visit as the survival outcome is preferred. Also, models with 2 latent classes were preferred to the models with 1 latent class, implying that acknowledging unmeasured heterogeneity among the participants is important and that this heterogeneity is related to time to last clinic visit as well as to the longitudinal cognitive tests. For CDR-SOB and vegetable naming, the models with the interactions between Braak stages and the change point were preferred, while for the logical memory test, the model without the interactions between Braak stages and the change point was preferred.
This analysis of nearly 1000 individuals, followed up longitudinally using standard measures and known to have Alzheimer disease by neuropathological criteria, revealed some interesting correlations between clinical variables and neurocognitive performance. Compared with female participants, the male participants had significantly worse cognitive function on logical memory score (β = −0.75; P = .02) and lower vegetable naming scores (β = −1.12; P < .001). Higher education level was associated with lower CDR-SOB (β = −0.19; P < .001) and higher logical memory score (β = 0.25; P < .001). Each increase in year at death was associated with better cognitive function, eg, lower CDR-SOB (β = −0.05; P = .002) and higher logical memory score (β = 0.06; P < .001). Presence of the APOE ε4 allele was significantly associated with higher CDR-SOB (β = 0.67; P = .04) and lower logical memory score (β = −0.76; P = .01), after adjusting for Braak stage and subsetting to those with moderate or frequent plaques. Frequent vs moderate CERAD plaques were significantly associated with higher CDR-SOB (β = 1.64; P < .001), lower logical memory score (β = −1.07; P = .005), and lower vegetable naming score (β = −1.09; P = .005).
Because we reversed the time scale by treating the time of death as time origin and included interaction terms between neurofibrillary tangle stages and slope (and/or change point) in the longitudinal submodel, the interpretation of the effects of neuropathological variables in a prospective setting requires the assumption that the relative Braak stages at death are preserved at times prior to death when participants would enter clinical trials.
Cognitive rates of change
Table 3 summarizes the estimates for Braak stage of neurofibrillary tangles adjusted slopes of the cognitive trajectories, their standard errors, and 95% confidence intervals from the final models with concurrent pathologies. These are transformed from the reverse time parameterization of the model to forward time. The numbers listed for each latent class and Braak stage are approximate sample sizes based on highest posterior probability of class membership. We have also included the slopes of the cognitive trajectories based on models that did not adjust for Braak stage; these form the basis for our comparisons of clinical trial designs that select on the basis of PET tau levels and those that do not.
Table 3.
Estimates for Braak Stage Adjusted Slopes of Cognitive Trajectory and Their 95% Confidence Intervals (Presented in Forward Time Scale).
| Outcome: | CDR-SOB | |||
|---|---|---|---|---|
| > 3-years before death | ≤ 3-years before death | |||
| Latent class | Braak stage | n | Estimate (95% CI) | Estimate (95% CI) |
| Overall (w/o Braak) | 920 | 1.17 (1.04, 1.30) | 2.02 (1.89, 2.16) | |
| 1 | High (5/6) | 402 | 2.13 (1.97, 2.28) | 2.99 (2.84, 3.15) |
| Moderate (3/4) | 58 | 1.55 (1.17, 1.92) | 2.51 (2.18, 2.84) | |
| Low (0/1/2) | 11 | 1.60 (1.00, 2.21) | 2.72 (2.21, 3.22) | |
| 2 | High (5/6) | 318 | 0.37 (0.20, 0.53) | 1.23 (1.07, 1.40) |
| Moderate (3/4) | 95 | –0.22 (–0.58, 0.15) | 0.75 (0.42, 1.08) | |
| Low (0/1/2) | 36 | –0.16 (–0.75, 0.44) | 0.96 (0.46, 1.46) | |
| Contrast a | High vs Mod | 0.58 (0.19, 0.97) | 0.49 (0.15, 0.83) | |
| High vs Low | 0.52 (–0.09, 1.14) | 0.28 (–0.24, 0.79) | ||
| Mod vs Low | –0.06 (–0.75, 0.64) | –0.21 (–0.79, 0.37) | ||
| Outcome: | Logical memory | |||
| > 2-years before death | ≤ 2-years before death | |||
| Latent class | Braak Stage | n | Estimate (95% CI) | Estimate (95% CI) |
| Overall (w/o Braak) | 649 | –0.68 (–0.78, –0.57) | –0.74 (–1.02, –0.46) | |
| 1 | High (5/6) | 447 | –0.45 (–0.57, –0.32) | –0.78 (–1.07, –0.48) |
| Moderate (3/4) | 130 | –0.45 (–0.65, –0.26) | –0.78 (–1.10, –0.47) | |
| Low (0/1/2) | 39 | –0.06 (–0.38, 0.25) | –0.40 (–0.78, –0.01) | |
| 2 | High (5/6) | 28 | –2.00 (–2.26, –1.75) | –2.34 (–2.72, –1.95) |
| Moderate (3/4) | 4 | –2.01 (–2.32, –1.70) | –2.34 (–2.76, –1.93) | |
| Low (0/1/2) | 1 | –1.62 (–2.02, –1.23) | –1.96 (–2.42, –1.49) | |
| Contrast a | High vs Mod | 0.01 (–0.19, 0.21) | 0.01 (–0.19, 0.21) | |
| High vs Low | –0.38 (–0.70, –0.06) | –0.38 (–0.70, –0.06) | ||
| Mod vs Low | –0.39 (–0.73, –0.04) | –0.39 (–0.73, –0.04) | ||
| Outcome: | Vegetable naming | |||
| > 3-years before death | ≤ 3-years before death | |||
| Latent class | Braak Stage | n | Estimate (95% CI) | Estimate (95% CI) |
| Overall (w/o Braak) | 520 | –0.89 (–1.00, –0.77) | –0.89 (–1.02, –0.75) | |
| 1 | High (5/6) | 65 | –0.70 (–0.98, –0.43) | –0.73 (–1.01, –0.44) |
| Moderate (3/4) | 21 | –0.49 (–0.91, –0.08) | –0.60 (–1.03, –0.17) | |
| Low (0/1/2) | 8 | 0.07 (–1.07, 1.20) | –0.95 (–1.72, –0.18) | |
| 2 | High (5/6) | 325 | –0.97 (–1.15, –0.80) | –0.99 (–1.25, –0.74) |
| Moderate (3/4) | 79 | –0.76 (–1.16, –0.36) | –0.87 (–1.27, –0.46) | |
| Low (0/1/2) | 22 | –0.20 (–1.32, 0.92) | –1.22 (–1.97, –0.46) | |
| Contrast a | High vs Mod | –0.21 (–0.64, 0.21) | –0.13 (–0.59, 0.33) | |
| High vs Low | –0.77 (–1.90, 0.36) | 0.22 (–0.56, 1.01) | ||
| Mod vs Low | –0.56 (–1.74, 0.62) | 0.35 (–0.50, 1.20) |
Contrasts among Braak stages are the same for both latent classes.
As an example, for a participant in latent class 2 and high Braak stage (5 or 6), the logical memory score decreases by a mean of 2.00 units per year (95% CI, −2.26 to −1.75) until 2 years prior to death and by a mean of 2.34 units per year (95% CI, −2.72 to −1.95) within 2 years prior to death. For a participant in latent class 2 and moderate Braak stage (III or IV), the logical memory score decreases by a mean of 2.01 units per year (95% CI, −2.32 to −1.70) until 2 years prior to death, and by a mean of 2.34 units per year (95% CI, −2.76 to −1.93) within 2 years prior to death.
Because our Bayesian Information Criterion model selection process did not retain any interaction terms between latent class and Braak stage in the models, the contrasts among Braak stages are the same for both latent classes. Comparing high vs moderate Braak stage (given plaques, age of death, sex, education, and APOE fixed), the logical memory score increased by a mean of 0.01 additional units per year (95% CI, −0.19 to 0.21), which suggests little difference in logical memory score trajectory between high and moderate Braak stage, fixing all other factors (P = .94). However, comparing high vs low Braak stage (given plaques, age of death, sex, education, and APOE fixed), the logical memory score decreased a substantial 0.38 additional units per year (95% CI, −0.70 to −0.06; P = .02). Because moderate and high Braak stages are both associated with near maximal hippocampal involvement, this result may indicate an early ceiling effect for difficult verbal memory tasks as related to extent of neurofibrillary pathology.
The latent classes are a statistical tool that accounts for extra heterogeneity among participants that is not accounted for through measured covariates. It is difficult to assign interpretation to them precisely because they encapsulate what is not measured. In fact, they appear to have different meaning across the 3 cognitive scores that we have analyzed based on the estimated probabilities of class membership for each score: 61% and 39% for CDR-SOB vs 75% and 25% for logical memory and vegetable naming scores.
Implications for clinical trials
These results have implications for clinical trial design and eligibility. We assume that modern clinical trials in Alzheimer disease will select participants on the basis of a positive amyloid scan1,14,15, which is consistent with our selection of participants with moderate or frequent CERAD plaques at autopsy16. We also assume that the latent classes that our data support in our models are present at the same frequencies in a future clinical trial population. We calculated expected placebo slopes and standard errors for 4 different clinical trial population scenarios (eTable 2 in the Supplement). In 1 scenario, the trial entered participants in equal frequencies from high, moderate, and low Braak stage (as would be ascertained through tau imaging). In alternate scenarios, the trial entered participants solely from the low, medium, or high Braak stage. We then posited a drug effect as a percentage improvement over the placebo slope. Finally, we calculated the power for the associated clinical trials. We additionally fixed the drug effect and power and calculated required sample sizes. In all cases, for comparison, we included a trial design that does not select on the basis of Braak stage.
For a 300-participant trial with end point of rate of change of CDR-SOB, the highest power to detect a 20% improvement in slope arises when all participants on the trial are from the high Braak stage (89%). The lowest power (29%) arises when Braak stage is not used for eligibility and a population similar to the one we consider is recruited. In contrast, when there are 100 participants from high, moderate, and low Braak stages, the power is improved to 69%. For logical memory, the highest power arises when all 300 participants are at the moderate Braak stage (68%), with 54% power when all are at the high Braak stage and 51% power when they are equally distributed among stages. The power is 23% when Braak stage is not used for eligibility. For vegetable naming, the highest power arises when all 300 participants are at the high Braak stage (43%) compared with 15% power when they are equally distributed across stages and 36% when Braak stage is not used.
Table 4 displays the sample sizes required for these trials to achieve 80% power for a 20% or 30% change in rate of progression for the duration of the clinical trial and for 2 or 3 years duration. For core outcome measures such as CDR-SOB and logical memory scores, there are dramatic decreases in sample sizes owing to restricting eligibility according to Braak stage, suggesting that knowing the extent of neurofibrillary tangles in patient populations strongly enhances predictions about their disease course. Interestingly, this is not the case for vegetable naming as an outcome measure, owing to its lesser sensitivity to Braak stage (eTable 2 in the Supplement).
Table 4.
Power Calculations for a Theoretical Clinical Trial: Sample Sizes for Fixed Treatment Effects and 80% Power
| Braak stage | Drug effect | ||||||||
|---|---|---|---|---|---|---|---|---|---|
| NP test | All | High | Moderate | Low | Placebo slope | SE | % Improvement | Drug Slope | Power |
| CDR-SOB | 130 | 130 | 130 | 1.071 | 0.054 | 0.2 | 0.857 | 0.803 | |
| 0 | 0 | 420 | 0.916 | 0.046 | 0.2 | 0.733 | 0.803 | ||
| 0 | 700 | 0 | 0.858 | 0.043 | 0.2 | 0.686 | 0.808 | ||
| 230 | 0 | 0 | 1.439 | 0.073 | 0.2 | 1.151 | 0.799 | ||
| 1176 | 1.172 | 0.059 | 0.2 | 0.938 | 0.800 | ||||
| 58 | 58 | 58 | 1.071 | 0.081 | 0.3 | 0.750 | 0.804 | ||
| 0 | 0 | 185 | 0.916 | 0.069 | 0.3 | 0.641 | 0.799 | ||
| 0 | 305 | 0 | 0.858 | 0.065 | 0.3 | 0.601 | 0.800 | ||
| 103 | 0 | 0 | 1.439 | 0.109 | 0.3 | 1.007 | 0.802 | ||
| 523 | 1.172 | 0.089 | 0.3 | 0.821 | 0.800 | ||||
| Logical | 197 | 197 | 197 | –0.710 | 0.036 | 0.2 | –0.568 | 0.800 | |
| memory | 0 | 0 | 1095 | –0.454 | 0.023 | 0.2 | –0.363 | 0.800 | |
| 0 | 400 | 0 | –0.842 | 0.043 | 0.2 | –0.674 | 0.800 | ||
| 552 | 0 | 0 | –0.834 | 0.042 | 0.2 | –0.668 | 0.799 | ||
| 1575 | –0.677 | 0.034 | 0.2 | –0.542 | 0.801 | ||||
| 88 | 88 | 88 | –0.710 | 0.054 | 0.3 | –0.497 | 0.802 | ||
| 0 | 0 | 490 | –0.454 | 0.034 | 0.3 | –0.317 | 0.803 | ||
| 0 | 178 | 0 | –0.842 | 0.064 | 0.3 | –0.590 | 0.800 | ||
| 246 | 0 | 0 | –0.834 | 0.063 | 0.3 | –0.584 | 0.800 | ||
| 700 | –0.677 | 0.051 | 0.3 | –0.474 | 0.801 | ||||
| Vegetable | 927 | 927 | 927 | –0.599 | 0.030 | 0.2 | –0.480 | 0.800 | |
| naming | 0 | 0 | 40600 | –0.202 | 0.010 | 0.2 | –0.162 | 0.800 | |
| 0 | 1550 | 0 | –0.692 | 0.035 | 0.2 | –0.554 | 0.800 | ||
| 735 | 0 | 0 | –0.904 | 0.046 | 0.2 | –0.723 | 0.801 | ||
| 928 | –0.887 | 0.045 | 0.2 | –0.709 | 0.800 | ||||
| 412 | 412 | 412 | –0.599 | 0.045 | 0.3 | –0.420 | 0.800 | ||
| 0 | 0 | 18050 | –0.202 | 0.015 | 0.3 | –0.141 | 0.800 | ||
| 0 | 690 | 0 | –0.692 | 0.052 | 0.3 | –0.485 | 0.801 | ||
| 326 | 0 | 0 | –0.904 | 0.068 | 0.3 | –0.633 | 0.800 | ||
| 413 | –0.887 | 0.067 | 0.3 | –0.621 | 0.801 | ||||
Discussion
A major challenge in development of new therapeutic agents in Alzheimer disease is the difficulty of measuring the effect of disease-modifying agents given the highly variable nature of progression of the illness. We have reexamined the relative rates of progression of patients with Alzheimer disease using the extensive NACC database, which provides information on approximately 1000 individuals who had been followed up clinically at large academic medical centers and whose neuropathological status has been studied in a uniform way.
The primary goal of our investigations was to explore whether a more nuanced enrollment strategy in clinical trials might help identify and limit sources of variability in rate of progression. We have introduced an innovative statistical approach that combines several complex modeling and analytic strategies that, to our knowledge, have not previously been used simultaneously. These are joint latent class modeling of longitudinal and time-to-event outcomes to account for their dependence as well as unmeasured features that are associated with both, proper adjustment for right truncation of the time-to-event outcome by autopsy sampling, and reverse time modeling of the longitudinal cognitive process to enable use of the autopsy information as baseline predictors. In the statistical development, we conducted extensive model selection by examining numbers of latent classes, interaction terms to be included in the models, inclusion of higher-order interaction terms, the time of the change point for the slopes, and used the Bayesian Information Criterion as a numeric guidepost to balance overfitting against explanatory power. This complex modeling revealed 3 important observations. First, individuals with advanced neurofibrillary disease had a more aggressive clinical course, highlighting the potential benefit of tau PET scans to stratify participants. Second, the modeling suggests that there is a change point at which the rate of progression appears to slow in the last few years for individuals who had had more advanced neurofibrillary pathology, although progression is still observed. Our analysis suggests that this is partially owing to effects on measured rate of progression as one approaches ceiling and floor levels of commonly used outcome measures. Interestingly, it is particularly problematic in individuals who have had advanced neuropathological change (Braak stage V/VI), regardless of their clinical level of impairments, suggesting that a nonlinearity in testing may reflect loss of compensatory mechanisms as neural systems fail. Third, and perhaps most interestingly, the best model predicts that variability in the slope of rate of change on all 3 measures; a functional readout (CDR-SOB) and 2 neuropsychological measures (verbal memory and language tests) are improved substantially in the setting of knowledge of neurofibrillary involvement in the cortex. For example, when focusing on individuals in the mild to moderate clinical group, the standard error of the rate of progression measured by CDR-SOB, logical memory performance, or word list generation (vegetables) during 2 to 3 years differs by 2- to 3-fold comparing low Braak scores with high Braak scores, with extent of variability of moderate Braak scores in between.
Because the power to detect change in slope in a disease-modifying trial will in general be highest in the population where the variability is least, there is advantage to understanding what clinical and biomarker attributes define groups with slopes that are most predictable on commonly used outcome measures. The approach of using imaging biomarkers14,15,17, or clinical18 or genetic attributes19 to stratify participants into more homogeneous groups appears to be promising as a technique to limit variability and thus enhance statistical power in disease-modifying trials. For example, we calculate that compared with not taking tau burden into account at all, requiring trial participants to be Braak stage V/VI leads to a decrease in the number of individuals needed to achieve a power of 0.8 to detect a 20% change in rate of progression from 1176 allcomers to 230. While these calculations reflect the specific properties of the cognitive assessments measured and the somewhat arbitrary distinctions afforded by the Braak staging system that reduces a continuous evolution of pathological change to 3 stages, they nonetheless illustrate the potential gain of statistical power that could be afforded by stratification by extent of tau involvement at entry.
Tau PET imaging has not been used for long enough to have multiple years of experience for thousands of individuals, yet it is already clear that the T807 neurofibrillary tangle PET ligand can recapitulate critical features of the neuropathological Braak stage in living patients4. We developed statistical techniques to “look backward” from autopsy, assuming that Braak stage at autopsy was a reasonable surrogate for Braak stage in the previous several years. The new statistical modeling approach accounted for truncation of the longitudinal data owing to death as well as for unmeasured heterogeneity among participants. Both of these modeling approaches were empirically supported by the data, which were selected as optimal models that incorporated the timing of the end of clinical follow-up and the unmeasured heterogeneity. Although this approach requires some assumptions for prospective interpretation (see the Limitations section), it is required given the retrospective nature of the study.
Limitations
A fundamental assumption of our analysis and interpretation is that the Braak stage distribution observed at autopsy would be similar to that which had been present several years before measurement, at least with regard to relative severity of participants. That is, our analysis assumes that a participant who has progressed 1 category beyond another participant at autopsy would also display that relative degree of advanced progression at trial entry. Supporting this assumption, our initial experience suggests that marked changes in Braak stage are not observed in the antemortem-portmortem interval of the handful of cases we have studied within intervals on the order of 1 year.6 Moreover, cross-sectional studies suggest that the natural history of tangle progression goes from Braak I to Braak VI during a period of perhaps as long as 2 decades, suggesting that the rather coarse groupings used here (Braak I/II vs Braak III/IV vs Braak V/VI) would be relatively stable during the approximately 2-year period we are examining.
Another important assumption that we make is that trials would follow participants during the first “linear piece” of their cognitive trajectory (avoiding marked plateauing). Additional limitations are that we did not consider interactions between age, sex, education, and APOE genotype,19 and time (ie, we did not allow them to modify rates of progression). We did this to limit the number of variables in our complex models. Also, these factors would be balanced in a randomized clinical trial. Another limitation is that we did not adjust for potential selection bias associated with the decision to undergo autopsy. The inverse probability weighting strategy, as in our prior study on the NACC autopsy cohort,11 may be used to overcome the selection bias; however, in that study this adjustment did not yield appreciably different results.
Conclusions
Despite these caveats, our analysis strongly suggests that baseline imaging that allows staging on the basis of neurofibrillary tangles could substantially improve the power of clinical trials aimed at changing the rate of progression of the disease. In addition, the results suggest that neurofibrillary tangle PET scans may also have some usefulness for patient counseling in the same way that understanding the stage of a cancer helps physicians communicate to patients their prognosis, even if this is probabilistic in nature. If tau PET scans are approved for clinical use, an in vivo Braak stage may help patients and their families understand the likely rate of progression over the following few years, enhancing clinical planning and potentially improving use of medical resources.
Supplementary Material
Acknowledgments
Supported by the Massachusetts Alzheimer Disease Research Center P50 AG005134 (PI Bradley Hyman, MD, PhD). Rebecca Betensky was supported by AG005134 and Jing Qian and Rebecca Betensky were partially funded by R21AG053695, R01NS094610, the Harvard NeuroDiscovery Center. The NACC database is funded by NIA/NIH Grant U01 AG016976. NACC data are contributed by the NIAfunded ADCs: P30 AG019610 (PI Eric Reiman, MD), P30 AG013846 (PI Neil Kowall, MD), P50 AG008702 (PI Scott Small, MD), P50 AG025688 (PI Allan Levey, MD, PhD), P50 AG047266 (PI Todd Golde, MD, PhD), P30 AG010133 (PI Andrew Saykin, PsyD), P50 AG005146 (PI Marilyn Albert, PhD), P50 AG005134 (PI Bradley Hyman, MD, PhD), P50 AG016574 (PI Ronald Petersen, MD, PhD), P50 AG005138 (PI Mary Sano, PhD), P30 AG008051 (PI Steven Ferris, PhD), P30 AG013854 (PI M. Marsel Mesulam, MD), P30 AG008017 (PI Jeffrey Kaye, MD), P30 AG010161 (PI David Bennett, MD), P50 AG047366 (PI Victor Henderson, MD, MS), P30 AG010129 (PI Charles DeCarli, MD), P50 AG016573 (PI Frank LaFerla, PhD), P50 AG016570 (PI Marie-Francoise Chesselet, MD, PhD), P50 AG005131 (PI Douglas Galasko, MD), P50 AG023501 (PI Bruce Miller, MD), P30 AG035982 (PI Russell Swerdlow, MD), P30 AG028383 (PI Linda Van Eldik, PhD), P30 AG010124 (PI John Trojanowski, MD, PhD), P50 AG005133 (PI Oscar Lopez, MD), P50 AG005142 (PI Helena Chui, MD), P30 AG012300 (PI Roger Rosenberg, MD), P50 AG005136 (PI Thomas Montine, MD, PhD), P50 AG033514 (PI Sanjay Asthana, MD, FRCP), P50 AG005681 (PI John Morris, MD), and P50 AG047270 (PI Stephen Strittmatter, MD, PhD). We thank Dr Kukull and staff at NACC for their assistance.
References
- 1.Schneider LS, Mangialasche F, Andreasen N, et al. Clinical trials and late-stage drug development for Alzheimer’s disease: an appraisal from 1984 to 2014. J Intern Med. 2014 Mar;275(3):251–283. doi: 10.1111/joim.12191. [DOI] [PMC free article] [PubMed] [Google Scholar]
- 2.Yu L, Boyle P, Wilson RS, et al. A random change point model for cognitive decline in Alzheimer’s disease and mild cognitive impairment. Neuroepidemiology. 2012;39(2):73–83. doi: 10.1159/000339365. [DOI] [PMC free article] [PubMed] [Google Scholar]
- 3.Yu L, Boyle PA, Leurgans S, et al. Effect of common neuropathologies on progression of late life cognitive impairment. Neurobiol Aging. 2015 Jul;36(7):2225–2231. doi: 10.1016/j.neurobiolaging.2015.04.006. [DOI] [PMC free article] [PubMed] [Google Scholar]
- 4.Schwarz AJ, Yu P, Miller BB, et al. Regional profiles of the candidate tau PET ligand 18F-AV-1451 recapitulate key features of Braak histopathological stages. Brain : a journal of neurology. 2016 May;139(Pt 5):1539–1550. doi: 10.1093/brain/aww023. [DOI] [PubMed] [Google Scholar]
- 5.Johnson KA, Schultz A, Betensky RA, et al. Tau positron emission tomographic imaging in aging and early Alzheimer disease. Annals of neurology. 2016 Jan;79(1):110–119. doi: 10.1002/ana.24546. [DOI] [PMC free article] [PubMed] [Google Scholar]
- 6.Marquie M, Normandin MD, Vanderburg CR, et al. Validating novel tau positron emission tomography tracer [F-18]-AV-1451 (T807) on postmortem brain tissue. Annals of neurology. 2015 Nov;78(5):787–800. doi: 10.1002/ana.24517. [DOI] [PMC free article] [PubMed] [Google Scholar]
- 7.Betensky RA, Louis DN, Cairncross JG. Influence of unrecognized molecular heterogeneity on randomized clinical trials. J Clin Oncol. 2002 May 15;20(10):2495–2499. doi: 10.1200/JCO.2002.06.140. [DOI] [PubMed] [Google Scholar]
- 8.Beekly DL, Ramos EM, Lee WW, et al. The National Alzheimer’s Coordinating Center (NACC) database: the Uniform Data Set. Alzheimer Dis Assoc Disord. 2007 Jul-Sep;21(3):249–258. doi: 10.1097/WAD.0b013e318142774e. [DOI] [PubMed] [Google Scholar]
- 9.Morris JC, Weintraub S, Chui HC, et al. The Uniform Data Set (UDS): clinical and cognitive variables and descriptive data from Alzheimer Disease Centers. Alzheimer Dis Assoc Disord. 2006 Oct-Dec;20(4):210–216. doi: 10.1097/01.wad.0000213865.09806.92. [DOI] [PubMed] [Google Scholar]
- 10.Serrano-Pozo A, Qian J, Monsell SE, Frosch MP, Betensky RA, Hyman BT. Examination of the clinicopathologic continuum of Alzheimer disease in the autopsy cohort of the National Alzheimer Coordinating Center. J Neuropathol Exp Neurol. 2013 Dec;72(12):1182–1192. doi: 10.1097/NEN.0000000000000016. [DOI] [PMC free article] [PubMed] [Google Scholar]
- 11.Weintraub S, Salmon D, Mercaldo N, et al. The Alzheimer’s Disease Centers’ Uniform Data Set (UDS): the neuropsychologic test battery. Alzheimer Dis Assoc Disord. 2009 Apr-Jun;23(2):91–101. doi: 10.1097/WAD.0b013e318191c7dd. [DOI] [PMC free article] [PubMed] [Google Scholar]
- 12.Proust-Lima C, Sene M, Taylor JM, Jacqmin-Gadda H. Joint latent class models for longitudinal and time-to-event data: a review. Stat Methods Med Res. 2014 Feb;23(1):74–90. doi: 10.1177/0962280212445839. [DOI] [PMC free article] [PubMed] [Google Scholar]
- 13.Yu L, Boyle P, Schneider JA, et al. APOE epsilon4, Alzheimer’s disease pathology, cerebrovascular disease, and cognitive change over the years prior to death. Psychol Aging. 2013 Dec;28(4):1015–1023. doi: 10.1037/a0031642. [DOI] [PMC free article] [PubMed] [Google Scholar]
- 14.Wolz R, Schwarz AJ, Gray KR, Yu P, Hill DL, Alzheimer’s Disease Neuroimaging I Enrichment of clinical trials in MCI due to AD using markers of amyloid and neurodegeneration. Neurology. 2016 Sep 20;87(12):1235–1241. doi: 10.1212/WNL.0000000000003126. [DOI] [PMC free article] [PubMed] [Google Scholar]
- 15.Sevigny J, Suhy J, Chiao P, et al. Amyloid PET Screening for Enrichment of Early-Stage Alzheimer Disease Clinical Trials: Experience in a Phase 1b Clinical Trial. Alzheimer Dis Assoc Disord. 2016 Jan-Mar;30(1):1–7. doi: 10.1097/WAD.0000000000000144. [DOI] [PubMed] [Google Scholar]
- 16.Serrano-Pozo A, Qian J, Monsell SE, et al. Mild to moderate Alzheimer dementia with insufficient neuropathological changes. Annals of neurology. 2014 Apr;75(4):597–601. doi: 10.1002/ana.24125. [DOI] [PMC free article] [PubMed] [Google Scholar]
- 17.Hua X, Ching CR, Mezher A, et al. MRI-based brain atrophy rates in ADNI phase 2: acceleration and enrichment considerations for clinical trials. Neurobiol Aging. 2016 Jan;37:26–37. doi: 10.1016/j.neurobiolaging.2015.09.018. [DOI] [PMC free article] [PubMed] [Google Scholar]
- 18.Macklin E, Blacker D, Hyman B, Betensky R. Improved design of prodromal Alzheimer’s disease trials through cohort enrichment and surrogate endpoints. J Alzheimers Dis. 2013;36(3):475–486. doi: 10.3233/JAD-122212. [DOI] [PMC free article] [PubMed] [Google Scholar]
- 19.Kennedy RE, Cutter GR, Schneider LS. Effect of APOE genotype status on targeted clinical trials outcomes and efficiency in dementia and mild cognitive impairment resulting from Alzheimer’s disease. Alzheimers Dement. 2014 May;10(3):349–359. doi: 10.1016/j.jalz.2013.03.003. [DOI] [PMC free article] [PubMed] [Google Scholar]
- 20.Morris JC. The Clinical Dementia Rating (CDR): current version and scoring rules. Neurology. 1993;43(11):2412–2414. doi: 10.1212/wnl.43.11.2412-a. [DOI] [PubMed] [Google Scholar]
Associated Data
This section collects any data citations, data availability statements, or supplementary materials included in this article.