Significance
Highly selective monoclonal antibodies recognizing the extracellular 3D epitope of G protein-coupled receptors represent valuable tools for elucidating receptor function and localization in the cell and show promise for a range of therapeutic applications. Here we present the structure of a complex between the human serotonin 2B receptor, captured in an active-like state, and an antibody Fab fragment, bound to the extracellular side of the receptor. The structure uncovers the mechanisms of receptor activation and of extracellular receptor recognition by antibodies.
Keywords: GPCR, active state, antibody recognition, X-ray free-electron laser, serial femtosecond crystallography
Abstract
Monoclonal antibodies provide an attractive alternative to small-molecule therapies for a wide range of diseases. Given the importance of G protein-coupled receptors (GPCRs) as pharmaceutical targets, there has been an immense interest in developing therapeutic monoclonal antibodies that act on GPCRs. Here we present the 3.0-Å resolution structure of a complex between the human 5-hydroxytryptamine 2B (5-HT2B) receptor and an antibody Fab fragment bound to the extracellular side of the receptor, determined by serial femtosecond crystallography with an X-ray free-electron laser. The antibody binds to a 3D epitope of the receptor that includes all three extracellular loops. The 5-HT2B receptor is captured in a well-defined active-like state, most likely stabilized by the crystal lattice. The structure of the complex sheds light on the mechanism of selectivity in extracellular recognition of GPCRs by monoclonal antibodies.
Antibodies comprise hypervariable domains that evolve in response to antigenic stimuli, making them capable of selectively binding virtually any macromolecule. Thanks to their potentially high affinity, selectivity, long duration of action, and engineered ability to penetrate the blood–brain barrier, monoclonal antibodies (mAbs) provide an attractive alternative to small-molecule therapies (1). G protein-coupled receptors (GPCRs) represent highly attractive targets for therapeutic mAbs because of their involvement in signal transduction, associated with many important diseases, and their localization in the cell plasma membrane (2). Production of mAbs against GPCRs, however, is a challenging task because of difficulties in obtaining sufficient quantities of solubilized, purified, and functional antigen. The most abundant class A GPCRs are characterized by very small solvent-exposed domains, making production of high affinity, selective mAbs even more difficult (3–7). Furthermore, antibodies can recognize GPCRs in different functional states, depending on the presence of agonists or antagonists (8). Some mAbs can also recognize specific receptor conformations independent of ligand presence, and there is a potential for identification of “biased” mAbs that can selectively guide receptor activity to specific signaling pathways (3, 9). The first anti-GPCR therapeutic mAb, mogamulizumab (KW-0761, POTELIGEO), targeting the CCR4 receptor, was approved in 2012 in Japan for the treatment of relapsed or refractory adult T-cell leukemia-lymphoma (10). Currently, there are more than a dozen mAbs targeting extracellular sites of GPCRs in different stages of clinical trials for the treatment of HIV, inflammation and immune disorders, atherosclerosis, cancer, and other major chronic diseases (11, 12).
To gain insight into the molecular basis of extracellular recognition of GPCRs by mAbs, we crystallized a complex between the human 5-hydroxytryptamine 2B (5-HT2B) receptor bound to the agonist ergotamine (ERG) and a selective antibody Fab fragment, and solved its structure by serial femtosecond crystallography (SFX) with an X-ray free-electron laser (XFEL). Given that all previous structural information on GPCR recognition is limited to Fabs/nanobodies bound to the intracellular side of the receptors (13–17), this work provides unprecedented molecular insights into the 3D antibody-binding extracellular epitope of the receptor. Moreover, whereas previous 5-HT2B/ERG structures revealed conformational characteristics of an intermediate receptor activation state (18, 19), the 5-HT2B/ERG-Fab structure captures the receptor in a distinct active-like state, which shows extensive activation-related changes throughout the receptor manifested in triggered “microswitches” and concerted movements of helices VI and VII.
Results
Antibody Binding Characterization.
The monoclonal antibody P2C2-IgG raised against human 5-HT2B receptor bound to ERG was received as a gift from Bird Rock Bio, San Diego, CA. P2C2 heavy and light chains were subcloned to enable expression of a P2C2–Fab fragment in insect cells. ELISA experiments confirmed that the purified P2C2–Fab binds selectively to the extracellular epitope of the human 5-HT2B receptor, both in the presence (pKd = −8.50 ± 0.26) and absence (pKd = −8.86 ± 0.28) of ERG (Fig. S1A).
Fig. S1.
P2C2–Fab antibody fragment characterization. (A) Binding of P2C2–Fab to 5-HT2B receptor as measured by ELISA in the presence and absence (apo) of ERG. Data points are shown as mean ± SEM of three experiments performed in triplicate. (B) Effect of point mutations on P2C2–Fab binding as measured by ELISA. Data points are shown as mean ± SEM of three experiments (two experiments for P202A mutant) performed in triplicate. (C) Flow cytometry data with P2C2–Fab and TRex CHO stable cell line expressing wild-type 5-HT2B (green) and Δ44–5-HT2B (blue) receptor. Uninduced cells (gray) did not show any binding to P2C2–Fab. (D) No nonspecific binding of secondary antibody to cells expressing the receptor was observed. (E) No binding of P2C2–Fab to the cells expressing 5-HT2C was observed. (F) Expression of 5-HT2C was confirmed by using an anti-5-HT2C antibody (Abcam).
Structure of the 5-HT2B/ERG-Fab Complex.
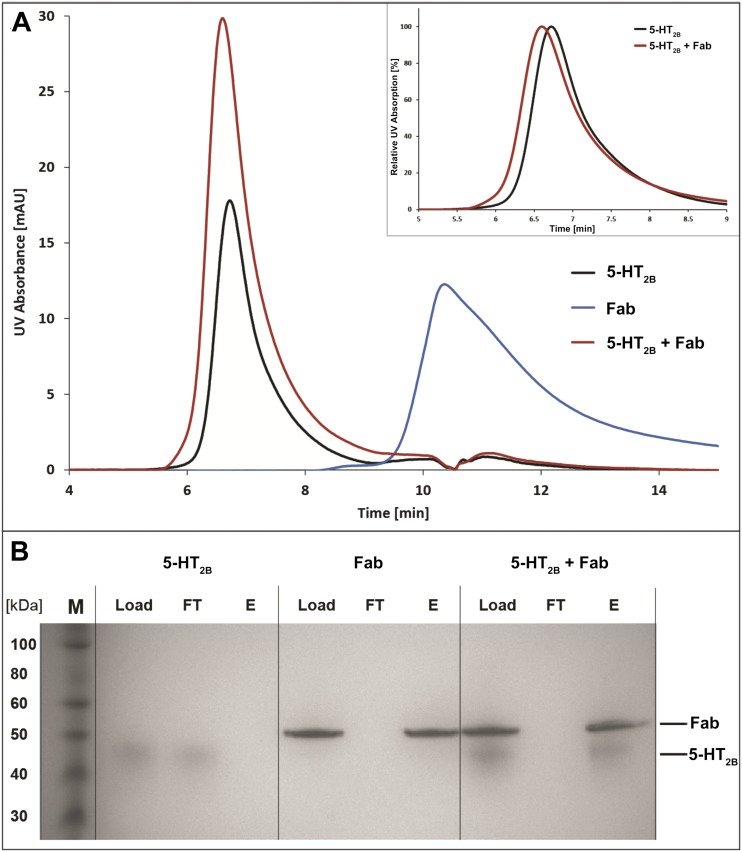
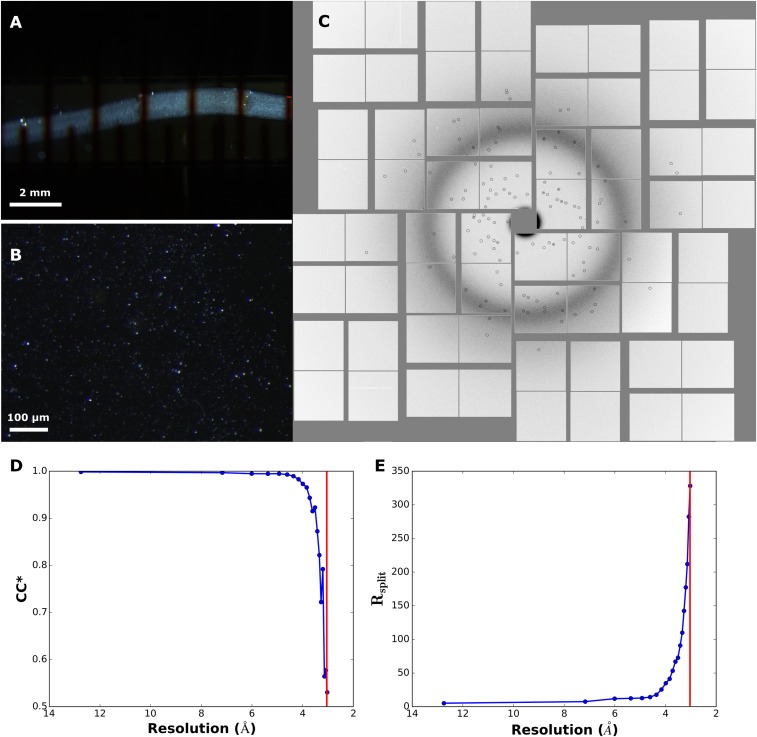
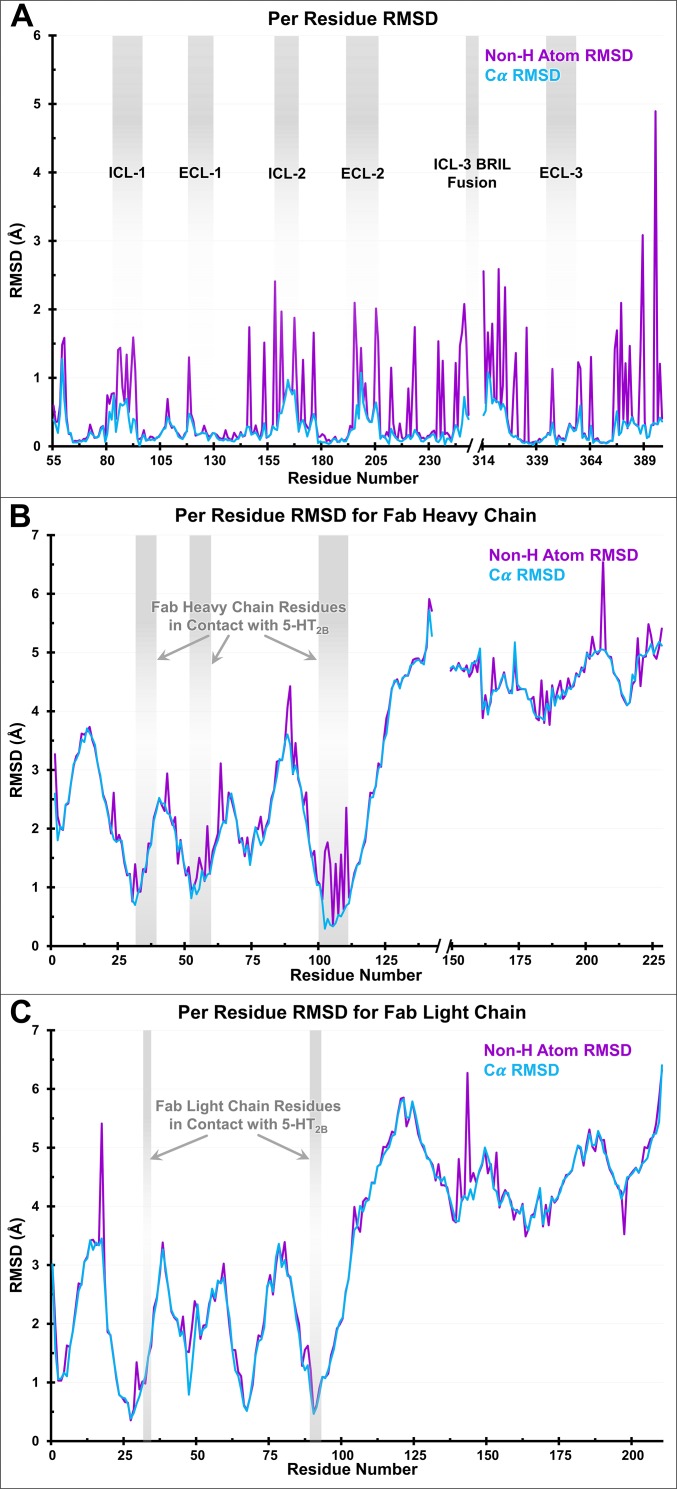
For structural studies, we used the same engineered construct of the human 5-HT2B receptor as the one previously used to obtain 5-HT2B/ERG structures (18, 19). Size-exclusion chromatography (SEC) and pull-down assays confirmed formation of a complex between purified receptor and antibody (Fig. S2). The 5-HT2B/ERG-Fab structure was determined at 3.0-Å resolution (Fig. 1, Fig. S3, and Table S1). The complex was crystallized in lipidic cubic phase (LCP) (Fig. S3 A and B) in a P21 space group, with two complexes (chains ABC and DEF) per asymmetric unit (Fig. S4). Because both structures are nearly identical (rmsdCα ∼0.3 Å for the receptor and ∼1.3 Å for the whole complex) (Fig. S5), we hereafter focus on the description of the ABC complex.
Fig. S2.
Analysis of 5-HT2B/ERG-Fab complex formation using aSEC and a pull-down assay. (A) aSEC UV absorption traces of 5 µg of 5-HT2B/ERG (black), 5 µg Fab (blue), or 5 µg 5-HT2B/ERG incubated with 5 µg Fab for 1 h on ice (red). Upon binding to 5-HT2B/ERG, no more free Fab is detected. Complex formation is confirmed according to a nearly doubled peak volume of the receptor species and a shift to shorter retention time indicating an increase in molecular weight (Inset). (B) SDS/PAGE analysis of pull-down experiments using 1 µg of 5-HT2B/ERG, 1 µg of His-tagged Fab, or 1 µg of 5-HT2B/ERG mixed with His-tagged Fab. All samples were incubated on ice for 1 h, bound to TALON resin, and eluted using 20 mM Hepes pH 7.4, 500 mM NaCl, 0.05/0.01% DDM/CHS. Loaded material (Load), flow through (FT), and eluate (E) were analyzed using SDS/PAGE. Analysis confirms 5-HT2B/ERG-Fab complex formation as His-tagged Fab can capture 5-HT2B/ERG which otherwise does not bind the resin.
Fig. 1.
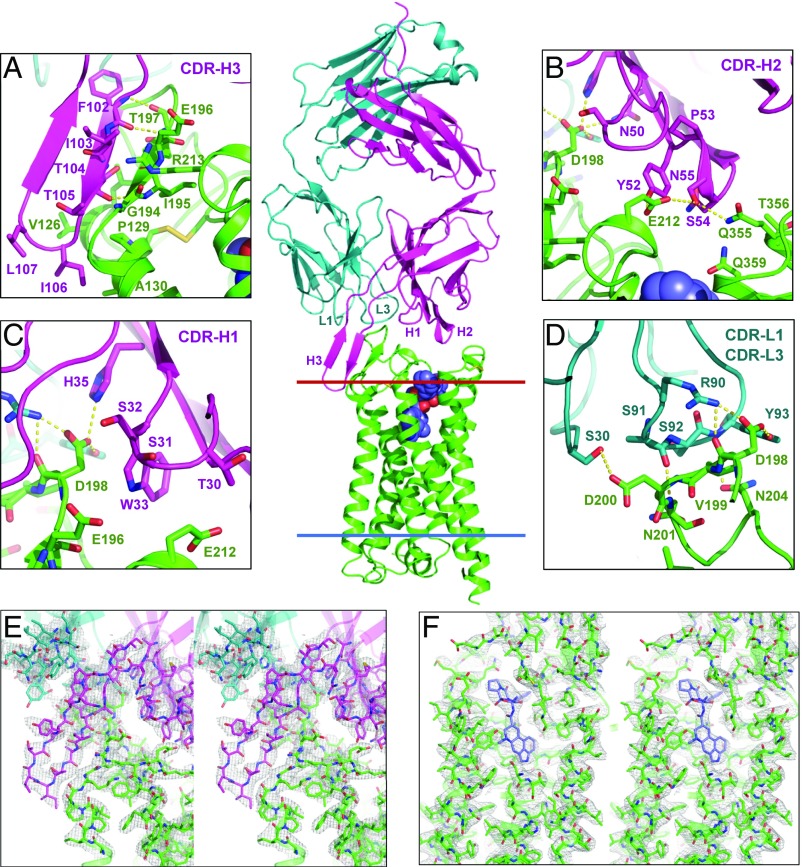
Structure of the complex between 5-HT2B/ERG and an antibody Fab fragment. Overall view of the complex with 5-HT2B (green), Fab light chain (teal), and Fab heavy chain (magenta). Red and blue lines indicate the extracellular and intracellular membrane boundaries, respectively, as defined in the Orientation of Proteins in Membranes database (opm.phar.umich.edu/). The ligand ERG is shown as spheres with carbon atoms colored blue. Zoom-in panels show details of interactions between the receptor and (A) CDR-H3, (B) CDR-H2, (C) CDR-H1, and (D) CDR-L1 and CDR-L3 of the P2C2–Fab. Hydrogen bonds and salt bridges are shown as yellow dash lines. Stereo views of 2mFo–DFc electron density maps contoured at 1 σ (gray mesh) for the interaction region between CDR-H3 of Fab and ECL2 of 5-HT2B (E) and for the ligand-binding pocket (F).
Fig. S3.
Crystallization of 5-HT2B/ERG-Fab and crystallographic data collection. (A) Microcrystals inside LCP string in a gas-tight Hamilton syringe viewed under cross-polarized light. (B) Microcrystals in LCP sandwiched between two glass slides viewed under cross-polarized light. (C) Example of a diffraction image on Cornell-SLAC Pixel Array Detector. Diffraction spots identified by Cheetah (33) are circled. (D) Dependence of correlation coefficient (CC*) on resolution. (E) Dependence of Rsplit on resolution. Data cut-off at 3.0 Å is shown as a red line in D and E.
Table S1.
Data collection and refinement statistics
| Data collection and refinement | Statistics |
| Data collection | |
| Space group | P21 |
| Unit cell parameters a,b,c (Å), α, β, γ (°) | 71.2, 118.8, 145.6, 90, 90.5, 90 |
| No. of collected images | 1,877,040 |
| No. of hits/indexed images | 193,328/52,291 |
| No. of total/unique reflections | 150,927,26/48,643 |
| Resolution range (Å) | 34.7–3.0 (3.1–3.0) |
| Mean I/σ(I) | 4.3 (0.4) |
| Completeness (%) | 100 (100) |
| Multiplicity | 310.3 (120.2) |
| Rsplit (%) | 19.8 (305.0) |
| CC* | 0.997 (0.55) |
| Refinement | |
| No. of reflections/test set | 48,606/2,259 |
| Rwork/Rfree | 0.227/0.247 |
| No. of atoms | |
| Protein | 12,298 |
| Ligand | 86 |
| Wilson B (Å2) | 90.3 |
| Mean overall B (Å2) | 106.1 |
| Protein | 106.1 |
| Ligand | 94.3 |
| R.m.s. deviations | |
| Bond lengths (Å2) | 0.005 |
| Bond angles (°) | 0.76 |
| Clash Score | 2.49 |
| Cβ outliers (%) | 0 |
| Rotamer outliers (%) | 1.4 |
| Ramanchandran plot statistics (%) | |
| Favored regions | 95.3 |
| Allowed regions | 4.7 |
| Disallowed regions | 0 |
Fig. S4.
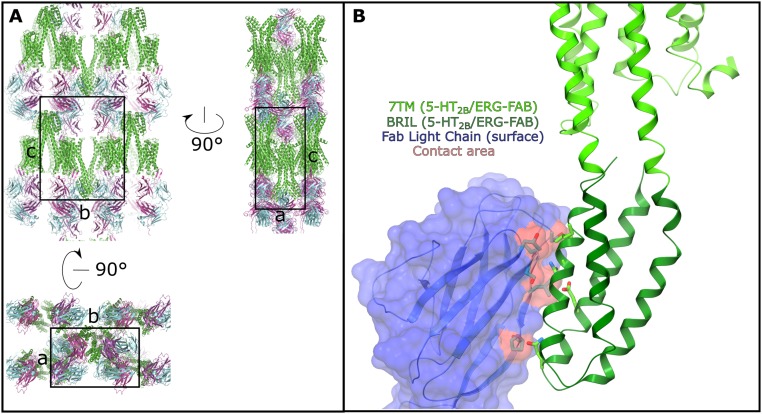
(A) Crystal packing shown in three orthogonal orientations. 5-HT2B is shown as green cartoon, the light chain of Fab is shown in blue and the heavy chain is shown in magenta. The unit cell is shown as a black box. (B) Crystal contacts between BRIL and the constant domain of the light chain of P2C2–Fab. The 7TM part of the receptor is shown in light green, BRIL is shown in dark green and the light chain of Fab is shown as blue cartoon and surface representations. The contact area on P2C2–Fab (∼288 Å2) is highlighted in red and the interacting residues are shown as sticks. Most interactions between P2C2–Fab and BRIL are hydrophobic and nonspecific.
Fig. S5.
Conformational differences between complexes ABC and DEF for (A) receptor, (B) Fab heavy chain, (C) Fab light chain. Deviations in 5-HT2B receptor do not exceed 1.5 Å for the backbone Cα atoms, and 2.5 Å for all nonhydrogen atoms, except for a few residues. Deviations in Fab chains were measured for the ABC and DEF complexes superimposed using the receptor only. Cα rmsd values for Fab residues contacting with the receptor are within 1 Å. Larger rmsd values in other Fab parts are because of an ∼4° tilt between Fabs in ABC and DEF complexes.
Specific Interactions Between Fab and 5-HT2B.
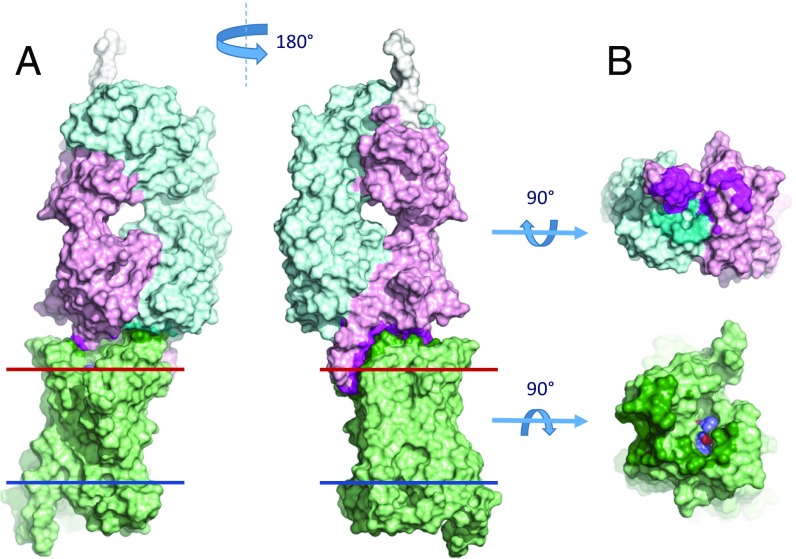
The Fab forms extensive interactions with all three extracellular loops (ECLs) of the receptor with a total buried surface of 945 Å2 (Figs. 1 and 2 and Tables S2 and S3). On the Fab side, interactions involve all three complementarity-determining regions (CDR) of the heavy chain (CDR-H1, CDR-H2, and CDR-H3), as well as CDR-L1 and CDR-L3 of the light chain. The longest CDR-H3 loop (21 residues) adopts the shape of a β-hairpin that extensively interacts with a part of ECL2, together forming a three-stranded β-sheet (Fig. 1A). Interestingly, the tip of CDR-H3 extends toward the lipid membrane, likely anchoring its hydrophobic residues Ile106 and Leu107 in the membrane near helices III and IV of the receptor. CDR-H2 interacts mostly with ECL2 and ECL3. Asn50 (CDR-H2) forms a hydrogen bond with Asp198ECL2, Tyr52 (CDR-H2) with Glu212ECL2, and Ser54 (CDR-H2) with Gln3557.28 (Fig. 1B). CDR-H1 interacts only with ECL2 and has the least number of contacts. Thr30 (CDR-H1) makes a hydrogen bond with Glu212ECL2, and Trp33 (CDR-H1) makes a nonpolar contact with Asp198ECL2 (Fig. 1C). The Fab light chain, specifically CDR-L3, also forms multiple hydrogen bonds and salt bridges with the receptor (Fig. 1D). On the receptor side, one of the key residues for Fab recognition is Asp198ECL2 (Fig. 1 B–D). Its acidic side chain protrudes into the interface between the light and heavy chains of Fab, interacting with both of them. Asp198ECL2 forms a salt bridge with Arg90 (CDR-L3), and hydrogen bonds with Tyr93 (CDR-L3), Asn50 (CDR-H2), and His35 (CDR-H1), as well as makes a hydrophobic contact with Trp33 (CDR-H1). Mutational studies using ELISA further confirmed the importance of Asp198ECL2 for binding of P2C2–Fab, which showed at least three orders-of-magnitude decreased affinity of Fab binding to the D198N mutant (Fig. S1B).
Fig. 2.
Overall structure of the 5-HT2B/ERG-Fab complex and the binding interface between Fab and 5-HT2B/ERG. (A) Two side views of the 5-HT2B/ERG-Fab complex in a surface representation. Red and blue lines correspond to the extracellular and intracellular membrane boundaries respectively, as defined in the Orientation of Proteins in Membranes database (opm.phar.umich.edu/). (B) Interacting surfaces of 5-HT2B/ERG and Fab. 5-HT2B receptor is shown in light green, ERG is shown as spheres with blue carbons, Fab heavy chain is in light magenta, Fab light chain is in light cyan. Interacting residues are highlighted in bold colors.
Table S2.
Interactions between the 5-HT2B receptor and Fab chains: Complex composed of chains A, B, and C
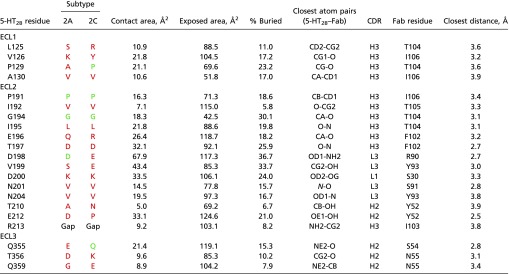 |
For each receptor residue only the closest interaction is shown. Residues in 2A and 2C subtypes identical to residues in 2B are colored green, different residues are colored red.
Table S3.
Interactions between the 5-HT2B receptor and Fab chains: Complex composed of chains D, E, and F
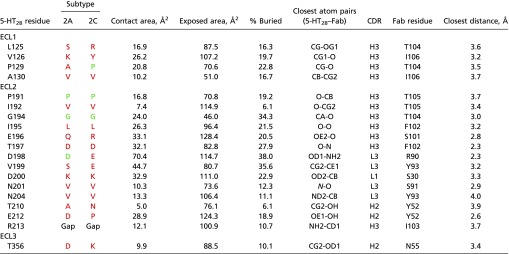 |
For each receptor residue only the closest interaction is shown. Residues in 2A and 2C subtypes identical to residues in 2B are colored green, different residues are colored red.
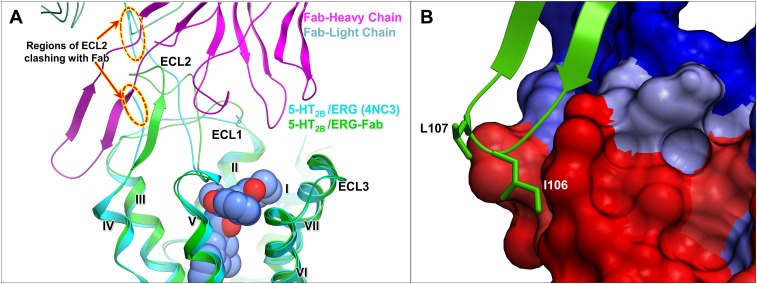
Strong interactions between ECL2 of the 5-HT2B receptor and the Fab lead to a distinct ECL2 conformation, compared with those previously observed in the 5-HT2B/ERG and 5-HT2B/LSD structures (20) (Fig. S6A). Because ECL2 is sandwiched between the transmembrane helical bundle and Fab, it adopts a more ordered conformation in the 5-HT2B/ERG-Fab structure with better-defined electron density compared with ECL2 in the 5-HT2B/ERG structure. Because ECL2 of the 5-HT2B receptor has previously been shown to play a critical role in ligand binding and receptor signaling (20), these molecular insights could be used to guide the development of pharmacological antibodies.
Fig. S6.
(A) Comparison of ECL2 conformation between structures of 5-HT2B/ERG (4NC3) and 5-HT2B/ERG-Fab. ECL2 adopts a more ordered conformation in the 5-HT2B/ERG-Fab structure because of extensive interactions with Fab. (B) Hydrophobic residues I106 and L107 from CDR-H3 loop of P2C2–Fab are apparently anchored in the hydrophobic lipidic bilayer. Predictions by the MemprotMD server (memprotmd.bioch.ox.ac.uk/) show receptor residues that have preferable contact with aliphatic tails of lipids in red, and those residues that lack such contacts in blue.
Fab Binding Selectivity Analysis.
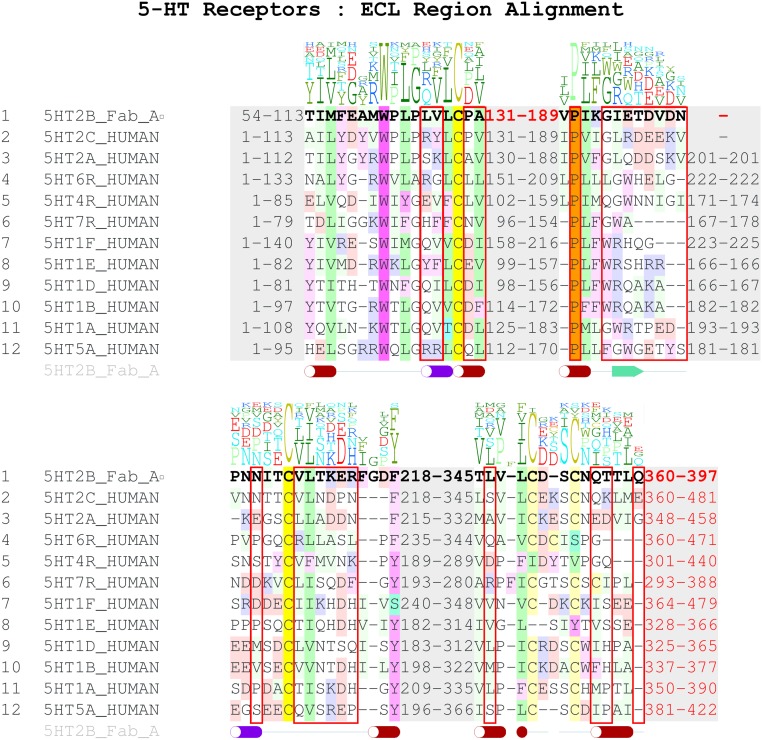
A structure-based alignment of 5-HT2B receptor with the closest subfamily members, 5-HT2A and 5-HT2C (Fig. S7 and Tables S2 and S3), revealed that although the overall conservation of the extracellular region is relatively high, most receptor residues involved in interactions with the P2C2–Fab are unique for the 5-HT2B subtype. Moreover, variations in the amino acid length of ECL2 and ECL3 and a unique Pro202ECL2 residue suggest substantial deviations in the backbone conformation of the extracellular region between 5-HT2B and the other two subfamily members. To confirm the importance of Pro202ECL2 for the receptor–Fab interaction, we generated two point mutants (P202A, P202W) to destabilize the ELC2 conformation. Both mutants substantially decreased P2C2–Fab binding affinity, with P202W exhibiting a stronger effect, as expected (Fig. S1B). A broader analysis of the whole 5-HT family shows even more dramatic variability in the ECL length and sequence (Fig. S7). These results provide a structural basis for P2C2’s selectivity for the 5-HT2B receptor (Fig. S1 C–F), and suggest a path toward the rational design of receptor-specific immunological tools for the study of GPCRs.
Fig. S7.
Sequence alignment of 5-HT subfamily members. Residues shown are near or at extracellular loop with an emphasis on residues (highlighted in red boxes) in contact with Fab domains.
Active-Like 5-HT2B Receptor Conformation.
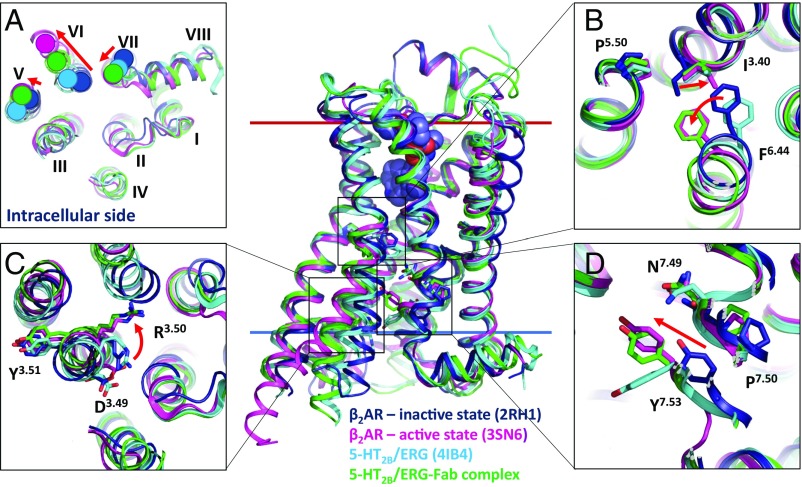
The current crystal structure of the 5-HT2B/ERG-Fab complex captures the receptor in a distinct active-like conformational state, compared with the previously published structures of 5-HT2B/ERG (18, 19) (Fig. 3). The common activation mechanism of class A GPCRs involves an outward tilt of helix VI and an inward movement of helix VII on the intracellular side of the receptor, forming a cleft to accommodate binding of G protein or β-arrestin transducers (13, 21–23). The previous structure of 5-HT2B/ERG (PDB ID code 4NC3) shows helix VI in a partially activated state with an outward shift of ∼3 Å, compared with the inactive structure of β2AR (PDB ID code 2RH1). Using the same comparison, the current structure of 5-HT2B/ERG-Fab reveals a much larger 6.7-Å shift of helix VI at the residue Glu3196.30, which is the most pronounced motion of helix VI observed in all active-like GPCR structures without intracellular binding partners (24). Concomitantly, helix V follows the motion by shifting about 2.9 Å, as measured at Leu2445.65 (Fig. 3A). Helix VII is also known to undergo rearrangements during activation. In 5-HT2B/ERG-Fab, we see a similar inward movement and distortion in the conserved NPxxY motif of helix VII, with an even greater inward shift in the key Tyr3807.53 residue than in the previous 5-HT2B/ERG structure.
Fig. 3.
Receptor activation-related features of the 5-HT2B/ERG-Fab complex. Superposition of β2AR-Gs active state (magenta; PDB ID code 3SN6), β2AR inactive state (dark blue; PDB ID code 2RH1), 5-HT2B/ERG (light blue; PDB ID code 4IB4), and 5-HT2B/ERG-Fab complex (green). (A) View from the intracellular side. (B) PIF motif. (C) D(E)RY motif. (D) NPxxY motif. Major activation-related rearrangements observed in β2AR are shown as red arrows.
Upon receptor activation, the large-scale helical rearrangements are accompanied by conformational changes in conserved microswitches (25). The most important microswitches in class A GPCRs are the PIF, D(E)RY, and NPxxY motifs. The PIF motif is one of the central conserved microswitches that are present in most aminergic receptors, including 5-HT2B (26). Activation of this microswitch includes an inward shift of Pro5.50, a rotamer switch in Ile3.40, and a side-chain rotation of the Phe6.44 residue (17, 27). Although 5-HT2B/ERG showed an active-like conformation of the Pro2295.50 and Ile1433.40 residues, Phe3336.44 was found to be in an inactive conformation. In the present structure, all three PIF residues, including Phe3336.44, are in a well-defined active-like state similar to the one found in the fully active β2AR-Gs complex (Fig. 3B).
In the ground inactive state of GPCRs, the Arg3.50 side chain of the D(E)RY motif forms a salt bridge with the neighboring Asp3.49. The salt bridge also stays intact in most GPCR structures bound to agonists and captured in partially activated states. Upon full receptor activation, however, the Asp3.49–Arg3.50 salt bridge breaks and Arg3.50 adopts an extended conformation ready for interactions with the C-terminal helix of the Gα subunit or with the finger loop of arrestin. The 5-HT2B/ERG-Fab structure reveals a broken salt bridge and an extended conformation of the Arg3.50 side chain, suggesting that the D(E)RY switch in our structure is fully activated (Fig. 3C).
The NPxxY motif is located on the intracellular side of helix VII. Tyr7.53, which is a part of this motif, is a highly conserved residue that is believed to serve as a major activation microswitch in class A GPCRs. In all of the inactive structures of GPCRs, this residue points to helices I, II, and VIII. Upon activation, the cytoplasmic part of helix VII moves further into the transmembrane receptor core along with a side-chain rotation of Tyr7.53, where it interacts with helices III and VI. The previous 5-HT2B/ERG structure showed an active-state conformation of the NPxxY motif backbone, similar to that found in active-like states of β2AR and the A2A adenosine receptor (21, 27). However, in contrast to all other active-state structures, the Tyr3807.53 side chain in the 5-HT2B/ERG structure adopted a different rotamer, with its tip pointed down toward the intracellular part of the protein. In the current 5-HT2B/ERG-Fab structure, such a downward-facing conformation of Tyr3807.53 would be blocked by the extended conformation of Arg3.50 of the DRY motif. Instead, the side chain of Tyr3807.53 in 5-HT2B/ERG-Fab points up toward the extracellular side, whereas the backbone of this residue is shifted a further 2-Å inward, similar to the fully activated β2AR-Gs structure (Fig. 3D). This observation suggests coordinated switching of both DRY and NPxxY motifs in the 5-HT2B/ERG-Fab structure, consistent with an active-like conformation of the 5-HT2B receptor.
Discussion
The approved cancer drug mogamulizumab (KW-0761, POTELIGEO) (10), as well as most other GPCR antibodies in clinical development, target either linear epitopes in long N-terminal regions of chemokine receptors or extracellular domains of nonclass A GPCRs. At the same time, the small size of the extracellular region of many class A GPCRs represents a special challenge for antibody discovery, as it may require recognition of a nonlinear structural epitope for high affinity and subtype selectivity. The structure of the P2C2–Fab bound to a prototypical class A serotonin receptor, 5-HT2B, described in this study, provides a structural template for high-affinity and high-selectivity recognition of such 3D epitopes in GPCRs. Moreover, molecular insights into binding of antibodies to the 5-HT2B receptor, a bona fide drug target in the prevention of valvular heart disease and primary pulmonary hypertension (28), could also provide an important first step in the generation of immunological therapies.
The recognition interface covers a larger part of the solvent-exposed extracellular region of the receptor, involving all three ECLs. ECLs are the most variable regions in GPCRs, and the vast majority (16 of 20) of the contact side chains are different between 5-HT2B and its closest subtypes, 5-HT2A and 5-HT2C, assuring high selectivity of recognition.
In addition to highly selective interactions, which are defined as those that include unique to the 5-HT2B receptor residues, the structure of the 5-HT2B/ERG-Fab complex revealed several nonspecific interactions, such as those involving only receptor backbone atoms, which may be common for other antibodies recognizing extracellular regions of class A GPCRs, and thus can be used for antibody design. One such major interaction is the formation of a three-stranded β-sheet with a network of strong backbone–backbone contacts between CDR-H3 and ECL2. Extended loops or β-hairpin conformations are common for many class A GPCRs, and they can form potential common sites for initial antibody recognition. Another interesting feature of the P2C2–Fab interaction is the apparent membrane anchoring of the two hydrophobic side chains at the tip of the CDR-H3 loop. Whereas I106 forms hydrophobic contacts with P1914.61 and A1303.27, L107 has no contacts with the receptor, and it is likely to interact nonspecifically only with lipid molecules (Fig. S6B). It is possible that membrane anchoring of these residues precedes the full engagement of the Fab with 5-HT2B, thus reducing the diffusion search from 3D bulk solvent to 2D membrane surface.
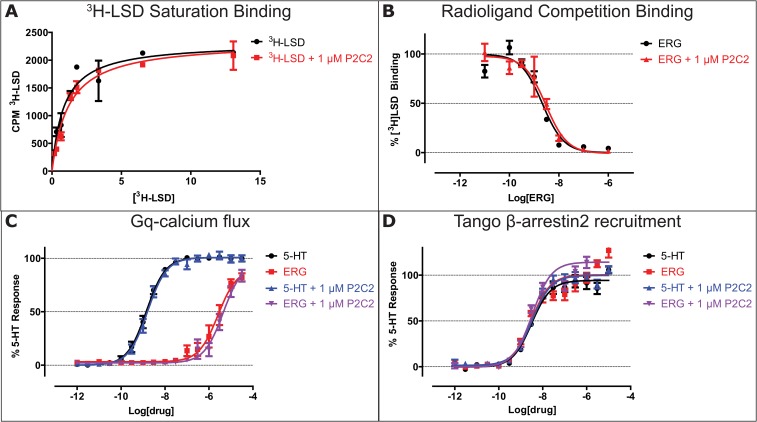
Unlike the previously solved structures of the 5HT2B/ERG complex, which were captured in a partially activated state (18, 19), the 5-HT2B/ERG-Fab structure shows a fully active-like conformation of the receptor, with all attributes of the active state, including very pronounced dislocations of helices VI and VII and activation of all conserved microswitches. Analysis of the Fab contacts, however, does not suggest any substantial conformational changes in the extracellular parts of the 5-HT2B transmembrane helices compared with the 5HT2B/ERG structures. The largest observed shift involves a ∼1.5-Å outward displacement of the helix V tip, which is not consistent with the inward shift of this helix observed in some other active structures of related aminergic receptors, such as β2AR (13, 25). Accordingly, P2C2–Fab did not affect ligand binding (LSD and ERG), Gq-induced calcium flux, or β-arrestin recruitment (Fig. S8), suggesting that the active-like receptor conformation captured in the crystal structure was likely stabilized by the crystal packing rather than by direct receptor–Fab interactions.
Fig. S8.
P2C2–Fab has no effect on radioligand binding or signaling at the 5-HT2B receptor. (A) One micromolar P2C2–Fab does not affect LSD’s KD or the total number of LSD binding sites as probed by [3H]-LSD saturation binding. Data shown is a representative of three independent experiments (n = 3) done in duplicates. Average pKD for 3H-LSD at 5-HT2B is −9.06 ± 0.03 and −8.94 ± 0.03, in the absence and presence of 1 µM P2C2–Fab, respectively. (B) One micromolar P2C2 does not affect the affinity of ERG as measured by displacing [3H]-LSD from 5-HT2B. Data shown is the average from three independent experiments (n = 3) done in duplicates. Average pKi for ERG at 5-HT2BR is −8.94 ± 0.06 and −8.83 ± 0.22 in the absence and presence of 1 µM P2C2–Fab, respectively. (C) One micromolar P2C2–Fab does not affect potency or efficacy of 5-HT– or ERG-mediated Gq-calcium mobilization in 5-HT2B expressing HEK293 cells. Potencies in pEC50 are 5-HT = −8.85 ± 0.03, 5-HT + 1 µM P2C2–Fab = −8.79 ± 0.04, ERG = −5.59 ± 0.09, ERG + 1 µM P2C2–Fab = −5.53 ± 0.08. (D) One micromolar P2C2–Fab does not affect potency or efficacy of 5-HT– or ERG-mediated β-arrestin2 recruitment in 5-HT2BR expressing HTLA cells. Potencies in pEC50 are 5-HT = −8.51 ± 0.06, 5-HT + 1 µM P2C2–Fab = −8.48 ± 0.05, ERG = –8.52 ± 0.08, ERG + 1 µM P2C2–Fab = −8.48 ± 0.06. All functional data represent average of three independent experiments (n = 3) performed as triplicates.
In conclusion, this work represents the structure of an antibody selectively bound to the extracellular surface of a GPCR, shedding light on the structural basis of receptor recognition. Highly selective mAbs directed against extracellular epitopes of GPCRs are of tremendous scientific interest for studying receptor localization, structure, and function, as well as providing a platform for the development of therapeutic applications (11, 12).
Materials and Methods
Expression and Purification of P2C2–Fab.
P2C2–Fab was obtained by Fab phage display of libraries derived from immunized mice using Bird Rock Bio’s proprietary iCAPS technology. The antibody uses an IGKV4/5 light chain and a VH1 heavy chain.
P2C2–Fab was expressed in Spodoptera frugiperda (Sf9) insect cells (Expression Systems). Fab heavy and light chains were cloned into a modified bicistronic version of the pFastBac vector (Wilson laboratory, The Scripps Research Institute). The expression cassette contained a honey bee melittin signal sequence at the N terminus of the light chain, and a gp67 signal sequence at the N terminus and His-tag at the C terminus of the heavy chain of the Fab.
The construct was expressed in Sf9 cells using the Bac-to-Bac Baculovirus Expression System. Sf9 cells at density of 2–3 × 10⁶ cells/mL were infected with P1 virus at a multiplicity of infection of 3. Cell culture supernatant was harvested 48 h postinfection by centrifugation, filtered using a 0.2-μm filter, and used immediately for Fab purification. His-tagged Fab was captured from supernatant using TALON IMAC resin (Clontech) for 3 h at 4 °C. TALON resin was washed with 20 mM Tris, 100 mM NaCl, 10 mM imidazole, pH 7.5 buffer, and Fab eluted from the resin using the same buffer containing 250 mM imidazole. Purified Fab was buffer exchanged into 50 mM Hepes, 50 mM NaCl, pH 7.5 using a PD-10 column, and purified on a HiTrap SP HP column (GE Healthcare Life Sciences) using a linear NaCl gradient. Eluted fractions were analyzed by SDS/PAGE, pooled, concentrated, and further purified on a Superdex75 column. Fab-containing fractions were pooled and concentrated using a 30-KDa cut-off concentrator for binding assays and crystallization trials, as described below.
Receptor Expression and Purification.
The 5-HT2B expression construct was codon-optimized, synthesized by DNA2.0, and subcloned into a modified pFastBac1 vector (Invitrogen) through 5′AscI and 3′FseI restriction sites. Thermostabilized apocytochrome b562 RIL (BRIL) from Escherichia coli (M7W, H102I, R106L) was inserted into ICL3 replacing the original residues Tyr249-Val313. N-terminal residues 1–35 and C-terminal residues 406–481 were truncated from the original receptor gene. Additionally, a thermostabilizing M1443.41W mutation was introduced. The pFastBac vector contained an expression cassette with a hemagglutinin (HA) signal sequence followed by a FLAG tag at the N terminus, and a PreScission protease site followed by a 10× His tag at the C terminus.
The 5-HT2B receptor expression and purification was performed as described previously (18). In brief, the virus production and protein expression were performed using Bac-to-Bac Baculovirus Expression System (Invitrogen) in Sf9 insect cells. Expression of the 5-HT2B receptor was carried out by infection of Sf9 cells at a cell density of 2–3 × 10⁶ cells/mL, with P2 virus at a multiplicity of infection of 5. Insect cells were harvested by centrifugation 48 h after infection.
Insect cells were disrupted by thawing frozen cell pellets in a hypotonic buffer. Extensive washing of the isolated membranes was performed using hypertonic buffer containing 1 M NaCl to remove membrane-associated proteins. Purified membranes were resuspended in buffer containing 10 mM Hepes, pH 7.5, 10 mM MgCl2, 20 mM KCl, 150 mM NaCl, 100 µM ERG (Sigma), 2 mg/mL iodoacetamide, and EDTA-free complete protease inhibitor mixture tablets (Roche), and incubated at room temperature for 1 h. Membranes were then solubilized in 10 mM Hepes, pH 7.5, 150 mM NaCl, 1% (wt/vol) n-dodecyl-β-d-maltopyranoside (DDM, Anatrace), 0.2% (wt/vol) cholesteryl hemisuccinate (CHS, Sigma), 50 µM ERG, and EDTA-free complete protease inhibitor mixture tablets (Roche) for 2 h at 4 °C. Cell debris were removed by ultracentrifugation. Protein was bound to TALON IMAC resin (Clontech) overnight at 4 °C in the presence of 20 mM imidazole and 800 mM NaCl. After incubation, the resin was then washed with 10 column volumes (CV) of Wash Buffer I [50 mM Hepes, pH 7.5, 800 mM NaCl, 0.1% (wt/vol) DDM, 0.02% (wt/vol) CHS, 20 mM imidazole, 10% (vol/vol) glycerol, and 50 µM ERG], followed by 5 CV of Wash Buffer II [50 mM Hepes, pH 7.5, 150 mM NaCl, 0.05% (wt/vol) DDM, 0.01% (wt/vol) CHS, 10% (vol/vol) glycerol, and 50 µM ERG]. Protein was eluted in 5 CV of Wash Buffer II + 250 mM imidazole and concentrated to 0.5 mL. Imidazole was removed using desalting via PD MiniTrap G-25 columns (GE Healthcare). Removal of the C-terminal 10× His-tag was performed overnight by addition of His-tagged PreScission protease (homemade). Protease, cleaved His-tags, and uncleaved protein were removed by the reverse IMAC.
Characterization of the Fab–Receptor Complex.
Binding of P2C2–Fab to human 5-HT2B receptor was confirmed by ELISA, Flow cytometry, analytical SEC (aSEC) and pull-down assays.
ELISA.
Crystallized construct of 5-HT2B was expressed in Sf9 cells and purified similarly to crystallization protocol. To compare binding of P2C2–Fab in the presence and absence (apo) of ERG, 5-HT2B at concentration 100 μg/mL was added to anti-FLAG M2 magnetic beads (Sigma) distributed into 96-well plates (Corning), resulting in 100 μL of protein solution per 25 μL of beads per well. Plates were incubated for 1 h at room temperature to ensure receptor binding. After incubation, the plates were washed with Wash Buffer (50 mM Hepes pH 7.5, 300 mM NaCl, 0.025% DDM, 0.005% CHS), blocked with 1% (wt/vol) BSA in Wash Buffer solution and incubated with increasing concentrations of purified P2C2–Fab for 1 h at room temperature. Plates were then washed with Wash Buffer two to three times and incubated with anti-human Fab-HRP secondary antibody (Sigma) for 1 h. Unbound antibody was removed by washing with Wash Buffer and 1-Step Ultra TMB (Thermo Fisher Scientific) added to develop the color. The reaction was stopped by adding 2 M sulfuric acid solution and absorbance in each well was measured at 450 nm. To determine the effect of point mutations on the binding of P2C2–Fab, we have used precoated anti-FLAG 96-well plates (Sigma) to bind 5-HT2B. The rest of the protocol was performed exactly as above. The data were analyzed in Graphpad Prism 5.0.
Flow cytometry.
Full-length or N-terminal truncated (44 residues) human 5-HT2B receptor was stably transfected into TRex CHO cells (Thermo Fisher Scientific). Binding of P2C2–Fab to the cell surface-expressed receptor was determined 24 h post tetracycline induction. Cells suspended in BSA stain buffer (BD Pharmingen) were incubated with P2C2–Fab on ice for 1 h, washed to remove unbound antibody, followed by incubation with goat anti-human IgG-FITC secondary antibody (Pierce) for 30 min on ice. The cells were again washed and fluorescence measured using a Guava cytometer.
aSEC.
To test the complex formation using SEC, the crystallized construct of 5-HT2B in complex with ERG purified in DDM/CHS detergent micelles was incubated with purified P2C2–Fab and incubated on ice for 2 h. The 5-HT2B/Erg, P2C2–Fab, and 5-HT2B/Erg + P2C2–Fab were then injected onto a SEC column (Sepax Technologies) using an HPLC system (Agilent Technologies) to check for 5-HT2B/ERG-Fab complex formation.
Pull down.
Fifty micrograms 5-HT2B/Erg; 50 µg His-tagged P2C2–Fab; and 50 µg 5-HT2B/Erg preincubated with 50 µg His-tagged P2C2–Fab were incubated with TALON resin for 2 h at 4 °C. Eluate and flow-through fractions were then analyzed by SDS/PAGE.
Radioligand saturation and competition assays.
Membranes from HEK293 cells expressing 5-HT2B receptor were used for all binding assays, and experiments were performed using standard binding buffer (50 mM Tris, 10 mM MgCl2, 0.1 mM EDTA, 0.1% BSA, 0.01% ascorbic acid, pH 7.4) for 4 h at 37 °C. For saturation binding, membranes preincubated for 30 min with or without 1 µM of P2C2–Fab were incubated with increasing concentrations of [3H]-LSD (Perkin-Elmer), and nonspecific binding was determined by addition of 10 µM methiothepin. For competition binding, membranes preincubated for 30 min with or without 1 µM of P2C2–Fab were incubated with 0.75 nM [3H]-LSD (Perkin-Elmer) and different dilutions of ERG. After incubation, plates were harvested by vacuum filtration onto 0.3% polyethyleneimine presoaked 96-well filter mats (Perkin-Elmer) using a 96-well Filtermate harvester, followed by three washes of cold wash buffer (50 mM Tris pH 7.4). Scintillation (Meltilex) mixture (Perkin-Elmer) was melted onto dried filters and radioactivity was counted using a Wallac Trilux MicroBeta counter (Perkin-Elmer). Data were normalized and analyzed in Graphpad Prism 5.0 using either “One site–Specific binding” or “One site–Fit Ki” for saturation and competition binding experiments, respectively.
Calcium flux assay.
A stable cell line for the 5-HT2B receptor was generated using the Flp-In 293 T-Rex Tetracycline inducible system (Invitrogen). Tetracycline-induced cells were seeded in 384-well poly-l-lysine–coated plates at a density of 20,000 cells per well in 40 µL DMEM containing 1% dialyzed FBS 18–20 h before the calcium flux assay. On the day of the assay, media was removed, and the cells were incubated for 1 h at 37 °C in 20 µL per well Fluo-4 Direct dye (Invitrogen) reconstituted in FLIPR buffer (1× HBSS, 2.5 mM probenecid, and 20 mM Hepes, pH 7.4) plus 10 µL per well of either 4 µM P2C2–Fab in FLIPR buffer or just FLIPR buffer. After dye loading, cells were placed in a FLIPRTETRA fluorescence imaging plate reader (Molecular Dynamics). Drug dilutions were prepared at 4× final concentration in drug buffer (1× HBSS, 20 mM Hepes, 0.1% BSA, 0.01% ascorbic acid, pH 7.4) and aliquoted into 384-well plates and placed in the FLIPRTETRA for drug stimulation. The fluidics module and plate reader of the FLIPRTETRA were programmed to read baseline fluorescence for 10 s (one read per second), then 10 µL of drug per well was added and read for 4 min (one read per second). Fluorescence in each well was normalized to the average of the first 10 reads (i.e., baseline fluorescence). Then, the maximum-fold increase, which occurred within the first 60 s after drug addition, was determined and fold over baseline was plotted as a function of drug concentration. Data were normalized to percent 5-HT stimulation and analyzed using “log(agonist) vs. response” in Graphpad Prism 5.0.
Tango arrestin recruitment assay.
The 5-HT2B receptor Tango construct was designed and assays were performed as previously described (29). HTLA cells expressing tobacco etched virus-fused β-Arrestin2 (kindly provided by Richard Axel, Columbia University, New York) were transfected with the 5-HT2B receptor Tango construct. The next day, cells were plated in DMEM supplemented with 1% dialyzed FBS in poly-l-lysine–coated 384-well white clear-bottom cell-culture plates at a density of 5,000 cells per well in a total volume of 40 µL. The cells were incubated for at least 6 h before receiving drug stimulation. Either 10 µL of 6 µM P2C2–Fab in drug buffer (1× HBSS, 20 mM Hepes, 0.1% BSA, 0.01% ascorbic acid, pH 7.4) or just drug buffer was added to the cells before 10 µL of 6× drug solution was added to the cells for overnight incubation. The next day, media and drug solution were removed and 20 µL per well of BrightGlo reagent (purchased from Promega, after 1:20 dilution in drug buffer) was added. The plate was incubated for 20 min at room temperature in the dark before being counted using a luminescence counter. Results (relative luminescence units) were plotted as a function of drug concentration, normalized to percent 5-HT stimulation, and analyzed using “log(agonist) vs. response” in GraphPad Prism 5.0.
Crystallization in LCP.
The 5-HT2B/ERG-Fab complex formation was achieved by mixing 5-HT2B/ERG (2-5 mg/mL) with Fab (5–10 mg/mL) in 1:1.2 mol ratio at 4 °C for 2 h. The complex was further concentrated to 40 mg/mL and crystallized using an LCP approach (30).
The 5-HT2B/ERG-Fab complex was reconstituted in LCP by mixing the protein solution with monopalmitolein (9.7 MAG, purchased from Nu-Check Prep) doped with 10% cholesterol in 1:1 (protein:lipid) vol/vol ratio using a syringe mixer (31). Initial crystallization trials were set up in 96-well glass sandwich plates (Marienfeld) using a Formulatrix NT8-LCP robot by dispensing 40 nL of protein-laden LCP per well and overlaying it with 800 nL of precipitant solution. Crystallization hits from plate format were further optimized for crystallization in syringes. Microcrystals for XFEL data collection were obtained in several Hamilton gas-tight syringes using the published protocols (32). Approximately 5 μL of protein-laden LCP were slowly injected as a continuous filament into a 100-μL syringe filled with 60 μL of precipitant solution. The final precipitant composition that resulted in showers of <10-μm crystals was 0.1 M Tris⋅HCl pH 7.7, 60 mM sodium/potassium tartrate, 25% (vol/vol) PEG400.
SFX.
LCP-SFX data collection was performed using the CXI instrument at the Linac Coherent Light Source (LCLS) at SLAC National Accelerator Laboratory. The LCLS was operated at a wavelength of 1.56 Å (7.95 keV) delivering individual X-ray pulses of 35-fs duration and 3.9 × 10¹¹ photons per pulse focused into a spot size of ∼1.5 µm in diameter using a pair of Kirkpatrick-Baez mirrors. Protein microcrystals in LCP medium were injected at room temperature inside a vacuum chamber into the beam focus region using the LCP injector with a 50-μm diameter nozzle at a flow rate of 0.2 μL/min. Microcrystals ranged in size from 1 to 10 μm. The instrument was operated at a repetition rate of 120 Hz and the diffraction data were recorded with the 2.3 Megapixel Cornell-SLAC Pixel Array Detector. The beam was attenuated to 9% (3.5 × 10¹⁰ ph per pulse) of full intensity to avoid detector saturation.
A total number of 1,877,040 snapshots were collected, of which 193,328 were identified as potential single crystal hits with more than 15 potential Bragg peaks using Cheetah (33), corresponding to an average hit rate of 10.3%. Autoindexing and structure factor integration of the crystal hits were performed using Monte Carlo integration routine with “pushres 1.5” option implemented in CrystFEL (v0.6.2) (34). Peak detection parameters were extensively optimized for Cheetah (33) and experimental geometry was refined for CrystFEL (34). The overall time of data collection from seven samples with a total volume of 55 μL was about 4.5 h and yielded 52,291 indexed patterns (indexing rate 27.0%).
Structure Solution and Refinement.
The SFX data were initially indexed and merged in the orthorhombic Laue class mmm. However, extensive molecular replacement (MR) trials failed to find a solution for either 5-HT2B or Fab in any space group belonging to this symmetry. To account for possibility of a pseudomerohedral twinning leading to a higher Laue symmetry, the Laue symmetry was reduced to 2/m, and a MR solution was found in the primitive monoclinic P21 space group with two 5-HT2B/ERG-Fab complexes per asymmetric unit. MR was performed by Phaser (35) in a step-wise manner: first, two molecules of 5-HT2B were placed using previously solved structure (PDB ID code 4NC3) without BRIL, then the constant parts of two Fabs were added followed by the variable subunits of the Fabs (PDB ID code 3QO1). BRIL molecules (from PDB ID code 4NC3) were added during the last additional Phaser run. After the structure was solved by MR, the initial model was built by Phenix.Autobuild (36) and further completed by manual adjustments in Coot (37) and iterative refinement in Phenix.refine (38) and Buster (39) using one TLS group per chain.
Acknowledgments
We thank S. Boutet for help with X-ray free-electron laser (XFEL) data collection, T. A. White for advice with XFEL data processing, M. Audet for advice with ELISA assays, and A. Walker for help with manuscript preparation. This work was supported by NIH Grants R01 GM108635 (to V.C.), R21 DA042298 (to W.L.), R01MH112205 (to B.L.R.), and U19MH82441 (to B.L.R.); NSF STC Award 1231306 (to U.W., W.L., M.M., and V.C.); the Center for Applied Structural Discovery at the Biodesign Institute at Arizona State University (U.W.); a National Institute of Mental Health Psychoactive Drug Screening Program contract (to B.L.R.); and the Michael Hooker Chair for Protein Therapeutics and Translational Proteomics (B.L.R.). Use of the Linac Coherent Light Source, SLAC National Accelerator Laboratory, was supported by the US Department of Energy, Office of Science, Office of Basic Energy Sciences, under Contract DE-AC02-76SF00515.
Footnotes
The authors declare no conflict of interest.
This article is a PNAS Direct Submission.
Data deposition: The atomic coordinates have been deposited in the Protein Data Bank, www.pdb.org (PDB ID code 5TUD).
This article contains supporting information online at www.pnas.org/lookup/suppl/doi:10.1073/pnas.1700891114/-/DCSupplemental.
References
- 1.Golay J, Introna M. Mechanism of action of therapeutic monoclonal antibodies: Promises and pitfalls of in vitro and in vivo assays. Arch Biochem Biophys. 2012;526:146–153. doi: 10.1016/j.abb.2012.02.011. [DOI] [PubMed] [Google Scholar]
- 2.Hutchings CJ, Koglin M, Marshall FH. Therapeutic antibodies directed at G protein-coupled receptors. MAbs. 2010;2:594–606. doi: 10.4161/mabs.2.6.13420. [DOI] [PMC free article] [PubMed] [Google Scholar]
- 3.Blanpain C, et al. Multiple active states and oligomerization of CCR5 revealed by functional properties of monoclonal antibodies. Mol Biol Cell. 2002;13:723–737. doi: 10.1091/mbc.01-03-0129. [DOI] [PMC free article] [PubMed] [Google Scholar]
- 4.Baribaud F, et al. Antigenically distinct conformations of CXCR4. J Virol. 2001;75:8957–8967. doi: 10.1128/JVI.75.19.8957-8967.2001. [DOI] [PMC free article] [PubMed] [Google Scholar]
- 5.Babcock GJ, Mirzabekov T, Wojtowicz W, Sodroski J. Ligand binding characteristics of CXCR4 incorporated into paramagnetic proteoliposomes. J Biol Chem. 2001;276:38433–38440. doi: 10.1074/jbc.M106229200. [DOI] [PubMed] [Google Scholar]
- 6.Jähnichen S, et al. CXCR4 nanobodies (VHH-based single variable domains) potently inhibit chemotaxis and HIV-1 replication and mobilize stem cells. Proc Natl Acad Sci USA. 2010;107:20565–20570. doi: 10.1073/pnas.1012865107. [DOI] [PMC free article] [PubMed] [Google Scholar]
- 7.O’Connor KH, et al. Requirement of multiple phage displayed peptide libraries for optimal mapping of a conformational antibody epitope on CCR5. J Immunol Methods. 2005;299:21–35. doi: 10.1016/j.jim.2004.11.025. [DOI] [PubMed] [Google Scholar]
- 8.Mancia F, et al. Production and characterization of monoclonal antibodies sensitive to conformation in the 5HT2c serotonin receptor. Proc Natl Acad Sci USA. 2007;104:4303–4308. doi: 10.1073/pnas.0700301104. [DOI] [PMC free article] [PubMed] [Google Scholar]
- 9.Gupta A, Heimann AS, Gomes I, Devi LA. Antibodies against G-protein coupled receptors: Novel uses in screening and drug development. Comb Chem High Throughput Screen. 2008;11:463–467. doi: 10.2174/138620708784911465. [DOI] [PMC free article] [PubMed] [Google Scholar]
- 10.Yamamoto K, et al. Phase I study of KW-0761, a defucosylated humanized anti-CCR4 antibody, in relapsed patients with adult T-cell leukemia-lymphoma and peripheral T-cell lymphoma. J Clin Oncol. 2010;28:1591–1598. doi: 10.1200/JCO.2009.25.3575. [DOI] [PubMed] [Google Scholar]
- 11.Webb DR, Handel TM, Kretz-Rommel A, Stevens RC. Opportunities for functional selectivity in GPCR antibodies. Biochem Pharmacol. 2013;85:147–152. doi: 10.1016/j.bcp.2012.08.021. [DOI] [PMC free article] [PubMed] [Google Scholar]
- 12.Jo M, Jung ST. Engineering therapeutic antibodies targeting G-protein-coupled receptors. Exp Mol Med. 2016;48:e207. doi: 10.1038/emm.2015.105. [DOI] [PMC free article] [PubMed] [Google Scholar]
- 13.Rasmussen SGF, et al. Crystal structure of the β2 adrenergic receptor-Gs protein complex. Nature. 2011;477:549–555. doi: 10.1038/nature10361. [DOI] [PMC free article] [PubMed] [Google Scholar]
- 14.Hino T, et al. G-protein-coupled receptor inactivation by an allosteric inverse-agonist antibody. Nature. 2012;482:237–240. doi: 10.1038/nature10750. [DOI] [PMC free article] [PubMed] [Google Scholar]
- 15.Rasmussen SGF, et al. Crystal structure of the human beta2 adrenergic G-protein-coupled receptor. Nature. 2007;450:383–387. doi: 10.1038/nature06325. [DOI] [PubMed] [Google Scholar]
- 16.Kruse AC, et al. Activation and allosteric modulation of a muscarinic acetylcholine receptor. Nature. 2013;504:101–106. doi: 10.1038/nature12735. [DOI] [PMC free article] [PubMed] [Google Scholar]
- 17.Huang W, et al. Structural insights into µ-opioid receptor activation. Nature. 2015;524:315–321. doi: 10.1038/nature14886. [DOI] [PMC free article] [PubMed] [Google Scholar]
- 18.Wacker D, et al. Structural features for functional selectivity at serotonin receptors. Science. 2013;340:615–619. doi: 10.1126/science.1232808. [DOI] [PMC free article] [PubMed] [Google Scholar]
- 19.Liu W, et al. Serial femtosecond crystallography of G protein-coupled receptors. Science. 2013;342:1521–1524. doi: 10.1126/science.1244142. [DOI] [PMC free article] [PubMed] [Google Scholar]
- 20.Wacker D, et al. Crystal structure of an LSD-bound human serotonin receptor. Cell. 2017;168:377–389.e12. doi: 10.1016/j.cell.2016.12.033. [DOI] [PMC free article] [PubMed] [Google Scholar]
- 21.Xu F, et al. Structure of an agonist-bound human A2A adenosine receptor. Science. 2011;332:322–327. doi: 10.1126/science.1202793. [DOI] [PMC free article] [PubMed] [Google Scholar]
- 22.Kang Y, et al. Crystal structure of rhodopsin bound to arrestin by femtosecond X-ray laser. Nature. 2015;523:561–567. doi: 10.1038/nature14656. [DOI] [PMC free article] [PubMed] [Google Scholar]
- 23.Carpenter B, Nehmé R, Warne T, Leslie AGW, Tate CG. Structure of the adenosine A(2A) receptor bound to an engineered G protein. Nature. 2016;536:104–107. doi: 10.1038/nature18966. [DOI] [PMC free article] [PubMed] [Google Scholar]
- 24.Xiang J, et al. Successful strategies to determine high-resolution structures of GPCRs. Trends Pharmacol Sci. 2016;37:1055–1069. doi: 10.1016/j.tips.2016.09.009. [DOI] [PubMed] [Google Scholar]
- 25.Katritch V, Cherezov V, Stevens RC. Structure-function of the G protein-coupled receptor superfamily. Annu Rev Pharmacol Toxicol. 2013;53:531–556. doi: 10.1146/annurev-pharmtox-032112-135923. [DOI] [PMC free article] [PubMed] [Google Scholar]
- 26.Valentin-Hansen L, Holst B, Frimurer TM, Schwartz TW. PheVI:09 (Phe6.44) as a sliding microswitch in seven-transmembrane (7TM) G protein-coupled receptor activation. J Biol Chem. 2012;287:43516–43526. doi: 10.1074/jbc.M112.395137. [DOI] [PMC free article] [PubMed] [Google Scholar]
- 27.Rasmussen SGF, et al. Structure of a nanobody-stabilized active state of the β(2) adrenoceptor. Nature. 2011;469:175–180. doi: 10.1038/nature09648. [DOI] [PMC free article] [PubMed] [Google Scholar]
- 28.Setola V, Roth BL. Screening the receptorome reveals molecular targets responsible for drug-induced side effects: Focus on ‘fen-phen’. Expert Opin Drug Metab Toxicol. 2005;1:377–387. doi: 10.1517/17425255.1.3.377. [DOI] [PubMed] [Google Scholar]
- 29.Kroeze WK, et al. PRESTO-Tango as an open-source resource for interrogation of the druggable human GPCRome. Nat Struct Mol Biol. 2015;22:362–369. doi: 10.1038/nsmb.3014. [DOI] [PMC free article] [PubMed] [Google Scholar]
- 30.Caffrey M, Cherezov V. Crystallizing membrane proteins using lipidic mesophases. Nat Protoc. 2009;4:706–731. doi: 10.1038/nprot.2009.31. [DOI] [PMC free article] [PubMed] [Google Scholar]
- 31.Cheng A, Hummel B, Qiu H, Caffrey M. A simple mechanical mixer for small viscous lipid-containing samples. Chem Phys Lipids. 1998;95:11–21. doi: 10.1016/s0009-3084(98)00060-7. [DOI] [PubMed] [Google Scholar]
- 32.Liu W, Ishchenko A, Cherezov V. Preparation of microcrystals in lipidic cubic phase for serial femtosecond crystallography. Nat Protoc. 2014;9:2123–2134. doi: 10.1038/nprot.2014.141. [DOI] [PMC free article] [PubMed] [Google Scholar]
- 33.Barty A, et al. Cheetah: Software for high-throughput reduction and analysis of serial femtosecond X-ray diffraction data. J Appl Cryst. 2014;47:1118–1131. doi: 10.1107/S1600576714007626. [DOI] [PMC free article] [PubMed] [Google Scholar]
- 34.White TA, et al. CrystFEL: A software suite for snapshot serial crystallography. J Appl Cryst. 2012;45:335–341. [Google Scholar]
- 35.McCoy AJ, et al. Phaser crystallographic software. J Appl Cryst. 2007;40:658–674. doi: 10.1107/S0021889807021206. [DOI] [PMC free article] [PubMed] [Google Scholar]
- 36.Zwart PH, et al. Automated structure solution with the PHENIX suite. Methods Mol Biol. 2008;426:419–435. doi: 10.1007/978-1-60327-058-8_28. [DOI] [PubMed] [Google Scholar]
- 37.Emsley P, Cowtan K. Coot: model-building tools for molecular graphics. Acta Crystallogr D Biol Crystallogr. 2004;60:2126–2132. doi: 10.1107/S0907444904019158. [DOI] [PubMed] [Google Scholar]
- 38.Adams PD, et al. PHENIX: a comprehensive Python-based system for macromolecular structure solution. Acta Crystallogr D Biol Crystallogr. 2010;66:213–221. doi: 10.1107/S0907444909052925. [DOI] [PMC free article] [PubMed] [Google Scholar]
- 39.Smart OS, et al. Exploiting structure similarity in refinement: Automated NCS and target-structure restraints in BUSTER. Acta Crystallogr D Biol Crystallogr. 2012;68:368–380. doi: 10.1107/S0907444911056058. [DOI] [PMC free article] [PubMed] [Google Scholar]


