Significance
Chromosomes are crowded places, and any nucleic acid motor proteins that act on DNA must function within these crowded environments. How crowded environments affect motor protein behaviors remains largely unexplored. Here, we use single-molecule fluorescence microscopy to visualize the ATP-dependent motor protein RecBCD as it travels along crowded DNA molecules bearing long tandem arrays of DNA binding proteins. Our findings show that RecBCD can push through highly crowded protein arrays while evicting the proteins from DNA. This behavior on crowded DNA is distinct from a previously described mechanism by which RecBCD disrupts single isolated nucleoprotein complexes. These findings may provide insights into how other types of motor proteins travel along crowded nucleic acids.
Keywords: RecBCD, single molecule, DNA curtain, molecular motor, molecular crowding
Abstract
In physiological settings, all nucleic acids motor proteins must travel along substrates that are crowded with other proteins. However, the physical basis for how motor proteins behave in these highly crowded environments remains unknown. Here, we use real-time single-molecule imaging to determine how the ATP-dependent translocase RecBCD travels along DNA occupied by tandem arrays of high-affinity DNA binding proteins. We show that RecBCD forces each protein into its nearest adjacent neighbor, causing rapid disruption of the protein–nucleic acid interaction. This mechanism is not the same way that RecBCD disrupts isolated nucleoprotein complexes on otherwise naked DNA. Instead, molecular crowding itself completely alters the mechanism by which RecBCD removes tightly bound protein obstacles from DNA.
Long stretches of naked DNA do not exist in living cells. Instead, chromosomes are bound by all of the proteins that are necessary for genome compaction, organization, regulation, and maintenance. DNA polymerases, RNA polymerases (RNAPs), helicases, translocases, and chromatin remodeling complexes must all travel along the highly crowded nucleic acids that exist within these physiological settings. There is a growing appreciation that ATP-dependent motor proteins are required to either remove or remodel nucleoprotein complexes that may otherwise block normal processes related to nucleic acid metabolism, including DNA replication, transcription, and DNA repair (1–9). Despite this importance, there remains almost no detailed mechanistic information describing how molecular motor proteins of any type behave on highly crowded nucleic acids.
RecBCD is a large (330-kDa) heterotrimeric complex that has served as an important model system for understanding the properties of nucleic acid motor proteins (10–13). RecBCD processes double-stranded DNA breaks during homologous recombination and replication fork rescue in Escherichia coli and also degrades linear chromosome fragments to prevent aberrant DNA replication or recombination (10, 11, 14). Interestingly, RecB and RecC are the only two recombination proteins necessary for cell viability when head-on replication–transcription collisions are exacerbated by inversion of the rRNA operon (15). In addition to its roles in protecting genome integrity, RecBCD is also a self-defense enzyme that degrades foreign invaders, such as bacteriophage, and the resulting DNA fragments are incorporated into the CRISPR locus, providing immunity against additional infection (16). RecBCD possesses two ATP-dependent Superfamily 1 (SF1) molecular motor proteins, the 3′→5′ SF1A helicase RecB (134 kDa) and the 5′→3′ SF1B helicase RecD (67 kDa) (13). The RecC subunit (129 kDa) holds the complex together and coordinates the response to 8-nt cis-acting cross-over hotspot instigator (Chi) sequences (5′-dGCTGGTGG-3′). RecD is the lead motor before Chi, RecB is the lead motor after Chi, and Chi recognition is accompanied by a reduced rate of translocation corresponding to the slower velocity of RecB (17, 18). RecB also contains a nuclease domain necessary for DNA end processing, and recognition of Chi results in the production of 3′ single-stranded DNA (ssDNA) overhangs onto which the recombinase RecA is loaded (10, 14).
All biological functions of RecBCD require it to travel along DNA that will be occupied by other proteins, and as such, RecBCD has been used as a model for studying how motor proteins respond to DNA-bound obstacles (19, 20). Single-molecule observations have revealed that RecBCD can disrupt a variety of tenaciously bound nucleoprotein complexes, including EcoRIE111Q, RNAP, and lac repressor. RecBCD does not slow or pause during collisions with individual proteins. Instead, RecBCD seems to evict each of these different proteins through a common mechanism, in which probability of protein dissociation is directly proportional to the number of steps that they are forced to take as RecBCD pushes them from one nonspecific site to the next (19). RecBCD is even capable of stripping nucleosomes from DNA, highlighting it as an extremely powerful molecular motor (19, 20).
Here, we sought to establish whether RecBCD could translocate along DNA substrates that were occupied by the high-affinity DNA binding proteins EcoRIE111Q or E. coli RNAP holoenzyme. We show that, under crowded conditions, RecBCD quickly and sequentially clears these nucleoprotein complexes from DNA by pushing adjacent proteins into one another. This mechanism of sequential protein disruption from the tandem arrays is entirely distinct from how RecBCD removes isolated protein complexes from DNA, indicating that molecular crowding itself can alter the mechanism by which ATP-dependent molecular motor proteins respond to nucleoprotein obstacles. These findings provide insights into how molecular motors behave while traveling along nucleic acids in crowded physiological settings.
Results
Models for Protein Eviction in Crowded Environments.
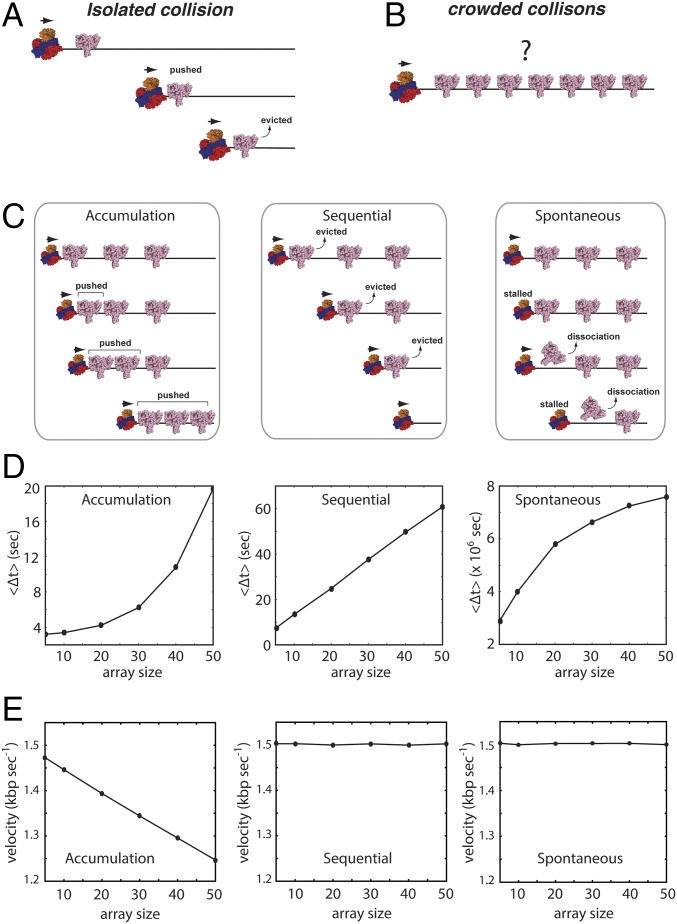
We have previously shown that RecBCD can push a single EcoRIE111Q dimer or single RNAP complexes for very long distances along DNA before they are eventually displaced into solution (Fig. 1A) (19). The question that naturally arises from this result is what happens when RecBCD encounters DNA-bound proteins in highly crowded environments (Fig. 1B). Does RecBCD stall when traveling on crowded DNA? Is RecBCD able to continue processive translocation in crowded conditions, and if so, how? To help answer these questions, we first constructed a general kinetic model that, in principle, might be applied to any motor protein that must travel on DNA in crowded condition. Then, we experimentally tested the hypotheses predicted from these models for the specific case of RecBCD.
Fig. 1.
Models for translocase behavior in crowded environments. (A) Schematic illustration of RecBCD pushing a single EcoRIE111Q based on our previously published findings (19). (B) Illustration of the experimental question being addressed in this work, namely what takes place when RecBCD encounters a crowded array of EcoRIE111Q on DNA. (C) Schematic depictions of three generalized models (accumulation, sequential, and spontaneous) for RecBCD movement through protein arrays. Details of each model are presented in the text. (D) Results from KMC simulations for each different model showing the predicted relationships between RecBCD pause durations () and protein array size. The durations () represent the time in which RecBCD remains within the region of the array. The array size represents how many EcoRI binding sites are within the array. (E) Predicted postarray RecBCD velocities for each model. The postarray velocity represents the predicted velocity of RecBCD after passage through the array.
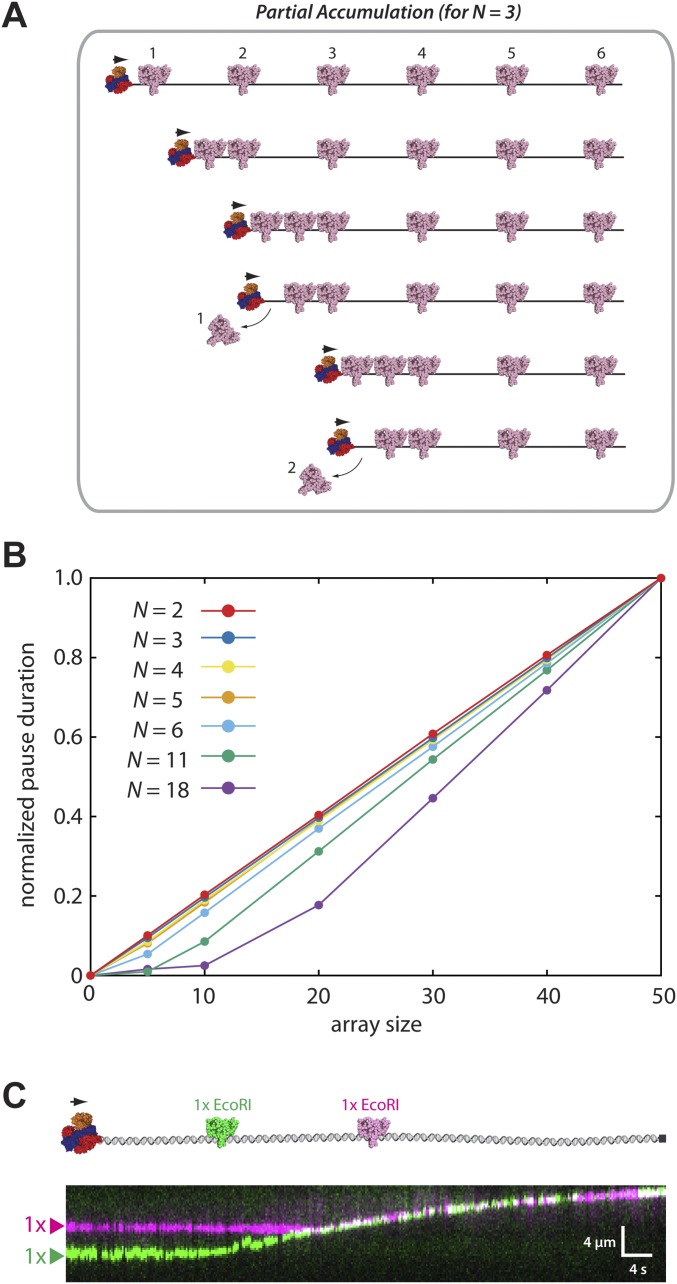
As an initial step toward understanding how motor proteins might behave in crowded settings, we first considered three generalized scenarios describing potential outcomes of RecBCD collisions with protein arrays (Fig. 1C). In the (i) accumulation model, RecBCD pushes each protein into its nearest neighbor without dislodging any of the proteins from the DNA, resulting in greater resistance as proteins continue to accumulate in front of the translocase. For the (ii) sequential model, RecBCD actively evicts each protein as it is encountered. In the (iii) spontaneous model, the proteins spontaneously dissociate according to their intrinsic dissociation rate constants, and RecBCD must wait for these dissociation events before moving forward. We include the spontaneous model as a formal possibility, although we note that this model is unlikely to be correct for RecBCD, because previous experiments have shown that RecBCD can quickly push EcoRIE111Q, RNAP, and lac repressor off of their respective cognate binding sites with no evidence of either slowing or pausing (19). Importantly, the accumulation and sequential models are not mutually exclusive but rather, may be considered to reflect a continuum of models. Indeed, RecBCD readily pushes isolated proteins for extended distances along DNA (19), suggesting that it might also push proteins into one another on crowded DNA. These observations suggest that some variation of the accumulation model could apply for RecBCD acting in crowded environments. To account for this possibility, we also considered an alternative variation of the sequential model, in which small numbers of proteins can accumulate in front of RecBCD before the accrued resistance leads to sequential dissociation (Fig. S1A). For clarity, we refer to this variation of the sequential model as “sequential eviction after collision model” here after.
Fig. S1.
KMC simulations of the alternative sequential dissociation model. (A) Schematic illustration of a hybrid model invoking components of both accumulation and sequential eviction. In this example, three proteins accumulate () before dissociation. Additional details of this model are presented in Materials and Methods. (B) Pause duration distributions () for simulations involving differential numbers of accumulated proteins () for each different array size as indicated. We fit the data for n = 5 with the linear and exponential equations. The sums of squared residuals for best fit curves are 0.2 (seconds2) for the linear equation and 221.9 (seconds2) for the exponential equation, suggesting that the linear equation fits better than the exponential equation. (C) Experimental schematic and kymograph showing that RecBCD (unlabeled) can push two molecules of differentially labeled EcoRIE111Q.
Monte Carlo Simulations of Protein Eviction by DNA Translocases.
We next performed kinetic Monte Carlo (KMC) simulations as a means to predict potential experimental outcomes for each of the different models. For these KMC simulations, we modeled the behavior of RecBCD on DNA substrates bearing 5–50× tandem arrays of the high-affinity DNA binding protein EcoRIE111Q. This protein is a catalytically inactive version of the EcoRI restriction endonuclease that binds tightly to DNA, but it is unable to cleave its cognate target site (21). We chose EcoRIE111Q for our studies, because it is one of the highest-affinity DNA binding proteins known to exist, with site-specific and nonspecific dissociation constants (Kd) of ∼2.5 fM and ∼4.8 pM (21), respectively. EcoRIE111Q is also a highly potent block to both the transcription (22–24) and DNA replication machineries (25, 26). In addition, WT EcoRI can withstand up to ∼20–40 pN applied force (27). EcoRIE111Q binds to its cognate target ∼3,000-fold more tightly than WT EcoRI. Therefore, we infer that EcoRIE111Q can resist at least as much force as the WT protein.
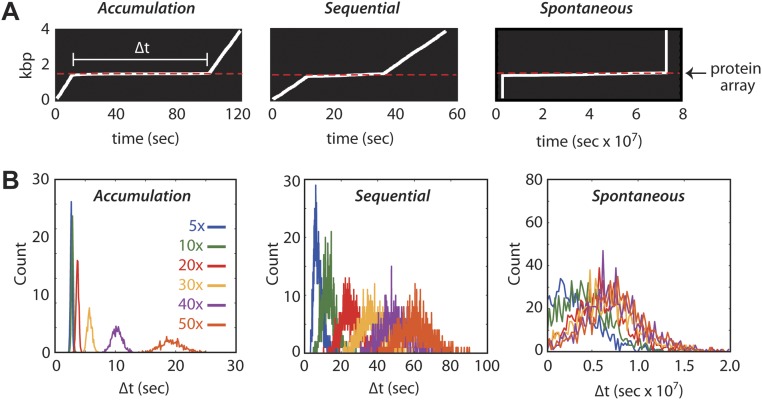
Within each KMC simulation, the DNA-bound proteins must either slide or dissociate on collision with RecBCD. The accumulation model is realized by prohibiting dissociation of the obstacle proteins, which are instead always pushed by RecBCD. The sequential model requires RecBCD to provoke protein dissociation before moving forward. In the spontaneous model, RecBCD must wait until proteins dissociate according to their intrinsic dissociation rate constants. Each model predicts that RecBCD will slow or stall on encountering the array; these events should be revealed as an experimentally observable pause coinciding with the location of protein array (Fig. S2A). Importantly, the accumulation, sequential, and spontaneous dissociation models all yield distinct predictions for the relationship between apparent pause duration (〈Δt〉) and array size (Fig. 1D and Fig. S2B). The accumulation model predicts an exponential increase in pause duration with increasingly large protein arrays, the sequential model predicts a linear relationship between pause duration and array size, and the spontaneous model predicts a logarithmic variation in pause duration for the different array sizes. The spontaneous dissociation model also predicts that RecBCD will traverse the array orders of magnitude more slowly than the other models, because RecBCD must wait for each protein to dissociate (Fig. 1D). In addition, the accumulation model predicts that RecBCD will experience a persistent reduction in velocity after traversing the array because of the accumulated resistance of the proteins that it must push as it continues to move along the DNA (Fig. 1E). Finally, if small numbers of EcoRIE111Q can build up in front of RecBCD before dissociation, then the pause duration will scale approximately linearly with array size as up to few proteins accumulate in front of RecBCD, similar to expectations for a purely sequential model (Fig. S1B). However, pause duration begins to scale exponentially if larger numbers of proteins can accumulate in front of RecBCD before dissociation, yielding results that would be more similar to the pure accumulation model (Fig. S1B).
Fig. S2.
KMC simulations to predict translocase movement through protein arrays. (A) Representative kymographs derived from the KMC simulations of the accumulation, sequential, and spontaneous models. The white lines represent the movement of the translocase along a DNA molecule, pausing on encountering the protein array. (B) Distributions of pause durations (). Colored lines represent the distribution derived from simulations using the 5–50× protein arrays as indicated. Each distribution was calculated from a total of 1,000 simulation trajectories.
Visualizing Removal of Unlabeled EcoRIE111Q from Crowded DNA.
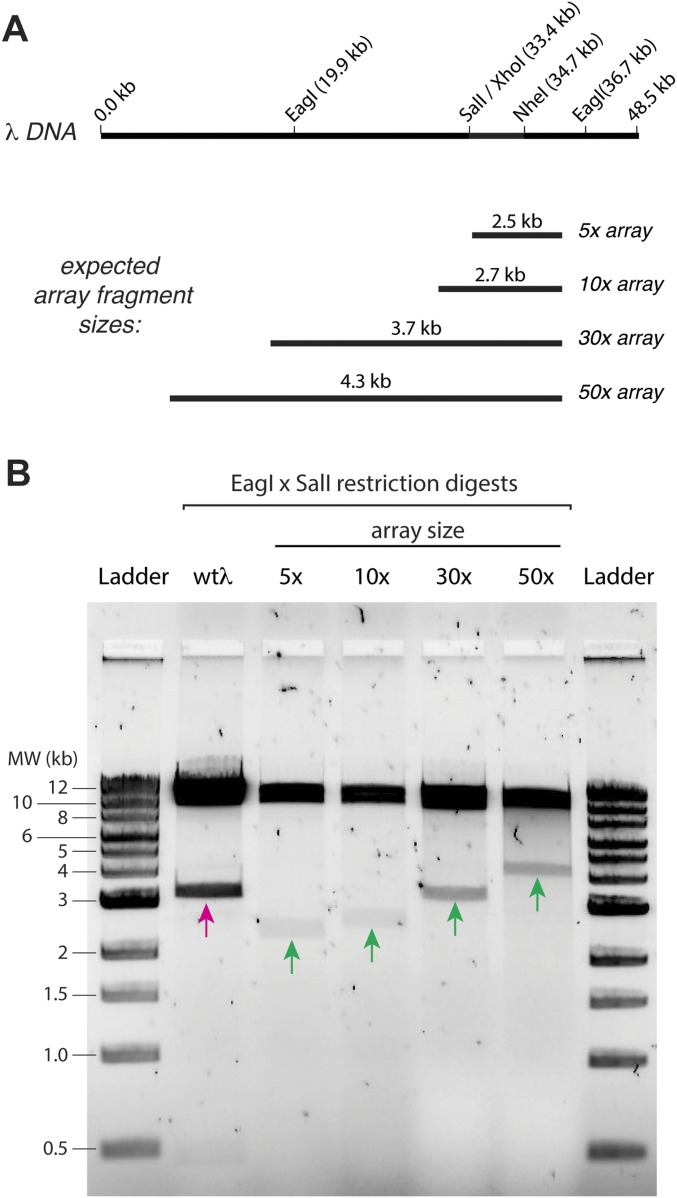
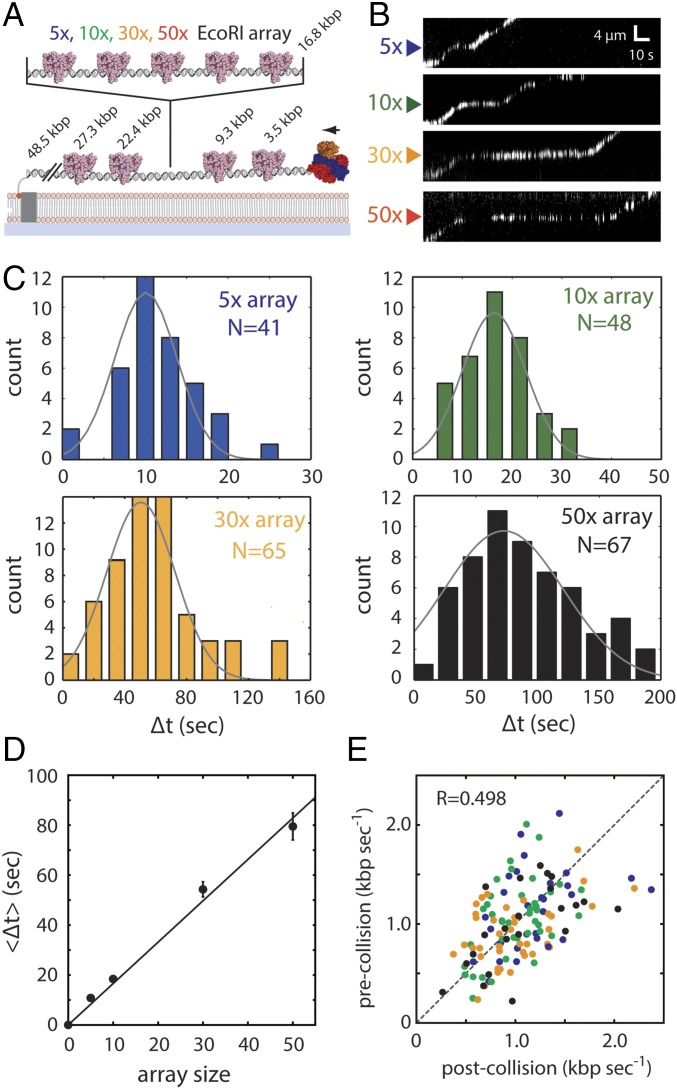
We next sought to establish an experimental approach for directly testing the predictions for each of the different models. To accomplish this aim, we engineered λ-phage DNA molecules bearing tandem arrays of 5, 10, 30, or 50 EcoRI binding sites (Fig. S3). We then used single-molecule DNA curtain assays to experimentally determine whether quantum dot (Qdot)-tagged RecBCD could traverse these protein arrays (Fig. 2A) and if so, determine which of the models presented above might most closely reflect the experimental data. In all of the experiments, RecBCD molecules are injected and incubated with the DNA curtain for 20 min in the absence of ATP. After washing out the free RecBCD molecules in solution, we initiated the translocation and DNA digestion reaction by supplementing the buffer with 1 mM ATP. Thus, any RecBCD that dissociates from the DNA ends is not replenished.
Fig. S3.
Engineered 5×, 10×, 30×, and 50× arrays of EcoRI binding sites on λ-DNA. (A) A schematic of the λ-DNA and a schematic of the expected fragment sizes for the different DNA array lengths when digested with SalI and EagI. (B) A 1% agarose gel showing that the length of engineered sites is as expected. In this assay, 5-μL aliquots of the engineered λ-DNA were incubated with 1 μL of SalI-HF (R3138S; New England BioLabs) and EagI-HF (R3505S; New England BioLabs) in 38 μL water supplemented with 5 μL of 5× CutSmart buffer (B7204S; New England BioLabs) for 2 h. The reaction was mixed with 10 μL of 6× loading dye (B7024S; New England BioLabs) and run on the gel for 1 h at 100 V; a 1-kb DNA ladder (N3232S; New England BioLabs) was also run. The magenta arrow highlights the 3.3-kb native DNA fragment [SalI (33.4 kb) to EagI (36.7 kb)] present before cloning in the array fragments. The green arrows highlight the array-containing fragments for each of the different substrates. MW, molecular weight.
Fig. 2.
RecBCD can traverse highly crowded DNA substrates. (A) Schematic of the DNA curtain assay used to assess RecBCD behavior during passage through protein arrays. The DNA contains four native EcoRI binding sites (as indicated) and a cloned array of 5–50× EcoRI binding sites. The reactions were initiated by addition of 1 mM ATP into the RecBCD buffer (40 mM Tris⋅HCl, pH 7.5, 2 mM MgCl2, 0.2 mg mL–1 Pluronic). (B) Representative kymographs showing RecBCD movement through 5–50× arrays in the presence of saturating EcoRIE111Q. Gaps in the RecBCD trajectories result from Qdot blinking. (C) Experimentally observed pause distributions for each array. Each dataset is fitted by a Gaussian distribution to derive the average pause duration. (D) Experimental pause duration () plotted against array size. Error bars represent SD derived from a bootstrap analysis. The sums of squared residuals for best fit curves are 29.3 (seconds2) for the linear equation and 422.1 (seconds2) for the exponential equation, suggesting that the linear equation fits better than the exponential equation. (E) Scatter plot showing RecBCD pre- and postcollision velocities; color coding is the same as in C and E. R represents the Pearson correlation coefficient.
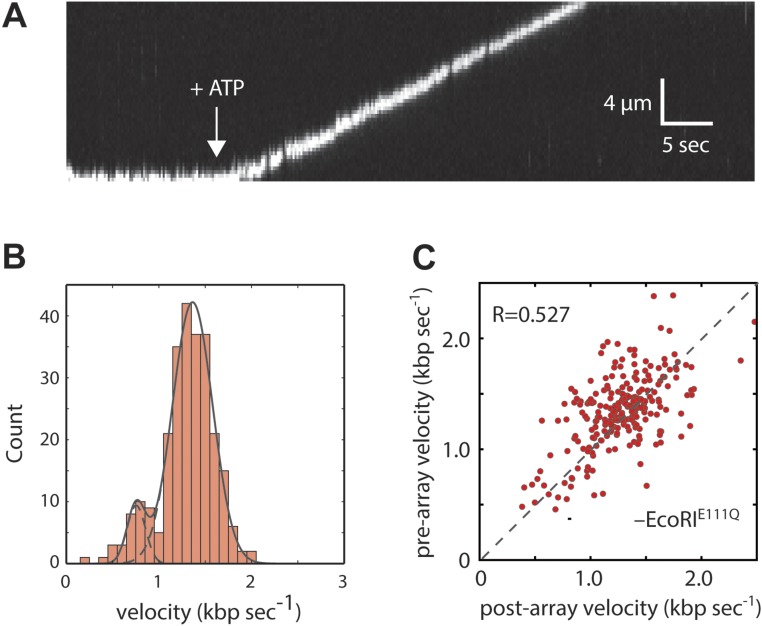
In the absence of EcoRIE111Q, Qdot-tagged RecBCD displayed high processivity and monotonic translocation with two peaks in the velocity distribution, corresponding to 745 ± 37 (13.6%) and 1,368 ± 18 bp s–1 (86.4%) (Fig. S4 A and B). This result is in good agreement with reports for the properties of unlabeled RecBCD on naked DNA (18, 28, 29).
Fig. S4.
Translocation properties of Qdot-tagged RecBCD in the absence of EcoRIE111Q. (A) An example of a kymograph showing the movement of Qdot-tagged RecBCD along an unlabeled DNA molecule in the absence of EcoRIE111Q. RecBCD was prebound to the DNA, and translocation was initiated by the injection of ATP (white arrow). (B) Velocity distribution for Qdot-tagged RecBCD (n = 269). (C) Scatter plot of RecBCD velocities before and after encountering the EcoRI binding site array for control experiments conducted in the absence of any EcoRIE111Q (n = 269). The R represents the Pearson correlation coefficient.
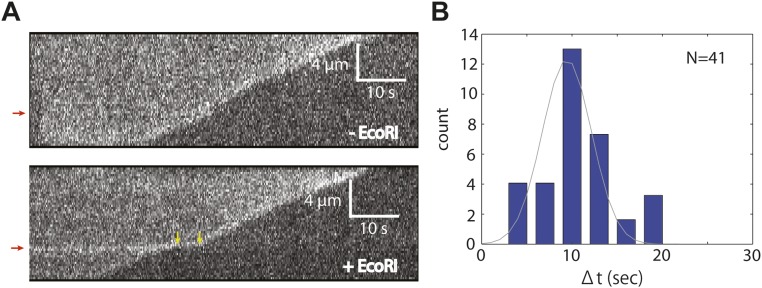
We next asked whether the presence of EcoRIE111Q affected the translocation behavior of RecBCD. Remarkably, RecBCD was still able to processively translocate along the DNA in the presence of saturating EcoRIE111Q concentrations (Fig. 2B and Fig. S5). However, as predicted by the KMC simulations, RecBCD exhibited a noticeable pause on encountering each of the protein arrays (Fig. 2 B and C), and the average pause duration (〈Δt〉) scaled linearly with array size (Fig. 2D). Control experiments with unlabeled RecBCD and unlabeled EcoRIE111Q were in close agreement with results from Qdot-tagged RecBCD, arguing against the possibility that the Qdot might alter the outcomes of the collisions (Fig. S6). Together, these results are in closest agreement with expectations for the sequential eviction model or a variation of the sequential model involving the accumulation of a small number of EcoRIE111Q dimers in front of RecBCD (Fig. 1 D and E and Fig. S1B). We do not yet know precisely how many EcoRIE111Q dimers might accumulate in front of RecBCD before they start dissociating. However, DNA curtain experiments have revealed that RecBCD can concurrently push at least two EcoRIE111Q dimers (Fig. S1C), whereas the tandem arrays of five EcoRIE111Q dimers cause a noticeable pause in RecBCD translocation (Fig. 2). Therefore, we conclude that between two and five EcoRIE111Q dimers might accumulate in front of RecBCD before the combined resistance leads to their sequential eviction.
Fig. S5.
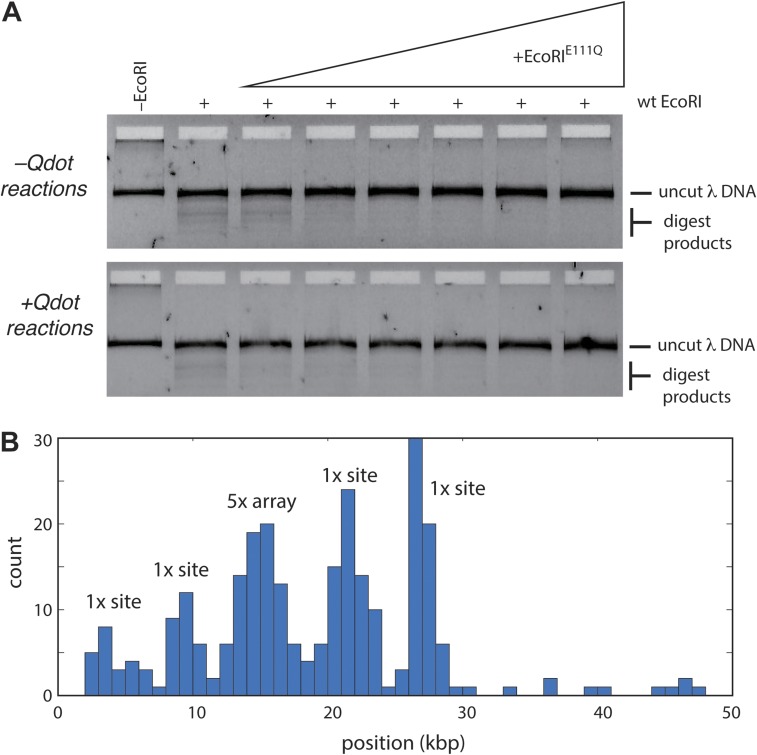
The saturation of the λ-DNA substrate with EcoRIE111Q. (A) An example of the bulk biochemical assay used to establish conditions for saturating the EcoRI binding site arrays with EcoRIE111Q. In this example, the λ-DNA substrate bearing a 5× binding site array was preincubated with varying concentrations of EcoRIE111Q for 30 min at room temperature. The reactions were then challenged by the addition of WT EcoRI for 15 min at 37 °C. DNA products were then resolved on a 1% agarose gel. (B) Position distribution histogram from a DNA curtain assay with Qdot-tagged EcoRIE111Q bound to a λ-DNA harboring a 5× array. The location of the array is indicated along with the four peaks corresponding to the native EcoRI binding sites. The height of the 5× peak is similar to the 1× peak heights, because the data are not corrected for signal intensity.
Fig. S6.
The collision of unlabeled RecBCD with an unlabeled 5× EcoRI array. (A) Representative kymographs from experiments where unlabeled RecBCD translocates on YoYo-1–stained DNA containing the 5× EcoRI binding site array (position indicated by red arrows) in the absence (Upper) and presence (Lower) of unlabeled EcoRIE111Q. The yellow arrows in Lower indicate the beginning and ending of the RecBCD pause when EcoRIE111Q is bound to the DNA. Note that the protein-bound EcoRI arrays routinely fluoresce more brightly with YoYo-1 compared with the naked flanking DNA. (B) Pause time distribution for unlabeled in the presence of unlabeled EcoRIE111Q. The dataset is fitted by a Gaussian distribution to derive the average pause duration (9.5 ± 0.4 s).
RecBCD slowed to an average apparent velocity of 27.3 ± 3.4 bp s–1 while traversing the EcoRIE111Q arrays, but the velocity drastically increased once beyond the array. We measured the RecBCD velocities from pre- and postarray trajectories in the presence (Fig. 2E) and absence of EcoRIE111Q (Fig. S4C). Comparison of these two scatter plots reveals no statistically significant difference in the RecBCD velocities that could be attributed to its passage through an occupied EcoRIE111Q array. Instead, any variation in pre- and postcollision velocities seems to arise from the limited precision of the velocity measurement or normal variation in RecBCD translocation rates as opposed a persistent, systematic reduction in translocation velocity. It should be noted that there can be up to two EcoRIE111Q molecules pushed in front of RecBCD in the prearray trajectories because of the native EcoRI binding sites located upstream from the cloned arrays (Fig. 2A). Thus, the velocity does not change even if a small number of EcoRIE111Q molecules have accumulated in front of RecBCD in the postarray trajectories. Together, these results are also in closest agreement with expectations for the sequential eviction after collision model.
Sequential Disruption of Fluorescent EcoRIE111Q Arrays.
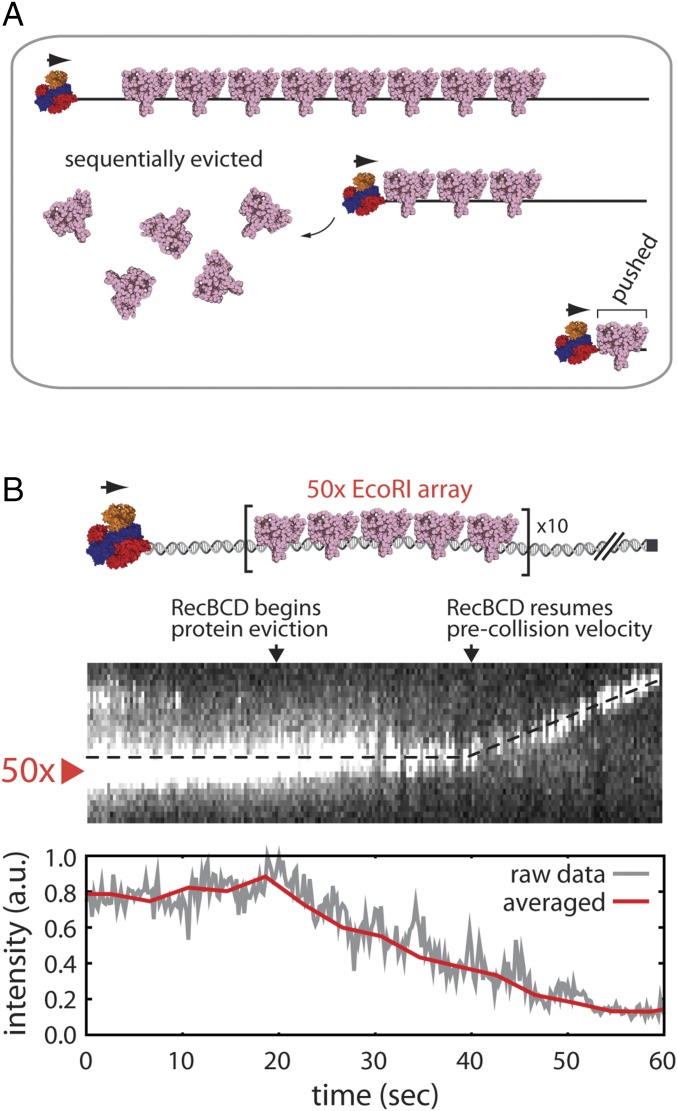
The KMC simulations and experimental results presented above together with the observation that RecBCD readily pushes isolated molecules of EcoRIE111Q (19) all suggest that RecBCD sequentially removes proteins from crowded DNA and that it may do so by pushing the proteins into one another. This model makes at least two important predictions that can be experimentally tested using DNA curtain assays. The sequential eviction after collision models predicts that passage of RecBCD through a fluorescently tagged protein array should coincide with a linear decrease in the array signal as the proteins are evicted, but the last protein(s) within the array should be pushed for long distances along the naked DNA, because they will encounter no resistance from more distal obstacles (19) (Fig. 3A). To test this first prediction, we labeled a λ-DNA substrate bearing a 50× EcoRI binding site array with Qdot-tagged EcoRIE111Q and then asked whether and how unlabeled RecBCD passed through these arrays. As anticipated, eviction of the fluorescent proteins from the 50× array was initially observed as a linear decrease in the overall fluorescence signal intensity as unlabeled RecBCD moved slowly through the array (Fig. 3B). Also, as predicted, on reaching the end of the array, RecBCD resumed its normal velocity and pushed the remaining protein(s) toward the end of the DNA molecule (Fig. 3B).
Fig. 3.
RecBCD collisions with fluorescent 50× arrays of EcoRI. (A) A model describing a predicted outcome for RecBCD collisions with the 50× EcoRIE111Q arrays; details are presented in the text. (B) Representative kymograph and corresponding signal intensity profile showing unlabeled RecBCD traversing a 50× array of Qdot-tagged EcoRIE111Q. Signal intensity represents the total integrated fluorescence signal of all Qdot-tagged EcoRIE111Q molecules bound to the DNA. The data were acquired at 5 Hz (gray line). The data acquired within 2-s windows are averaged and also plotted (red line). Reactions were initiated by addition of 1 mM ATP into the RecBCD buffer (40 mM Tris⋅HCl, pH 7.5, 2 mM MgCl2, 0.2 mg mL–1 Pluronic). Gaps in the EcoRIE111Q trace result from Qdot blinking.
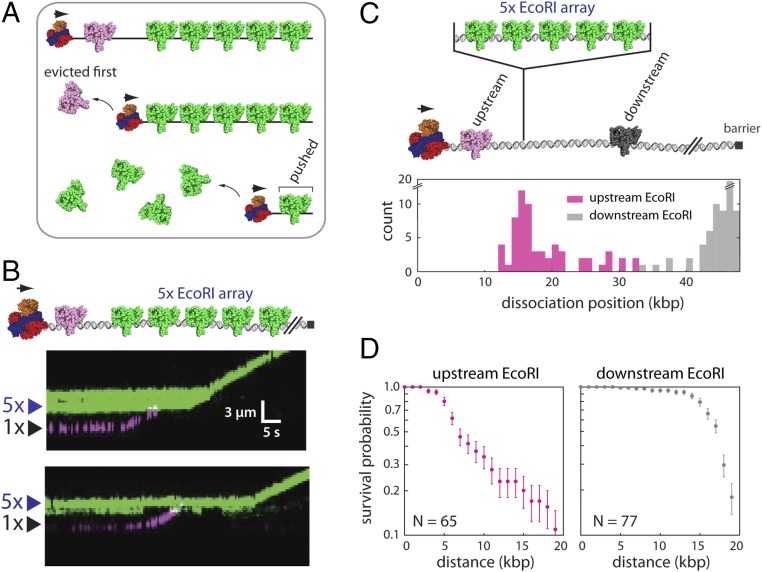
The sequential eviction after collision models also predicts that, if RecBCD pushes a single proximal EcoRIE111Q into a more distal EcoRIE111Q array, then the resulting collision should coincide with the preferential eviction of the proximal protein as it is driven into the larger array (Fig. 4A). To test this prediction, we performed two-color single-molecule experiments, in which separate aliquots of EcoRIE111Q were labeled with either green (Qdot 605) or red (Qdot 705) Qdots. The differentially labeled proteins were bound to λ-DNA bearing the 5× EcoRI binding site array. We then visually identified DNA molecules with appropriately dispersed mixtures of red and green EcoRIE111Q bound to the native EcoRI sites within the λ-DNA and the engineered 5× arrays (Fig. 4B). As predicted by sequential eviction after collision models, when unlabeled RecBCD pushed Qdot-tagged EcoRIE111Q into a 5× array, the proximal protein rapidly dissociated from the DNA on encountering the 5× array in ∼93% of experimentally observed collisions (n = 25/27) (Fig. 4B). We also compared the fates of isolated EcoRIE111Q molecules bound to the native EcoRI sites located either upstream or downstream of the engineered 5× array (Fig. 4C). As predicted by the sequential eviction after collision model, the upstream proteins most commonly dissociated from the DNA on being pushed into the 5× EcoRIE111Q arrays (Fig. 4 C and D). In striking contrast, the downstream proteins were pushed for much longer distances and often survived until reaching the chromium barrier at the tethered ends of the DNA molecules (Fig. 4 C and D). Taken together, these experimental findings all support a model in which RecBCD clears crowded DNA of tightly bound EcoRIE111Q by pushing the proteins into one another, resulting in the rapid and sequential removal of proteins from the DNA.
Fig. 4.
Sequential eviction of EcoRI from DNA by RecBCD. (A) A model describing the predicted outcome for two-color labeling experiments designed to test for sequential protein eviction by RecBCD; details are presented in the text. (B) Examples of two-color kymographs showing Qdot-tagged EcoRIE111Q (Qdot 705; magenta) being pushed into a 5× array bound by Qdot-tagged EcoRIE111Q (Qdot 605; green). Reactions were initiated by addition of 1 mM ATP into the RecBCD buffer (40 mM Tris⋅HCl, pH 7.5, 2 mM MgCl2, 0.2 mg mL–1 Pluronic). Gaps in the EcoRIE111Q traces result from Qdot blinking. (C) Schematic illustration of the experiment used to assess the fate of EcoRIE111Q bound to native target sites in the λ-DNA located either upstream or downstream of the 5× EcoRI array (Upper) and the resulting dissociation positions of the upstream and downstream EcoRIE111Q molecules (Lower). (D) Survival probability plots for EcoRIE111Q molecules located upstream and downstream of the 5× EcoRI arrays. The horizontal axis represents the distance from the original EcoRI binding position. The error bars represent SDs calculated by bootstrap analysis.
RNAP Rapidly Dissociates When Forced into EcoRIE111Q.
Our results show that RecBCD sequentially removes EcoRIE111Q from DNA by pushing the proteins into one another. We next sought to determine whether similar principles apply to other nucleoprotein roadblocks. RNAP is perhaps the most abundant and formidable nucleoprotein roadblock that will be encountered by RecBCD in living cells. A single E. coli cell contains ∼2,000 molecules of RNAP, and under typical growth conditions, ≥65% of these polymerases are bound to the bacterial chromosome (30). RNAP is also of particular interest, because it is a high-affinity DNA binding protein (Kd ∼ 10–100 pM) and a powerful translocase capable of moving under an applied load of up to ∼14–25 pN (31). RNAPs can survive encounters with replication forks and stall fork progression in head-on collisions (32–36). Indeed, the highly transcribed rRNA genes are a potent blockade to DNA replication (37–39). We have previously shown that RecBCD can disrupt individual E. coli RNAP complexes, including core RNAP, RNAP holoenzyme, stalled elongation complexes, and actively transcribing polymerases in either head-to-head or head-to-tail orientation (19). RecBCD pushes isolated RNAP for long distances over naked DNA, and dissociation takes place as RecBCD forces the polymerase to step from one nonspecific binding site to the next (19).
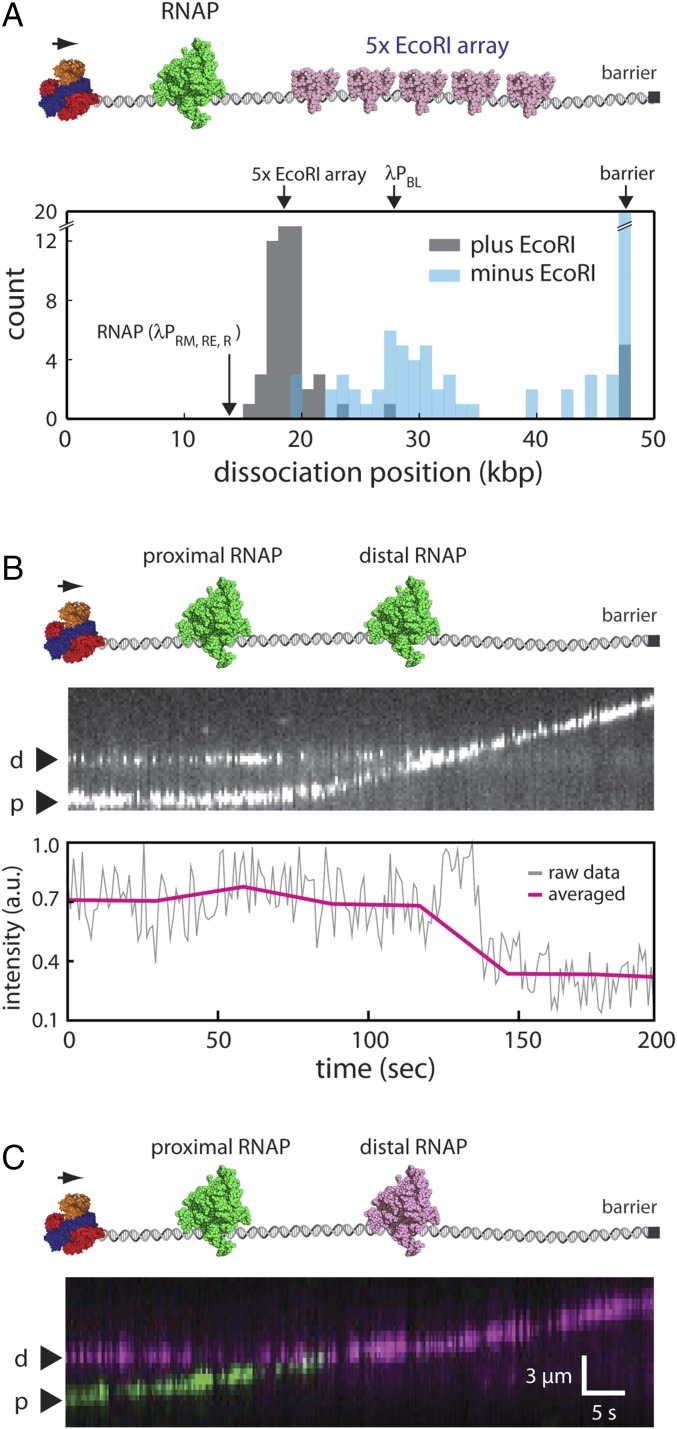
To determine whether and how RecBCD might disrupt RNAP on crowded DNA, we first sought to establish what happens when RecBCD pushes RNAP into tandem 5× arrays of EcoRIE111Q (Fig. 5A). If the sequential eviction after collision model applies to RNAP, then this model predicts that RNAP should rapidly dissociate from the DNA on being forced into the EcoRI array by RecBCD. For these experiments, Qdot-tagged RNAP holoenzyme was bound to the native phage promoters (19, 40), and unlabeled RecBCD was loaded onto the free ends of the DNA molecules. RecBCD translocation was then initiated by the addition of ATP. Remarkably, RNAP dissociates from the DNA almost immediately on being pushed by RecBCD into the EcoRIE111Q array for all observed collisions (n = 22/22) (Fig. 5A). Control experiments confirmed that RNAP dissociation at the 5× EcoRI array position was entirely dependent on the presence of EcoRIE111Q, and when EcoRIE111Q was absent, many of the polymerases were instead pushed to the ends of the naked DNA molecules (Fig. 5A). We conclude that RNAP rapidly dissociates from the DNA when pushed into other high-affinity DNA binding proteins by RecBCD, in good agreement with the sequential eviction after collision model.
Fig. 5.
RecBCD sequentially disrupts tandem RNAPs. (A) Experimental schematic (Upper) and resulting dissociation position distribution data (Lower) for Qdot-tagged RNAP pushed into 5× EcoRI arrays by RecBCD. (B) Representative one-color kymograph showing two Qdot-tagged RNAP complexes (promoter-bound holoenzyme) being pushed into one another by unlabeled RecBCD and the corresponding graph showing the cumulative fluorescence intensity of the Qdot-tagged proteins. (C) Representative two-color kymograph showing two Qdot-tagged RNAP complexes (promoter-bound holoenzyme) being pushed into one another by unlabeled RecBCD; similar outcomes were observed in most (n = 50/52) two-color RNAP collisions, and in the remaining cases, RecBCD pushed both proteins (n = 2/52). p and d represent proximal and distal RNAP, respectively. In B and C, reactions were initiated by the addition of 1 mM ATP into the RecBCD buffer (40 mM Tris⋅HCl, pH 7.5, 2 mM MgCl2, 0.2 mg mL–1 Pluronic), and gaps in the RNAP trajectories result from Qdot blinking.
Sequential Eviction of Tandem RNA Polymerases.
Interestingly, when EcoRIE111Q was absent from the reactions, a second population of RNAP dissociated at a position coinciding with the location of the λPBL promoter (Fig. 5A) (40). One possible explanation for this observation is that the Qdot-tagged RNAP might be encountering unlabeled RNAP bound to the λPBL promoter as it is pushed along the DNA by RecBCD, and the resulting collisions with the unlabeled proteins may have provoked rapid eviction of the Qdot-tagged protein from the DNA. Therefore, we next sought to directly examine what happens when RecBCD pushed two RNAPs into one another. To accomplish this aim, we relied on the eight native promoters present in the λ-phage genome, which allows multiple RNAP complexes to be loaded onto the same DNA molecule (40). We first performed DNA curtain experiments using unlabeled RecBCD and promoter-bound RNAP open complexes, which were labeled with a single-color Qdot (Qdot 705) (Fig. 5B). Remarkably, analysis of the cumulative fluorescence intensity of the DNA-bound polymerases suggested that only one of the two polymerases remained on the DNA when RecBCD pushed them into one another (Fig. 5B). We conclude that, although RecBCD readily pushes single RNAP complexes along DNA, it does not appear to push two RNAPs at the same time. Instead, as predicted by the sequential eviction after collision model, one of the two polymerases quickly falls off the DNA when they collide with one another.
The results described above provide evidence that the sequential eviction after collision model may apply to RecBCD encounters with RNAPs in crowded settings. Importantly, the sequential eviction after collision model specifically predicts that the proximal polymerase should be preferentially evicted when pushed by RecBCD into the distal polymerase. We next sought to verify this prediction by determining which of two polymerases dissociated from the DNA when forced into one another by RecBCD. We, therefore, conducted two-color DNA curtain assays, in which separate aliquots of RNAP were labeled with either green (Qdot 605) or red (Qdot 705) Qdots. The differentially labeled polymerases were then mixed together and bound to the native phage promoters, unlabeled RecBCD was bound to the free DNA ends, and translocation was initiated by the injection of ATP. These experiments revealed that, for ∼96% of observed collisions (n = 50/52) involving RecBCD and two tandem molecules of RNAP, the proximal polymerase almost immediately dissociated from the DNA on being pushed into the distal polymerase (Fig. 5C). We conclude that RecBCD can rapidly and sequentially evict RNAP from crowded DNA and that it does so specifically by forcing the polymerases into one another.
Discussion
Our results show that RecBCD rapidly and sequentially removes crowded nucleoprotein complexes from crowded DNA by pushing them into one another. These findings reveal that molecular crowding itself can have a crucial and unanticipated influence on how molecular motor proteins clear nucleic acids of bound obstacles.
Molecular Crowding Alters the Mechanism of Protein Eviction by RecBCD.
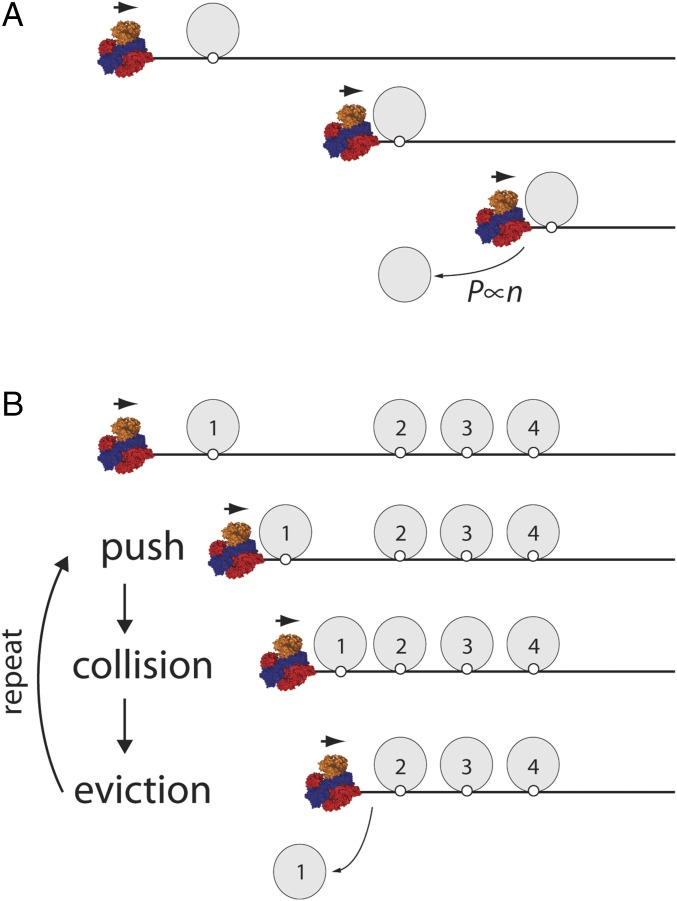
The mechanism by which RecBCD removes high-affinity nucleoprotein complexes from DNA is dependent on molecular crowding (Fig. 6). When RecBCD encounters isolated molecules of either EcoRIE111Q or RNAP on otherwise naked DNA, which tightly binds on specific binding sites before the encounter, it can push these proteins over average distances of 13,000 ± 9,100 and 10,460 ± 7,690 bp, respectively (19). The proteins eventually dissociate as they are forced to step between successive nonspecific binding sites, and the probability of dissociation is directly proportional to the number of steps that EcoRIE111Q or RNAP is forced to take while being pushed along the DNA (Fig. 6A) (19). However, the probability of dissociating during any given step is low, and as a consequence, RecBCD can push isolated proteins for extended distances on naked DNA (Fig. 6A). This outcome is in marked contrast to what takes place in crowded environments, where EcoRIE111Q and RNAP both dissociate almost immediately when pushed into more distal proteins or protein arrays (Fig. 6B). This much more rapid eviction takes place on crowded DNA specifically, because RecBCD pushes the proteins into one another. The striking differences between the outcomes of isolated collisions involving single-nucleoprotein complexes and the outcomes of collisions on crowded DNA highlight the dramatic and unexpected impact that molecular crowd has on the mechanism by which RecBCD interacts with nucleoprotein obstacles that it encounters while traveling along DNA. This sequential mechanism for protein eviction may likely reflect what takes place in vivo, where long tracts of naked DNA are unlikely to exist (41, 42). The general applicability of the sequential eviction after collision model for RecBCD is supported by the similarities between the experimental findings for EcoRIE111Q and E. coli RNAP. The significance of this mechanism is that it could serve to prevent RecBCD from being stalled by tightly bound obstacle proteins that might otherwise accumulate in front of the helicase as they translocate along DNA.
Fig. 6.
A generalized model for protein eviction in crowded environments. (A) RecBCD can push isolated proteins for extended distances along the otherwise naked DNA, and the probability of dissociation scales proportionally with the number of steps that the protein is forced to take as it is pushed by RecBCD (19). (B) In contrast, when RecBCD encounters proteins in crowded environments, it pushes each protein into its nearest adjacent neighbor, resulting in rapid dissociation of the proximal protein.
Sequential Removal of RNAP from DNA by RecBCD.
Interestingly, our work suggests that a small number of EcoRIE111Q complexes can accumulate in front of RecBCD before they start dissociating from the DNA. In contrast to EcoRIE111Q, it does not appear as though multiple molecules of RNAP can accumulate in front of RecBCD. Instead, the proximal polymerase dissociates from the DNA almost immediately on being pushed into a distal protein. These observations indicate that RecBCD removes RNAP from crowded DNA much more easily than it removes EcoRIE111Q. This difference may reflect the fact that RNAP is a naturally occurring obstacle that will likely be encountered whenever RecBCD acts on DNA in a cellular environment. We speculate that coevolution of RNAP and RecBCD may have tuned to relative binding strengths of these two nucleoprotein complexes to ensure that RNAP cannot impede the movement of RecBCD. Alternatively, the collision of RecBCD may induce some more specific structural transition within the RNAP complex, allowing it to be rapidly evicted from DNA by the action of RecBCD. Future work will be necessary to further define the molecular mechanisms that contribute to RNAP dissociation from DNA by RecBCD.
Mechanisms of Protein Dissociation.
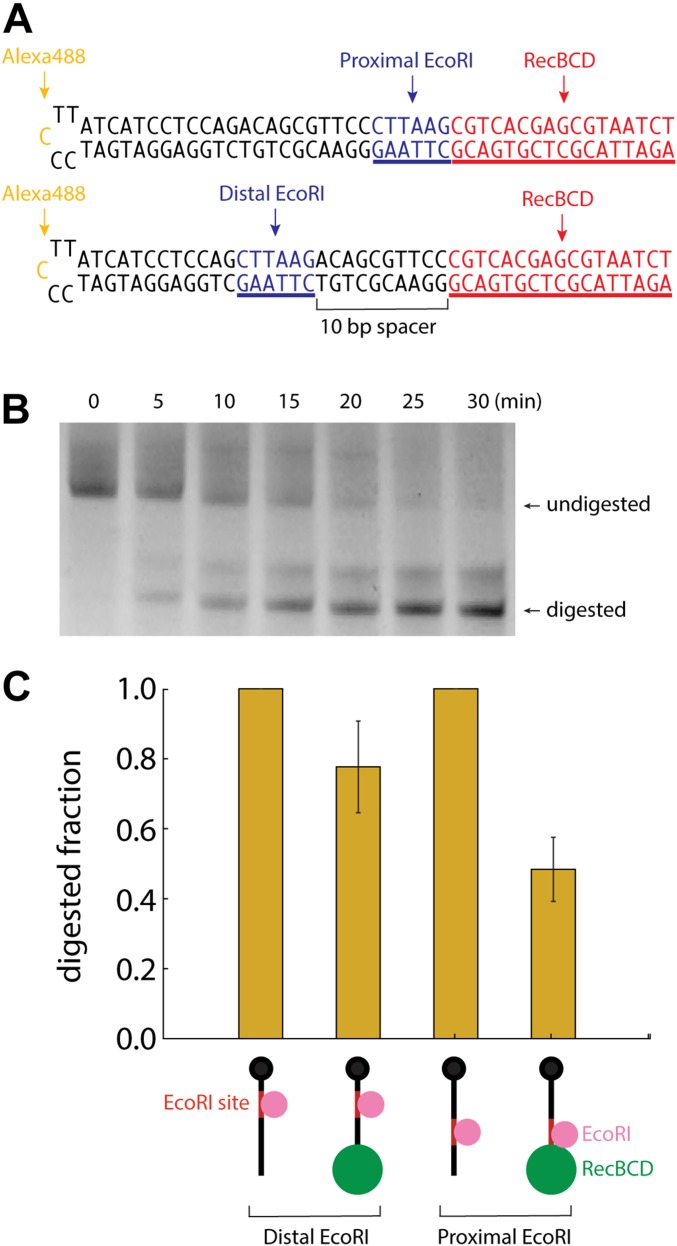
Through-DNA allosteric communication can influence the dissociation of stationary proteins that are bound in close spatial proximity to one another (43). Previous studies have shown that protein pairs, including glucocorticoid receptor and BamHI or lac repressor together with either EcoRV or T7 RNAP, exhibited up to fivefold changes in dissociation rates when the corresponding partner was bound to a nearby DNA site (43). These experimental findings have been attributed to through-DNA allosteric communication based on the long-range oscillatory changes in DNA major and minor groove widths observed in molecular dynamics simulations (43–45). Similarly, we find that a static RecBCD complex positioned immediately adjacent to an EcoRI site causes approximately a twofold reduction in DNA cleavage by EcoRI (Fig. S7). This reduction in cleavage is comparable in magnitude to the effects previously ascribed to the through-DNA allosteric model. However, this twofold effect is substantially less than the rapid dissociation rates observed as RecBCD traverses an array of EcoRIE111Q, suggesting that through-DNA allostery may not be a predominant factor affecting protein displacement by RecBCD. In addition, our experimental data show that, under crowded conditions, RecBCD causes rapid dissociation of the most proximal protein, but only when it is pushed into a more distal obstacle, indicating that crowded environments enhance protein dissociation by RecBCD relative to isolated collisions. The substantial increase in rate enhancement when RecBCD is moving through a protein array together with the dependence of proximal protein dissociation on the presence of a more distal obstacle suggest that the through-DNA allosteric model cannot account for RecBCD-mediated protein displacement under crowded conditions. Future work will be essential to further evaluate more detailed molecular insights into precisely how protein eviction from crowded environments and determine whether other types of DNA translocases may act similarly to RecBCD.
Fig. S7.
Digestion of DNA oligonucleotides by WT EcoRI in the presence and absence of RecBCD. (A) Schematic of the oligonucleotide substrates containing proximal and distal EcoRI binding sites. The EcoRI binding sites are shown in blue, and the RecBCD binding site is shown in red. (B) An example denaturing gel showing a time course of EcoRI digestion in the presence of (static) RecBCD. (C) The normalized signal intensity of digested fraction at 30 min is plotted for each substrate in the presence and absence of RecBCD. Error bars represent SD calculated from three independent experiments. In the cartoon depictions, the DNA is black, EcoRI binding sites are red, EcoRI is magenta, and the RecBCD molecules are green.
Nucleoprotein Obstacles and Genome Integrity.
Nucleoprotein complexes are the primary source of replication fork stalling (46), and their presence represents a major challenge to genome integrity (1, 37, 38, 47–49). Indeed, prokaryotic and eukaryotic replisomes both require accessory helicases to clear tightly bound proteins from DNA (25, 50–54). For instance, the E. coli replisome requires the accessory helicases Rep and UvrD to prevent replication fork collapse on encountering RNAP and other types of high-affinity nucleoprotein complexes (25, 46). Similarly, Bacillus subtilis requires the accessory helicase PcrA to facilitate replication fork progression through highly transcribed genes (52), and the helicases Pif1 and Rrm3 are required for efficient fork progression through difficult to replicate regions in Saccharomyces cerevisiae (55). In addition, Rep, UvrD, and Pif1 can all push isolated ssDNA binding proteins along ssDNA (56) using a mechanism that is similar in many respects to what takes place during RecBCD collisions with isolated proteins (19). However, the physical basis by which these accessory helicases assist the replisome remains unknown. One possibility is that they may strip proteins from crowded DNA through the mechanism similar to that used by RecBCD. Although many helicases including them have much lower translocation rates and processivity than RecBCD while acting on their own, the replisome itself is a highly processive molecular machine, and these helicases may act differently while working together with the replisome. Future work will be essential for further establishing how these replication accessory helicases (in both the presence and the absence of the replisome) and other types of motor proteins disrupt tightly bound nucleoprotein complexes on crowded nucleic acids.
Conclusion
We have presented a model describing the ability of RecBCD to sequentially clear crowded DNA of nucleoprotein complexes. The key feature of the sequential eviction after collision model is that RecBCD provokes rapid disruption of crowded nucleoprotein complexes by pushing these obstacles into one another. This model suggests that molecular crowding itself alters the mechanism by which RecBCD removes proteins from DNA. The sequential eviction after collision model suggests that ATP-dependent nucleic acid motor proteins can respond differently to encounters with isolated nucleoprotein complexes compared with encounters involving multiple nucleoprotein complexes. The general principles revealed from our studies with RecBCD may also apply to the behavior of other types of motor proteins as they travel along crowded nucleic acids.
Materials and Methods
KMC Simulations.
The KMC simulations included three kinds of molecules: the DNA, the translocase, and the roadblock protein. The DNA was a 1D track with 49 kbp in length. Within the simulations, the translocase moves along DNA at a fixed rate of 1,500 bp s–1 . The roadblock proteins bind to and dissociate from specific binding sites with a rate constant and dissociate from nonspecific binding sites with a rate constant . When the translocase encounters a roadblock protein, they make a complex (). The complex moves along DNA with a rate constant , where is the resistance experienced by the translocase as it pushes the roadblock protein, is the direction of movement, is the Boltzmann constant, and is temperature (310 K). Likewise, when the encounters the next roadblock protein, they make a larger complex . In this case, is dependent on the number of roadblock proteins bound to specific vs. nonspecific sites, such that , where and are the numbers of proteins bound to nonspecific and specific sites, respectively. and were set to 0.01 and 0.001 J mol–1, respectively. When the translocase encounters a roadblock protein, it can also induce the dissociation of the protein with the dissociation rate constant written as , where and are dissociation rate constants for proteins bound to nonspecific and specific binding site (set to 4.5 × 10⁻⁷ and 4.5 × 10⁻³ s–1, respectively), is the force necessary for the translocase to induce protein dissociation, and is the direction of dissociation.
In the initial setup, the translocase binds to one terminus of the DNA. A protein array composed of 5–50× specific binding sites at 40-bp intervals is located 15 kbp from the DNA end. Time evolution of the system was performed using the Gillespie algorithm. In this algorithm, we first calculate escape rate constant . Then, we calculate the time when a particular event takes place (; is random number; ) as well as the probability of each particular event (). The current time and state of the system are updated accordingly, and the procedure is repeated until the translocase reaches the opposite DNA end. The three different scenarios illustrated in Fig. 1A were realized by altering the parameter values for , , , and . For the accumulation model, we prohibit the protein dissociation by setting and . For the sequential model, we ensured more rapid protein dissociation on collision with the translocase by setting to 0.4 J mol–1. For the spontaneous dissociation model, we set and to prohibit additional movement of the translocase complex on encountering a protein until the protein spontaneously dissociates from the DNA. In this spontaneous dissociation model, the average pause duration can be analytically derived, and , where k is the rate constant for dissociation, and N(t) and N0 are the numbers of proteins bound to the array initially and at time t, respectively, in accord with the simulation result.
For the alternative variation of the accumulation model, we varied the parameter describing resistance of a roadblock protein on specific binding sites () while leaving the other model parameters at fixed values (). This setting allows us to change the relative rates of EcoRIE111Q dissociation and sliding, resulting in the accumulation of varying numbers of EcoRIE111Q in front of RecBCD before dissociation (Fig. S1A). Each different value of leads to the accumulation of a different number () of EcoRIE111Q proteins in front of RecBCD (Fig. S1B).
Proteins and DNA.
Biotinylated RecBCD was purified from E. coli JM109(DE3) cells cotransformed with plasmids for expression of RecC and RecBD with an avidity tag on the C terminus of RecD. The cells were grown in 2YT broth (16 g/L tryptone, 10 g/L yeast extract, and 5 g/L NaCl) to in the presence of 25 μg mL–1 Chloramphenicol and 100 μg mL–1 Carbenicillin. The media were then supplemented with 0.2 mM biotin, protein expression was induced by addition of 0.5 mM isopropyl-1-thio-β-d-galactopyranoside (IPTG), and cells were grown for an additional 16 h at 16 °C. Cells were then harvested by centrifugation, resuspended in lysis buffer (50 mM Tris⋅HCl, pH 7.5, 0.5 mM PMSF, 10% sucrose), and lysed by sonication. The lysate was clarified by centrifugation, and the supernatant was loaded onto the chitin column (New England Biolabs). The column was washed with buffer A (40 mM Tris⋅HCl, pH 7.5, 100 mM NaCl, 1 mM EDTA, 5% glycerol), and RecBCD was eluted with buffer B (40 mM Tris⋅HCl, pH 7.5, 100 mM NaCl, 1 mM EDTA, 5% glycerol, 50 mM DTT). After the purification, RecBCD was dialyzed into storage buffer containing 40 mM Tris⋅HCl, pH 7.5, 100 mM NaCl, 1 mM EDTA, and 35% glycerol, frozen on liquid nitrogen, and stored at –80 °C.
Catalytically inactive EcoRIE111Q bearing a flag epitope tag was expressed as a fusion construct linked to a self-cleaving intein and a chitin binding domain in E. coli HMS174(DE3) cells. The cells were grown in 2YT to in the presence of 100 μg mL–1 Carbenicillin. Protein expression was induced by the addition of 0.5 mM IPTG, and cells were grown for 4 h at 37 °C. Cells were then harvested, resuspended in lysis buffer (50 mM Tris⋅HCl, pH 7.5, 0.5 mM PMSF, 10% sucrose), and lysed by freezing and sonication. The lysate was clarified by centrifugation, and the supernatant was loaded onto a chitin column. The column was washed with buffer A (20 mM Tris⋅HCl, pH 8.5, 500 mM NaCl), and the cleaved protein was eluted with buffer B (20 mM Tris⋅HCl, pH 8.5, 500 mM NaCl, 50 mM DTT). The protein was dialyzed into storage buffer containing 40 mM Tris⋅HCl, pH 7.5, 300 mM NaCl, 10 mM 2-Mercaptoethanol, 0.1 mM EDTA, 50% glycerol, and 0.15% Triton X-100; frozen on liquid nitrogen; and stored at –80 °C. WT EcoRI was purchased from New England Biolabs.
E. coli RNAP containing an N-terminal 6-His tag and a C-terminal HA-tagged α-subunit was purified from E. coli BL21(DE3) as previously described (40). Cells were grown in LB to in the presence of 100 μg mL–1 Carbenicillin, expression was induced by addition of 0.5 mM IPTG, and cells were grown for an additional 4 h at 37 °C. Cells were harvested and resuspended in lysis buffer (50 mM Tris⋅HCl, pH 7.5, 10 mM EDTA, 5% glycerol, 1 mM DTT, 300 mM NaCl, 300 μg mL–1 Lysozyme), and they were then lysed by freezing and sonication. The lysate was clarified by centrifugation and fractionated with the addition of 0.350 g mL–1 ammonium sulfate. The precipitated protein was recovered by centrifugation, resuspended in buffer A (10 mM Tris⋅HCl, pH 7.5, 5% glycerol, 1 mM EDTA, 0.5 mM DTT), and loaded onto a High-Prep Heparin FF 16/10 column (GE Healthcare). The column was washed with buffer B (10 mM Tris⋅HCl, pH 7.5, 5% glycerol, 1 mM EDTA, 0.5 mM DTT, 300 mM NaCl) and then eluted with buffer C (10 mM Tris⋅HCl, pH 7.5, 5% glycerol, 1 mM EDTA, 0.5 mM DTT, 600 mM NaCl). The eluted protein was cleared by centrifugation and fractionated with the addition of 0.350 g mL–1 ammonium sulfate. The precipitated protein was recovered by centrifugation, resuspended in buffer D (10 mM Tris⋅HCl, pH 7.5, 5% glycerol, 1 mM EDTA, 0.5 mM DTT, 1 M NaCl), and loaded onto a HisTrap FF column (GE Healthcare). The column was washed with buffer D, and the protein was eluted with buffer E (10 mM Tris⋅HCl, pH 7.5, 5% glycerol, 1 mM EDTA, 0.5 mM DTT, 1 M NaCl, 500 mM imidazol). The eluted protein was diluted in the buffer A and loaded onto a MonoQ 5/50 GL column (GE Healthcare). The column was washed with the buffer F (10 mM Tris⋅HCl, pH 7.5, 5% glycerol, 1 mM EDTA, 0.5 mM DTT, 300 mM NaCl), and the protein was eluted with a linear gradient to buffer G (10 mM Tris⋅HCl, pH 7.5, 5% glycerol, 1 mM EDTA, 0.5 mM DTT, 500 mM NaCl). Purified RNAP was dialyzed into storage buffer (50 mM Tris⋅HCl, pH 7.5, 50% glycerol, 1 mM EDTA, 1 mM DTT, 250 mM NaCl) and stored at –80 °C.
A synthetic DNA fragment bearing five EcoRI binding sites (5′-GAATTC-3′) at 40-bp intervals was cloned into the SpeI and SalI sites of pUC19, and this plasmid (pUC19-5xEcoRI) was used as a starting point for constructing the larger arrays using a strategy similar to that originally used for generating long arrays of lac operator sites (57). The 5× array fragment has a single XbaI site near one end, and the 5xEcoRI fragment was excised by digestion with XbaI and SpeI and purified by agarose gel electrophoresis. A second aliquot of pUC19–5xEcoRI plasmid was linearized with XbaI and SalI, and the pUC19 backbone containing the 5xEcoRI binding site was also purified. Then, these two purified DNA fragments were ligated together to generate pUC19-10xEcoRI. Repetition of this procedure was used to generate pUC19-30xEcoRI and pUC19-50xEcoRI. The EcoRI arrays were then excised by digestion with SpeI and SalI and then cloned into the NheI and XhoI within the λ-genome. The resulting ligation products were packaged into phage particles using Gigapack III packaging extracts (catalog no. 200201; Agilent Technologies), and the resulting phage DNA was purified as previously described (40). All of the restriction enzymes and ligases were purchased from New England Biolabs.
Single-Molecule Imaging.
Single-molecule experiments were conducted using a custom-built total internal reflection microscope and DNA curtains as previously described (19, 58). In brief, a biotinylated λ-DNA molecules were anchored to a supported lipid bilayer on the surface of a microfluidic sample chamber through a biotin–streptavidin linkage as previously described (19, 58). The DNA molecules were then pushed by buffer flow into nanofabricated chromium barriers, which disrupt the bilayer and allow the anchored DNA molecules to align with one another on the sample chamber surface.
For RecBCD experiments, the sample chambers were preequilibrated with RecBCD buffer (40 mM Tris⋅HCl, pH 7.5, 2 mM MgCl2, 0.2 mg mL–1 Pluronic). The sample chamber was then blocked by the addition of RecBCD buffer supplemented with 10 μM free biotin. Biotinylated RecBCD was labeled with streptavidin-coated 705 Qdots (catalog no. Q10163MP; Thermo Fisher Scientific). Qdot-tagged RecBCD (10 nM) in 100 μL of RecBCD buffer was then injected into the sample chamber and incubated for 20 min to allow binding. Free RecBCD was then flushed from the sample chamber, and translocation was initiated by the addition of RecBCD buffer supplemented with 1 mM ATP while collecting images at 5.0 Hz. All RecBCD experiments were conducted at 37 °C. We have previously reported a single pre-Chi RecBCD velocity of 1,484 ± 167 bp/s based on n = 100 molecules of RecBCD (19). Here, we find two populations with velocities of 745 ± 37 bp/s (corresponding to the expected velocity of RecB) and 1,368 ± 18 bp/s (corresponding to the expected velocity of RecD) based on n = 269 molecules of RecBCD. We believe that the second slower population is now observable within the data simply because of the larger number of experimental observations, and we suspect that this small population reflects a subset of complexes in which RecD is inactivated. Therefore, we only provide a collision analysis of RecBCD complexes that exhibited translocation velocities of >1,000 bp/s. In future work, we hope to more fully analyze the slower population as well as perform a detailed analysis of pre- and post-Chi behaviors.
Unlabeled EcoRIE111Q Experiments.
For assays using Qdot RecBCD and unlabeled EcoRIE111Q (Fig. 2), the λ-DNA substrates (150 pM) bearing different size EcoRI arrays were preincubated with EcoRIE111Q before injecting the DNA into the sample chambers. The amount of EcoRIE111Q used in the assays was sufficient to saturate each array, and the amount of protein used in each experiment scaled with the size of the array as follows: 5× array, 5 nM EcoRIE111Q; 10× array, 10 nM EcoRIE111Q; 30× array, 30 nM EcoRIE111Q; and 50× array, 50 nM EcoRIE111Q. All preincubations were conducted in 100 µL of EcoRI buffer (40 mM Tris⋅HCl, pH 7.5, 150 mM NaCl, 10 mM MgCl2, 0.2 mg mL–1 Pluronic). The binding reactions were then diluted into 1 mL of RecBCD buffer, injected into the flow cell, and incubated for an additional 30 min. Free DNA and excess EcoRIE111Q were then flushed from the sample chambers using RecBCD buffer. Qdot-tagged RecBCD was then injected into the sample chambers, and translocation was initiated by the addition of 1 mM ATP as described above.
Single-Color EcoRIE111Q Experiments.
For DNA curtain assays using unlabeled RecBCD and Qdot-tagged EcoRIE111Q (Figs. 3 and 4), the unlabeled EcoRIE111Q was preincubated with the λ-DNA and then injected into the flow cell as described above. The DNA-bound EcoRIE111Q molecules were then labeled with anti-FLAG antibody-conjugated Qdots by injecting the Qdots (10 nM) into the flow cell followed by a 5-min incubation before flushing the unbound Qdots from the sample chamber. The antibody-conjugated Qdots were prepared using the SiteClick Qdot Antibody Labeling Kit (catalog no. S10469 for Qdot 605 and catalog No. S10454 for Qdot 705; Thermo Fisher Scientific).
Two-Color EcoRIE111Q Experiments.
λ-DNA (150 pM) with a 5× EcoRI binding site array was preincubated with 5 nM EcoRIE111Q in 100 μL of EcoRI buffer (40 mM Tris⋅HCl, pH 7.5, 150 mM NaCl, 10 mM MgCl2, 0.2 mg mL–1 Pluronic). The reaction was then diluted to a total volume of 1 mL in RecBCD buffer, injected into a flow cell, and incubated for an additional 30 min. Free DNA and EcoRIE111Q were then flushed out of the sample chamber. The DNA-bound EcoRIE111Q was then labeled by injecting anti-FLAG antibody-conjugated Qdots (5 nM) with different emission maxima (605 or 705 nm; colored green and magenta in all kymographs) followed by a 5-min incubation. RecBCD was then loaded onto the DNA, translocation was initiated by the addition of 1 mM ATP, and data were collected as described above. Note that the binding distributions of “magenta” and “green” EcoRIE111Q were random and that reaction trajectories, in which the two colors were appropriately segregated between the 5× arrays and 1× native binding sites, were selected by visual inspection (Fig. 4).
Experiments with RNAP.
WT λ-DNA (150 pM) was diluted to a total volume of 1 mL in RNAP buffer (40 mM Tris⋅HCl, pH 7.5, 100 mM KCl, 2 mM MgCl2, 0.2 mg mL–1 Pluronic), injected into the flow cell, and incubated for 30 min, and then, free DNA was flushed away. HA-tagged RNAP (500 pM) was then injected into the sample chamber in RNAP buffer and incubated for 10 min. The DNA-bound RNAP was labeled by injection of anti-HA–conjugated Qdots (10 nM). For single-color experiments, RNAP was labeled with only one-color Qdots (Qdot 705). For two-color experiments, the labeling reaction included an equimolar mixture of two different colored Qdots (Qdot 705 and Qdot 605) (Fig. 5). Heparin (0.2 mg mL–1) was included in the labeling buffer to ensure removal of any nonspecifically bound RNAP, and reactions were incubated for 5 min. RecBCD was then loaded onto the DNA, translocation was initiated by the addition of 1 mM ATP, and data were collected as described above.
Through-DNA Allosteric Inhibition by RecBCD.
Previous studies have shown that through-DNA allosteric communication can reduce the affinity of site-specific DNA binding proteins by up to a factor of five (43). Therefore, we devised a bulk biochemical measurement to determine whether (static) RecBCD might inhibit the binding of EcoRI to a nearby site, which would be consistent with the through-DNA allosteric model (Fig. S7). For this aim, we designed hairpin oligonucleotides labeled with Alexa488 for detection. The oligonucleotides contained a free blunt end for binding RecBCD and a single EcoRI cleavage located either immediately adjacent to RecBCD (proximal) or separated by a 10-bp spacer from the RecBCD binding site (distal). The oligonucleotides were incubated at 95 °C for 10 min and then cooled at room temperature for 1 h. The annealed oligonucleotides were then preincubated for 10 min with RecBCD in 18 μL of buffer containing 40 mM Tris⋅HCl, pH 7.5, and 2 mM MgCl2. Cleavage reactions were initiated by the addition of 2.0 μL of 10 μM WT EcoRI. Aliquots (2 μL) were then transferred to new tubes containing termination buffer (90% formamide, 0.5% EDTA, 0.1% orange G) at the indicated time intervals. Samples were resolved on 10% denaturing urea polyacrylamide gels at 200 V for 50 min. The Alexa488 signal was detected with a Typhoon FLA 7000 (GE Healthcare), and images were analyzed using ImageJ (https://imagej.nih.gov/ij/). Data were analyzed by plotting the normalized signal intensity of the 30-min time points in the presence and absence of RecBCD. The results of these experiments show that DNA cleavage by EcoRI slows in the presence of RecBCD and that the effect is greater for the proximal vs. distal EcoRI substrate, and the relative magnitude of these effects are consistent with previous studies of through-DNA allosteric inhibition (43).
Acknowledgments
We thank members of the laboratory of E.C.G. for discussion and assistance throughout this work, and we thank Shoji Takada, Jayil Lee, Daniel Duzdevich, Fabian Erdel, Corentin Moevus, Kyle Kaniecki, Chu Jian Ma, Johannes Stigler, Justin Steinfeld, Luisina De Tullio, and Mayu S. Terakawa for comments on the manuscript. The data described in this manuscript are archived in the laboratory of E.C.G. This work was supported by a Japan Society for the Promotion of Science fellowship (to T.T.), NIH Fellowship F32GM101819 (to T.D.S.), and NIH Grant R35GM118026 (to E.C.G.).
Footnotes
The authors declare no conflict of interest.
This article is a PNAS Direct Submission.
This article contains supporting information online at www.pnas.org/lookup/suppl/doi:10.1073/pnas.1701368114/-/DCSupplemental.
References
- 1.Helmrich A, Ballarino M, Nudler E, Tora L. Transcription-replication encounters, consequences and genomic instability. Nat Struct Mol Biol. 2013;20:412–418. doi: 10.1038/nsmb.2543. [DOI] [PubMed] [Google Scholar]
- 2.Jankowsky E, Gross CH, Shuman S, Pyle AM. Active disruption of an RNA-protein interaction by a DExH/D RNA helicase. Science. 2001;291:121–125. doi: 10.1126/science.291.5501.121. [DOI] [PubMed] [Google Scholar]
- 3.Pyle AM. Translocation and unwinding mechanisms of RNA and DNA helicases. Annu Rev Biophys. 2008;37:317–336. doi: 10.1146/annurev.biophys.37.032807.125908. [DOI] [PubMed] [Google Scholar]
- 4.Byrd AK, Raney KD. Protein displacement by an assembly of helicase molecules aligned along single-stranded DNA. Nat Struct Mol Biol. 2004;11:531–538. doi: 10.1038/nsmb774. [DOI] [PubMed] [Google Scholar]
- 5.Marquis KA, et al. SpoIIIE strips proteins off the DNA during chromosome translocation. Genes Dev. 2008;22:1786–1795. doi: 10.1101/gad.1684008. [DOI] [PMC free article] [PubMed] [Google Scholar]
- 6.Narlikar GJ, Sundaramoorthy R, Owen-Hughes T. Mechanisms and functions of ATP-dependent chromatin-remodeling enzymes. Cell. 2013;154:490–503. doi: 10.1016/j.cell.2013.07.011. [DOI] [PMC free article] [PubMed] [Google Scholar]
- 7.Bintu L, et al. Nucleosomal elements that control the topography of the barrier to transcription. Cell. 2012;151:738–749. doi: 10.1016/j.cell.2012.10.009. [DOI] [PMC free article] [PubMed] [Google Scholar]
- 8.Symington LS, Heyer WD. Some disassembly required: Role of DNA translocases in the disruption of recombination intermediates and dead-end complexes. Genes Dev. 2006;20:2479–2486. doi: 10.1101/gad.1477106. [DOI] [PubMed] [Google Scholar]
- 9.Petesch SJ, Lis JT. Overcoming the nucleosome barrier during transcript elongation. Trends Genet. 2012;28:285–294. doi: 10.1016/j.tig.2012.02.005. [DOI] [PMC free article] [PubMed] [Google Scholar]
- 10.Dillingham MS, Kowalczykowski SC. RecBCD enzyme and the repair of double-stranded DNA breaks. Microbiol Mol Biol Rev. 2008;72:642–671. doi: 10.1128/MMBR.00020-08. [DOI] [PMC free article] [PubMed] [Google Scholar]
- 11.Smith GR. How RecBCD enzyme and Chi promote DNA break repair and recombination: A molecular biologist’s view. Microbiol Mol Biol Rev. 2012;76:217–228. doi: 10.1128/MMBR.05026-11. [DOI] [PMC free article] [PubMed] [Google Scholar]
- 12.Wigley DB. RecBCD: The supercar of DNA repair. Cell. 2007;131:651–653. doi: 10.1016/j.cell.2007.11.004. [DOI] [PubMed] [Google Scholar]
- 13.Singleton MR, Dillingham MS, Wigley DB. Structure and mechanism of helicases and nucleic acid translocases. Annu Rev Biochem. 2007;76:23–50. doi: 10.1146/annurev.biochem.76.052305.115300. [DOI] [PubMed] [Google Scholar]
- 14.Wigley DB. Bacterial DNA repair: Recent insights into the mechanism of RecBCD, AddAB and AdnAB. Nat Rev Microbiol. 2013;11:9–13. doi: 10.1038/nrmicro2917. [DOI] [PubMed] [Google Scholar]
- 15.De Septenville AL, Duigou S, Boubakri H, Michel B. Replication fork reversal after replication-transcription collision. PLoS Genet. 2012;8:e1002622. doi: 10.1371/journal.pgen.1002622. [DOI] [PMC free article] [PubMed] [Google Scholar]
- 16.Levy A, et al. CRISPR adaptation biases explain preference for acquisition of foreign DNA. Nature. 2015;520:505–510. doi: 10.1038/nature14302. [DOI] [PMC free article] [PubMed] [Google Scholar]
- 17.Spies M, Amitani I, Baskin RJ, Kowalczykowski SC. RecBCD enzyme switches lead motor subunits in response to chi recognition. Cell. 2007;131:694–705. doi: 10.1016/j.cell.2007.09.023. [DOI] [PMC free article] [PubMed] [Google Scholar]
- 18.Spies M, et al. A molecular throttle: The recombination hotspot chi controls DNA translocation by the RecBCD helicase. Cell. 2003;114:647–654. doi: 10.1016/s0092-8674(03)00681-0. [DOI] [PubMed] [Google Scholar]
- 19.Finkelstein IJ, Visnapuu ML, Greene EC. Single-molecule imaging reveals mechanisms of protein disruption by a DNA translocase. Nature. 2010;468:983–987. doi: 10.1038/nature09561. [DOI] [PMC free article] [PubMed] [Google Scholar]
- 20.Eggleston AK, O’Neill TE, Bradbury EM, Kowalczykowski SC. Unwinding of nucleosomal DNA by a DNA helicase. J Biol Chem. 1995;270:2024–2031. doi: 10.1074/jbc.270.5.2024. [DOI] [PubMed] [Google Scholar]
- 21.Wright DJ, King K, Modrich P. The negative charge of Glu-111 is required to activate the cleavage center of EcoRI endonuclease. J Biol Chem. 1989;264:11816–11821. [PubMed] [Google Scholar]
- 22.Epshtein V, Toulmé F, Rahmouni AR, Borukhov S, Nudler E. Transcription through the roadblocks: The role of RNA polymerase cooperation. EMBO J. 2003;22:4719–4727. doi: 10.1093/emboj/cdg452. [DOI] [PMC free article] [PubMed] [Google Scholar]
- 23.Nudler E, Kashlev M, Nikiforov V, Goldfarb A. Coupling between transcription termination and RNA polymerase inchworming. Cell. 1995;81:351–357. doi: 10.1016/0092-8674(95)90388-7. [DOI] [PubMed] [Google Scholar]
- 24.Pavco PA, Steege DA. Characterization of elongating T7 and SP6 RNA polymerases and their response to a roadblock generated by a site-specific DNA binding protein. Nucleic Acids Res. 1991;19:4639–4646. doi: 10.1093/nar/19.17.4639. [DOI] [PMC free article] [PubMed] [Google Scholar]
- 25.Guy CP, et al. Rep provides a second motor at the replisome to promote duplication of protein-bound DNA. Mol Cell. 2009;36:654–666. doi: 10.1016/j.molcel.2009.11.009. [DOI] [PMC free article] [PubMed] [Google Scholar]
- 26.Byrd AK, Raney KD. Displacement of a DNA binding protein by Dda helicase. Nucleic Acids Res. 2006;34:3020–3029. doi: 10.1093/nar/gkl369. [DOI] [PMC free article] [PubMed] [Google Scholar]
- 27.Noom MC, van den Broek B, van Mameren J, Wuite GJ. Visualizing single DNA-bound proteins using DNA as a scanning probe. Nat Methods. 2007;4:1031–1036. doi: 10.1038/nmeth1126. [DOI] [PubMed] [Google Scholar]
- 28.Bianco PR, et al. Processive translocation and DNA unwinding by individual RecBCD enzyme molecules. Nature. 2001;409:374–378. doi: 10.1038/35053131. [DOI] [PubMed] [Google Scholar]
- 29.Liu B, Baskin RJ, Kowalczykowski SC. DNA unwinding heterogeneity by RecBCD results from static molecules able to equilibrate. Nature. 2013;500:482–485. doi: 10.1038/nature12333. [DOI] [PMC free article] [PubMed] [Google Scholar]
- 30.Ishihama A. Functional modulation of Escherichia coli RNA polymerase. Annu Rev Microbiol. 2000;54:499–518. doi: 10.1146/annurev.micro.54.1.499. [DOI] [PubMed] [Google Scholar]
- 31.Herbert KM, Greenleaf WJ, Block SM. Single-molecule studies of RNA polymerase: Motoring along. Annu Rev Biochem. 2008;77:149–176. doi: 10.1146/annurev.biochem.77.073106.100741. [DOI] [PMC free article] [PubMed] [Google Scholar]
- 32.Liu B, Alberts BM. Head-on collision between a DNA replication apparatus and RNA polymerase transcription complex. Science. 1995;267:1131–1137. doi: 10.1126/science.7855590. [DOI] [PubMed] [Google Scholar]
- 33.Liu B, Wong ML, Alberts B. A transcribing RNA polymerase molecule survives DNA replication without aborting its growing RNA chain. Proc Natl Acad Sci USA. 1994;91:10660–10664. doi: 10.1073/pnas.91.22.10660. [DOI] [PMC free article] [PubMed] [Google Scholar]
- 34.Liu B, Wong ML, Tinker RL, Geiduschek EP, Alberts BM. The DNA replication fork can pass RNA polymerase without displacing the nascent transcript. Nature. 1993;366:33–39. doi: 10.1038/366033a0. [DOI] [PubMed] [Google Scholar]
- 35.Pomerantz RT, O’Donnell M. The replisome uses mRNA as a primer after colliding with RNA polymerase. Nature. 2008;456:762–766. doi: 10.1038/nature07527. [DOI] [PMC free article] [PubMed] [Google Scholar]
- 36.Pomerantz RT, O’Donnell M. Direct restart of a replication fork stalled by a head-on RNA polymerase. Science. 2010;327:590–592. doi: 10.1126/science.1179595. [DOI] [PMC free article] [PubMed] [Google Scholar]
- 37.McGlynn P, Savery NJ, Dillingham MS. The conflict between DNA replication and transcription. Mol Microbiol. 2012;85:12–20. doi: 10.1111/j.1365-2958.2012.08102.x. [DOI] [PubMed] [Google Scholar]
- 38.Merrikh H, Zhang Y, Grossman AD, Wang JD. Replication-transcription conflicts in bacteria. Nat Rev Microbiol. 2012;10:449–458. doi: 10.1038/nrmicro2800. [DOI] [PMC free article] [PubMed] [Google Scholar]
- 39.Mirkin EV, Mirkin SM. Replication fork stalling at natural impediments. Microbiol Mol Biol Rev. 2007;71:13–35. doi: 10.1128/MMBR.00030-06. [DOI] [PMC free article] [PubMed] [Google Scholar]
- 40.Wang F, et al. The promoter-search mechanism of Escherichia coli RNA polymerase is dominated by three-dimensional diffusion. Nat Struct Mol Biol. 2013;20:174–181. doi: 10.1038/nsmb.2472. [DOI] [PMC free article] [PubMed] [Google Scholar]
- 41.Ali Azam T, Iwata A, Nishimura A, Ueda S, Ishihama A. Growth phase-dependent variation in protein composition of the Escherichia coli nucleoid. J Bacteriol. 1999;181:6361–6370. doi: 10.1128/jb.181.20.6361-6370.1999. [DOI] [PMC free article] [PubMed] [Google Scholar]
- 42.Wang W, Li GW, Chen C, Xie XS, Zhuang X. Chromosome organization by a nucleoid-associated protein in live bacteria. Science. 2011;333:1445–1449. doi: 10.1126/science.1204697. [DOI] [PMC free article] [PubMed] [Google Scholar]
- 43.Kim S, et al. Probing allostery through DNA. Science. 2013;339:816–819. doi: 10.1126/science.1229223. [DOI] [PMC free article] [PubMed] [Google Scholar]
- 44.Dršata T, Zgarbová M, Jurečka P, Šponer J, Lankaš F. On the use of molecular dynamics simulations for probing allostery through DNA. Biophys J. 2016;110:874–876. doi: 10.1016/j.bpj.2015.12.039. [DOI] [PMC free article] [PubMed] [Google Scholar]
- 45.Dršata T, et al. Mechanical model of DNA allostery. J Phys Chem Lett. 2014;5:3831–3835. doi: 10.1021/jz501826q. [DOI] [PubMed] [Google Scholar]
- 46.Gupta MK, et al. Protein-DNA complexes are the primary sources of replication fork pausing in Escherichia coli. Proc Natl Acad Sci USA. 2013;110:7252–7257. doi: 10.1073/pnas.1303890110. [DOI] [PMC free article] [PubMed] [Google Scholar]
- 47.Lambert S, Watson A, Sheedy DM, Martin B, Carr AM. Gross chromosomal rearrangements and elevated recombination at an inducible site-specific replication fork barrier. Cell. 2005;121:689–702. doi: 10.1016/j.cell.2005.03.022. [DOI] [PubMed] [Google Scholar]
- 48.Mizuno K, Miyabe I, Schalbetter SA, Carr AM, Murray JM. Recombination-restarted replication makes inverted chromosome fusions at inverted repeats. Nature. 2013;493:246–249. doi: 10.1038/nature11676. [DOI] [PMC free article] [PubMed] [Google Scholar]
- 49.Sankar TS, Wastuwidyaningtyas BD, Dong Y, Lewis SA, Wang JD. The nature of mutations induced by replication–transcription collisions. Nature. 2016;535:178–181. doi: 10.1038/nature18316. [DOI] [PMC free article] [PubMed] [Google Scholar]
- 50.Azvolinsky A, Giresi PG, Lieb JD, Zakian VA. Highly transcribed RNA polymerase II genes are impediments to replication fork progression in Saccharomyces cerevisiae. Mol Cell. 2009;34:722–734. doi: 10.1016/j.molcel.2009.05.022. [DOI] [PMC free article] [PubMed] [Google Scholar]
- 51.Sabouri N, McDonald KR, Webb CJ, Cristea IM, Zakian VA. DNA replication through hard-to-replicate sites, including both highly transcribed RNA Pol II and Pol III genes, requires the S. pombe Pfh1 helicase. Genes Dev. 2012;26:581–593. doi: 10.1101/gad.184697.111. [DOI] [PMC free article] [PubMed] [Google Scholar]
- 52.Merrikh CN, Brewer BJ, Merrikh H. The B. subtilis Accessory Helicase PcrA Facilitates DNA Replication through Transcription Units. PLoS Genet. 2015;11:e1005289. doi: 10.1371/journal.pgen.1005289. [DOI] [PMC free article] [PubMed] [Google Scholar]
- 53.Rothstein R, Michel B, Gangloff S. Replication fork pausing and recombination or “gimme a break.”. Genes Dev. 2000;14:1–10. [PubMed] [Google Scholar]
- 54.Alzu A, et al. Senataxin associates with replication forks to protect fork integrity across RNA-polymerase-II-transcribed genes. Cell. 2012;151:835–846. doi: 10.1016/j.cell.2012.09.041. [DOI] [PMC free article] [PubMed] [Google Scholar]
- 55.Geronimo CL, Zakian VA. Getting it done at the ends: Pif1 family DNA helicases and telomeres. DNA Repair (Amst) 2016;44:151–158. doi: 10.1016/j.dnarep.2016.05.021. [DOI] [PMC free article] [PubMed] [Google Scholar]
- 56.Sokoloski JE, Kozlov AG, Galletto R, Lohman TM. Chemo-mechanical pushing of proteins along single-stranded DNA. Proc Natl Acad Sci USA. 2016;113:6194–6199. doi: 10.1073/pnas.1602878113. [DOI] [PMC free article] [PubMed] [Google Scholar]
- 57.Robinett CC, et al. In vivo localization of DNA sequences and visualization of large-scale chromatin organization using lac operator/repressor recognition. J Cell Biol. 1996;135:1685–1700. doi: 10.1083/jcb.135.6.1685. [DOI] [PMC free article] [PubMed] [Google Scholar]
- 58.Greene EC, Wind S, Fazio T, Gorman J, Visnapuu ML. DNA curtains for high-throughput single-molecule optical imaging. Methods Enzymol. 2010;472:293–315. doi: 10.1016/S0076-6879(10)72006-1. [DOI] [PMC free article] [PubMed] [Google Scholar]


