Significance
Metabolic myopathies resulting from defects in skeletal muscle energy metabolism represent a spectrum of disorders that are typically mild at rest and unmasked with exercise. Although the genetic basis for many metabolic myopathies is known, their management remains challenging in part because we have an incomplete understanding of the biochemical pathogenesis. Here we applied plasma metabolic profiling to capture a holistic picture of metabolism at rest and with exercise in two metabolic myopathies that restrict oxidative metabolism: McArdle disease, characterized by defective glycogen fuel mobilization, and mitochondrial disease, characterized by a defective respiratory chain. Our work provides insights into how biochemistry is remodeled in these two disorders, revealing candidate biomarkers that may prove to have clinical utility.
Keywords: mitochondria, McArdle disease, exercise physiology, metabolic profiling, TCA expansion
Abstract
McArdle disease and mitochondrial myopathy impair muscle oxidative phosphorylation (OXPHOS) by distinct mechanisms: the former by restricting oxidative substrate availability caused by blocked glycogen breakdown, the latter because of intrinsic respiratory chain defects. We applied metabolic profiling to systematically interrogate these disorders at rest, when muscle symptoms are typically minimal, and with exercise, when symptoms of premature fatigue and potential muscle injury are unmasked. At rest, patients with mitochondrial disease exhibit elevated lactate and reduced uridine; in McArdle disease purine nucleotide metabolites, including xanthine, hypoxanthine, and inosine are elevated. During exercise, glycolytic intermediates, TCA cycle intermediates, and pantothenate expand dramatically in both mitochondrial disease and control subjects. In contrast, in McArdle disease, these metabolites remain unchanged from rest; but urea cycle intermediates are increased, likely attributable to increased ammonia production as a result of exaggerated purine degradation. Our results establish skeletal muscle glycogen as the source of TCA cycle expansion that normally accompanies exercise and imply that impaired TCA cycle flux is a central mechanism of restricted oxidative capacity in this disorder. Finally, we report that resting levels of long-chain triacylglycerols in mitochondrial myopathy correlate with the severity of OXPHOS dysfunction, as indicated by the level of impaired O2 extraction from arterial blood during peak exercise. Our integrated analysis of exercise and metabolism provides unique insights into the biochemical basis of these muscle oxidative defects, with potential implications for their clinical management.
Metabolic myopathies arise from inherited or acquired defects in skeletal muscle energy production. Impairments can occur at a variety of nodes in metabolism, ranging from fuel mobilization in the cytosol to ATP production via mitochondrial oxidative phosphorylation (OXPHOS). Often these patients’ symptoms are minimal or absent at rest, but are unmasked with exercise, resulting in fatigue, weakness, or muscle injury. Although the root genetic basis of many of these disorders is known, the broader metabolic consequences and implications for pathophysiology and effective therapy remain incompletely understood. Here, we apply the power of metabolic profiling to investigate both at rest and with exercise two contrasting oxidative myopathies: McArdle disease and mitochondrial myopathy.
McArdle disease is an autosomal recessive myopathy caused by mutations in the muscle isoform of glycogen phosphorylase (PYGM). Patients lack the enzyme required to mobilize glucose-1-phosphate from skeletal muscle glycogen (1, 2) and present with exercise-induced muscle fatigue and rhabdomyolysis. With exercise, lactate levels fail to rise (2) and impaired ADP phosphorylation causes increased AMP production and degradation, with an exaggerated rise in ammonia as a result of the combined action of adenylate kinase and adenylate deaminase (3). It has been hypothesized that patients with McArdle disease have impaired OXPHOS, because of reduced substrate delivery to mitochondria (4).
Mitochondrial myopathies are caused by inherited or acquired lesions in the OXPHOS system and can be caused by mutations in mitochondrial (mtDNA) or nuclear genomes. Diagnosis is challenging but can often be secured by molecular testing or through skeletal muscle enzyme analysis. A small number of metabolites, including elevated lactate, can serve as biomarkers of disease, although sensitivity and specificity are limited. Previous studies have shown that during exercise, peripheral oxygen extraction is impaired and oxygen delivery is exaggerated in these patients (5). This impairment in peripheral oxygen extraction during exercise can serve as one of the few quantitative measures of mitochondrial disease severity (5–7).
Although previous studies, including our own, have applied metabolic profiling to investigate disorders of energy metabolism, none have applied this new technology to these patients both at rest and with exercise. Exercise is a powerful, whole-body physiological stressor that is able to unmask clinical symptoms and biochemical differences that are otherwise not apparent. In principle, such an analysis could reveal which metabolic fuel pathways are used to compensate for inherited lesions and also reveal biomarkers that track disease severity and progression and motivate novel therapeutic strategies.
Results
We combined exercise phenotyping and metabolic profiling in a cohort of patients with genetically proven McArdle disease or with mitochondrial myopathy. We recruited a total of 21 patients with mitochondrial myopathy (Mito), 12 patients with McArdle disease, and 12 control subjects (Table 1 and Table S1). Testing was repeated in some subjects, allowing us to assess variability across replicates (Table S1). Of our 21 mitochondrial myopathy subjects, 19 had mutations in mtDNA and 2 had mutations in the nuclear gene ISCU (8).
Table 1.
Cohort demographic characteristics
| Demographic | n Unique | Age, y | % Male | Height, cm | Weight, kg | BMI, kg/m2 | Venous lactate at rest, mM | Creatine kinase at rest, U/L |
| Controls | 12 | 34 ± 10 | 33 | 169 ± 10 | 68 ± 11 | 24 ± 3 | 0.93 ± 0.26 | 115 ± 12 |
| Mito patients | 21 | 44 ± 9 | 29 | 166 ± 7 | 68 ± 14 | 25 ± 4 | 1.45 ± 0.59 | 191 ± 21 |
| McArdle patients | 12 | 35 ± 19 | 58 | 173 ± 9 | 76 ± 17 | 25 ± 5 | 0.75 ± 0.23 | 7,027 ± 13,679 |
Values are expressed as mean ± SD.
Table S1.
Demographic and clinical characteristics of patients
| Patient ID | Diagnosis | Severity | Gender | Age,y | Height, cm | Weight, kg | BMI, kg/m2 | Test | Venous lactate, mM | Venous potassium,mEq/L | Creatine kinase, U/L | Exercise testing |
| Mitochondrial myopathy | ||||||||||||
| Mi-1 | mtDNA del | Moderate | F | 45 | 165.1 | 81.4 | 29.8 | A | 0.97 | 4 | 182 | Yes |
| Mi-2 | mtDNA del | Moderate | F | 42 | 165.1 | 94.5 | 34.7 | A | 0.99 | 4.9 | 401 | Yes |
| B | 0.97 | 4.4 | 89 | |||||||||
| Mi-3 | mtDNA del | Moderate | M | 49 | 162.6 | 57.3 | 21.7 | A | 0.95 | 4.1 | 112 | Yes |
| Mi-4 | m.3243A>G | Severe | F | 25 | 154.9 | 42.7 | 17.8 | A | 2.09 | 4.4 | 301 | Yes |
| Mi-5 | mtDNA del | Moderate | F | 36 | 167.6 | 75.0 | 26.7 | A | 0.88 | 5.6 | 145 | Yes |
| B | 0.94 | 4.3 | 106 | |||||||||
| Mi-6 | mtDNA del | Moderate | F | 45 | 165.1 | 70.9 | 26.0 | A | 1.08 | 4.6 | 162 | No |
| B | 1.00 | 4.5 | 166 | |||||||||
| Mi-7 | m.10010T>C | Severe | M | 32 | 175.3 | 95.5 | 31.1 | A | 2.95 | 4.4 | 614 | Yes |
| Mi-8 | m.12261T>C | Mild | F | 58 | 162.6 | 60.9 | 23.0 | B | 0.98 | 3.8 | 36 | Yes |
| Mi-9 | ISCU | Severe | M | 43 | 180.3 | 80.0 | 24.6 | A | 1.01 | 3.5 | 329 | Yes |
| B | 1.41 | 3.6 | 501 | |||||||||
| Mi-10 | mtDNA del | Moderate | F | 27 | 175.3 | 76.8 | 25.0 | A | 1.21 | 3.8 | 92 | Yes |
| B | 1.59 | 4.1 | 62 | |||||||||
| Mi-11 | ISCU | Severe | M | 42 | 177.8 | 85.0 | 26.9 | A | 1.51 | 4.5 | 108 | Yes |
| B | 2.06 | 4.2 | 119 | |||||||||
| Mi-12 | m.4281A>G | Moderate | F | 40 | 165.1 | 71.4 | 26.2 | A | 0.6 | 4 | 120 | Yes |
| B | 0.55 | 4.4 | 131 | |||||||||
| Mi-13 | m.3243A>G | Moderate | F | 44 | 160.0 | 55.0 | 21.5 | A | 1.64 | 5.1 | 191 | Yes |
| Mi-14 | MT-CYTB | Severe | F | 38 | 160.0 | 57.7 | 22.5 | A | 1.50 | 3.9 | 116 | Yes |
| Mi-15 | mtDNA del | Moderate | F | 41 | 157.5 | 59.1 | 23.8 | A | 1.63 | 4.9 | 145 | No |
| Mi-16 | m.8344A>G | Severe | F | 45 | 162.6 | 65.9 | 24.9 | A | 1.68 | 4.8 | 92 | No |
| Mi-17 | Mult mtDNA del | Moderate | F | 52 | 167.6 | 55.9 | 19.9 | A | 1.01 | 3.8 | 126 | No |
| Mi-18 | Mult mtDNA del | F | 56 | 157.5 | 63.6 | 25.7 | A | 1.28 | 3.7 | 73 | No | |
| Mi-19 | m.3243A>G | Mild | F | 47 | 160.0 | 51.4 | 20.1 | A | 1.44 | 3.3 | 271 | Yes |
| B | 2.03 | 3.3 | 330 | |||||||||
| Mi-20 | m.5543T>C | Severe | M | 64 | 167.6 | 76.4 | 27.2 | A | 2.72 | 4.5 | 193 | Yes |
| B | 2.39 | 4.3 | 266 | |||||||||
| Mi-21 | mtDNA del | Moderate | M | 43 | 170.2 | 61.4 | 21.2 | A | 1.03 | 4 | 186 | Yes |
| B | 1.39 | 4.1 | 729 | |||||||||
| McArdle disease | ||||||||||||
| Mc-1 | F | 32 | 175.3 | 88.2 | 28.7 | A | 0.62 | 3.8 | 1,531 | Yes | ||
| Mc-2 | M | 16 | 172.7 | 62.3 | 20.9 | A | 1.30 | 3.9 | NA | Yes | ||
| Mc-3 | M | 18 | 175.3 | 61.4 | 20.0 | A | 0.83 | 4.1 | 42,528 | Yes | ||
| Mc-4 | M | 71 | 180.3 | 77.3 | 23.8 | A | 0.53 | 4 | 505 | No | ||
| Mc-5 | M | 19 | 177.8 | 75.5 | 23.9 | A | 0.68 | 3.6 | 4,470 | Yes | ||
| Mc-6 | F | 23 | 165.1 | 61.6 | 22.6 | A | 0.67 | 4.1 | 29,040 | Yes | ||
| B | 0.51 | 3.9 | 3,852 | |||||||||
| Mc-7 | M | 19 | 185.4 | 93.6 | 27.2 | A | 0.67 | 4.1 | NA | Yes | ||
| Mc-8 | F | 40 | 157.5 | 59.1 | 23.8 | A | 0.7 | 3.7 | 6,960 | Yes | ||
| Mc-9 | F | 54 | 160.0 | 53.6 | 20.9 | A | 0.72 | NA | 288 | Yes | ||
| Mc-10 | F | 53 | 165.1 | 100.0 | 36.7 | A | 0.45 | 3.9 | 2,014 | Yes | ||
| Mc-11 | M | 19 | 177.8 | 75.0 | 23.7 | A | 0.91 | 3.7 | 2,556 | Yes | ||
| Mc-12 | M | 54 | 182.9 | 105.0 | 31.4 | A | 0.95 | 4.6 | NA | No | ||
Exercise testing, whether the patient underwent exercise testing; BMI, body mass index; ISCU, mutation in the nuclear-encoded ISCU gene; M/F, male/female; MT-CYTB, mutation in mtDNA cytochrome b; mtDNA del, mtDNA deltion; mult mtDNA del, multiple mtDNA deletions; NA, not applicable; Test A/B, first or second exercise test;.
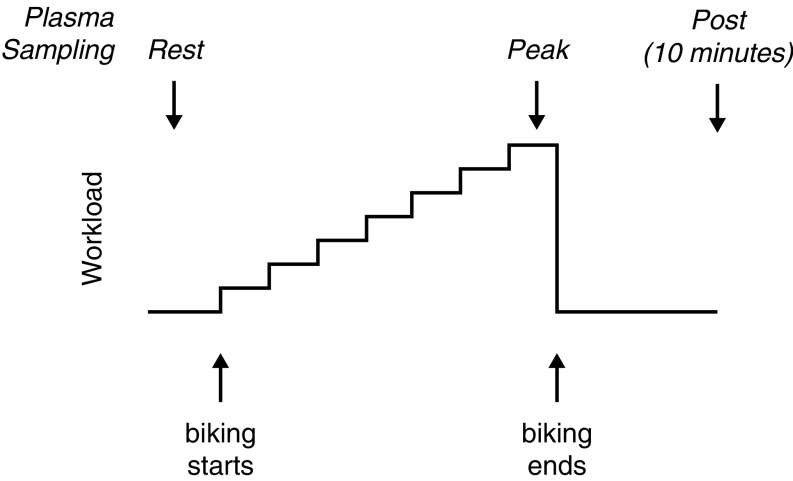
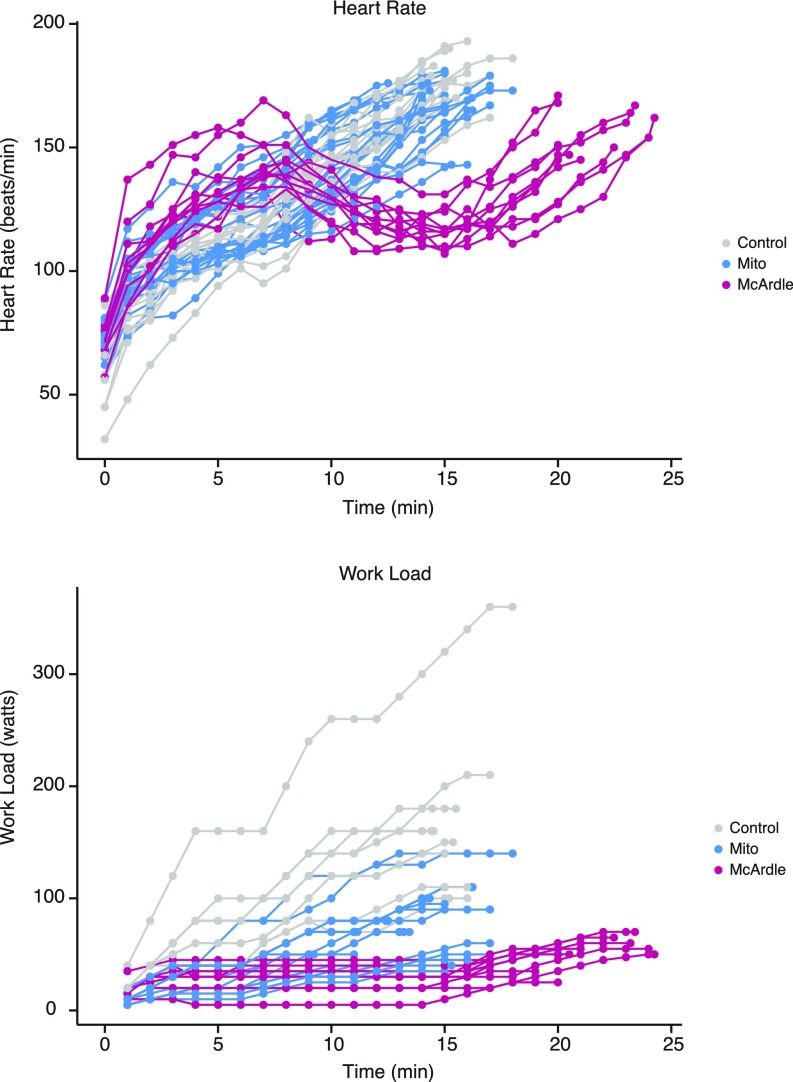
All participants performed a graded, maximal cycle exercise challenge, as previously described (Fig. S1) (5). During the trial, workload increased every 1–2 min until the subject achieved maximal heart rate or self-reported exhaustion, typically within 10–20 min (Fig. S2). Physiological parameters were measured throughout testing (5). McArdle patients exhibited biphasic heart rate trajectories in which heart rates dropped after an initial increase before rising again, reflecting the second wind that is typical of this disorder (Fig. S2) (4). Blood samples were collected at three points: rest, peak exercise, and 10-min postexercise.
Fig. S1.
Exercise protocol and plasma sampling. Steps show stationary bike workload (measured in Watts) increasing stepwise throughout the exercise test, until subject reached his/her peak workload. Upward arrows denote the beginning and end of exercise; the precise number of minutes exercised varied by individual. Downward arrows denote timing of plasma sample collection.
Fig. S2.
Time series of heart rates and workloads. Lines show the heart rate and workload data for each exercise trial in the study. Parameters were recorded at regular intervals shown by dots. Note that to avoid exertional muscle injuries, McArdle patients first acclimated for 15 min at a lower exercise intensity before the start of their trial; this enabled their second wind phenomenon to occur (indicated by the drop in heart rate), which allowed them to achieve workloads more comparable to controls.
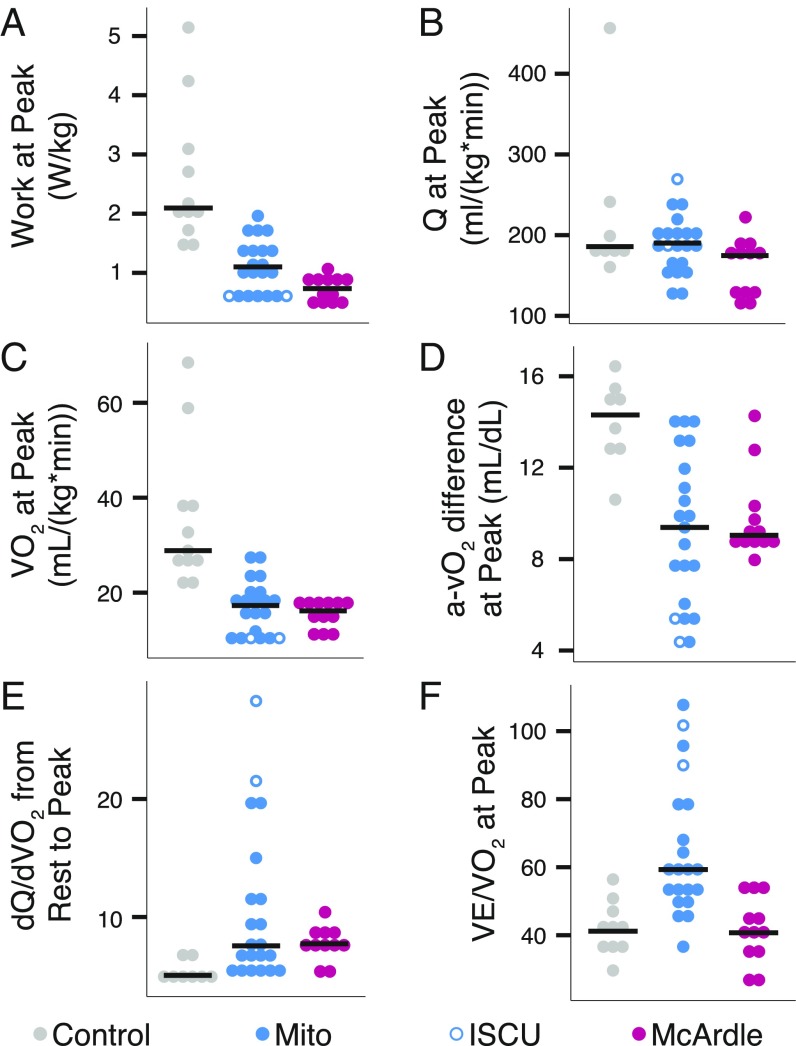
Our exercise testing recapitulated previous observations of McArdle and Mito patients (5, 9). Neither patient group was able to perform as much work as controls (Fig. 1A) (5, 10–12), despite nearly equivalent peak cardiac output (Q) (Fig. 1B). At peak exercise, controls achieved higher oxygen consumption than either Mito or McArdle (Fig. 1C). This difference in the ability to consume oxygen was marked by substantially lower oxygen extraction in Mito and McArdle patients, as indicated by low peak systemic arteriovenous oxygen difference (a-vO2 difference) (Fig. 1D). This inability to extract oxygen occurred despite higher dQ/dVO2 (Fig. 1E) (5), underscoring a profound defect in oxygen extraction relative to delivery in both patient groups. Mito patients also had significantly less-efficient breathing, with greater ventilation at peak per liter of oxygen used for work (Fig. 1F).
Fig. 1.
Exercise physiology in patients with mitochondrial myopathy or McArdle disease. Dot plots for individual exercise tests showing (A) work, (B) cardiac output (Q), (C) oxygen uptake (VO2), (D) systemic arteriovenous oxygen difference (a-vO2), (E) the slope of the increase in cardiac output relative to the increase in oxygen utilization during exercise, and (F) ventilation (VE) relative to VO2 at maximal exercise. Horizontal lines denote median value by group. A permutation test showed the patient cohorts were all significantly different from the control group (p < 0.05) except for Mito in B and McArdle group in F.
Metabolic Profiles at Rest.
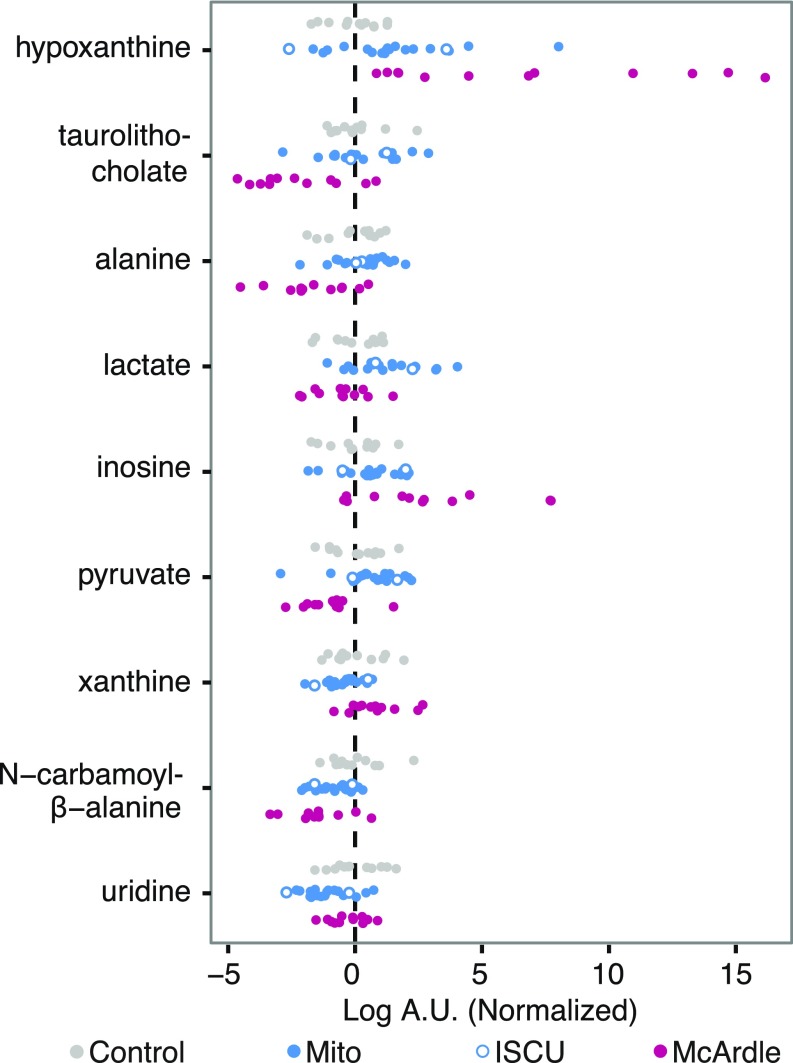
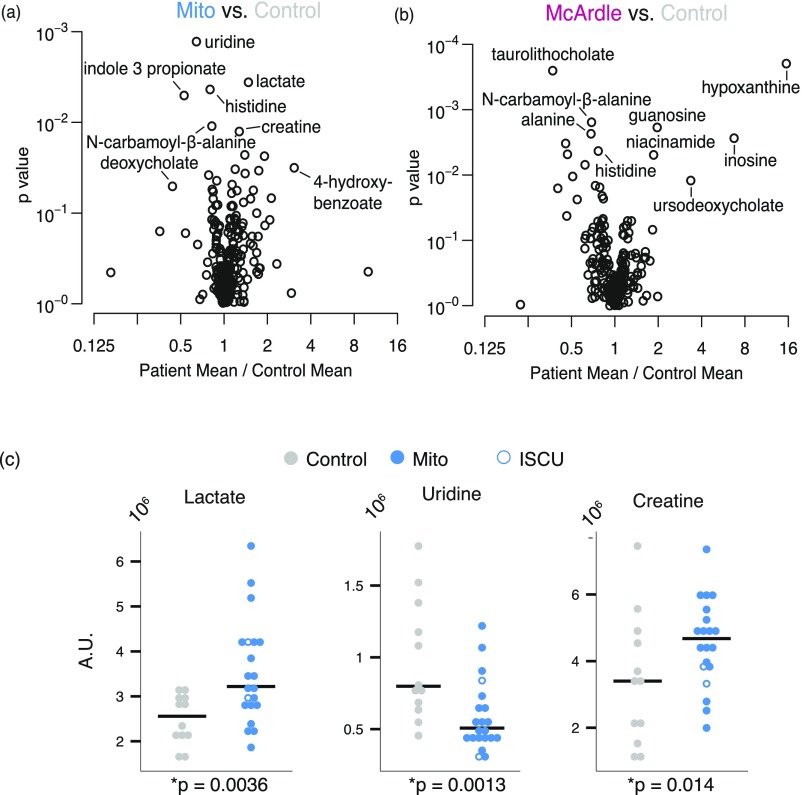
We use a previously described metabolic profiling platform (13–17) that interrogates 242 metabolites, including 132 polar and 110 lipids (Table S2). We began by identifying metabolites whose levels at rest differed between patient and control groups. We compared the mean of each metabolite level (log-transformed intensity) between groups and used a significance threshold such that the estimated false-discovery rate was less than 5% (18). This high-stringency criterion highlighted nine metabolites that differed between the cohorts (Fig. 2). As expected, lactate—the classic marker of mitochondrial dysfunction—was significantly elevated in Mito patients relative to controls, and tended to be lower (but not reaching significance) in McArdle patients. The related metabolites alanine and pyruvate were significantly decreased in McArdle patients. As expected, several members of the purine nucleotide cycle and recycling pathway, such as hypoxanthine, xanthine, and inosine, were significantly elevated at rest in McArdle patients. A previous study showed that uridine levels are reduced in mitochondrial myopathy (13), a result that we now replicate (Fig. 2). Moreover, we find that the uridine breakdown product, N-carbamoyl-β-alanine, is reduced in Mito patients as well as in McArdle patients. Creatine has previously been shown to be elevated in mitochondrial myopathy. Although it did not reach significance in the three-way analysis, it did reach nominal significance in comparisons between patient groups and controls (Fig. S3 A and C).
Table S2.
List of all metabolites measured in this study
| Method | Metabolite | Method | Metabolite | Method | Metabolite | Method | Metabolite |
| HILIC | Glycine | IPR | 2-Aminodipate | LIPID | CE-16:1 | LIPID | SM-23:1 |
| HILIC | Alanine | IPR | 3-Hydroxykynurenate* | LIPID | CE-16:0 | LIPID | SM-23:0 |
| HILIC | Serine | IPR | 4-Hydroxybenzoate | LIPID | CE-18:3 | LIPID | SM-24:1 |
| HILIC | Threonine | IPR | 4-Pyridoxate | LIPID | CE-18:2 | LIPID | SM-24:0 |
| HILIC | Methionine | IPR | 5-HIAA | LIPID | CE-18:1 | LIPID | TAG-42:0 |
| HILIC | Glutamate | IPR | Acetoacetate | LIPID | CE-18:0 | LIPID | TAG-44:2 |
| HILIC | Asparagine | IPR | Aconitate | LIPID | CE-20:5 | LIPID | TAG-44:1 |
| HILIC | Glutamine | IPR | Adenine | LIPID | CE-20:4 | LIPID | TAG-44:0 |
| HILIC | Histidine | IPR | Adipate/α-ketoglutarate | LIPID | CE-20:3 | LIPID | TAG-46:4 |
| HILIC | Arginine | IPR | ADP | LIPID | CE-22:6 | LIPID | TAG-46:3 |
| HILIC | Lysine | IPR | α-Glycerophosphate | LIPID | DAG-36:3 | LIPID | TAG-46:2 |
| HILIC | Valine | IPR | AMP | LIPID | DAG-36:2 | LIPID | TAG-46:1 |
| HILIC | Leucine | IPR | cAMP | LIPID | DAG-36:1* | LIPID | TAG-46:0 |
| HILIC | Isoleucine | IPR | Carboxyethyllysine (CEL) | LIPID | LPC-14:0* | LIPID | TAG-48:4 |
| HILIC | Phenylalanine | IPR | cGMP | LIPID | LPC-16:1 | LIPID | TAG-48:3 |
| HILIC | Tyrosine | IPR | Chenodeoxycholate | LIPID | LPC-16:0 | LIPID | TAG-48:2 |
| HILIC | Tryptophan | IPR | Cholate | LIPID | LPC-18:2 | LIPID | TAG-48:1 |
| HILIC | Proline | IPR | Citrate | LIPID | LPC-18:1 | LIPID | TAG-48:0 |
| HILIC | cis/trans-hydroxyproline | IPR | CMP | LIPID | LPC-18:0 | LIPID | TAG-50:5 |
| HILIC | Ornithine | IPR | Cystathionine | LIPID | LPC-20:4 | LIPID | TAG-50:4 |
| HILIC | Citrulline | IPR | Cytidine* | LIPID | LPC-22:6 | LIPID | TAG-50:3 |
| HILIC | Taurine | IPR | dCMP* | LIPID | LPE-18:2 | LIPID | TAG-50:2 |
| HILIC | Serotonin | IPR | Deoxycholate | LIPID | LPE-18:1 | LIPID | TAG-50:1 |
| HILIC | GABA | IPR | DHAP | LIPID | LPE-18:0 | LIPID | TAG-52:7 |
| HILIC | Dimethylglycine | IPR | dUMP* | LIPID | PC-32:2 | LIPID | TAG-52:6 |
| HILIC | ADMA | IPR | F16DP/F26DP/G16DP | LIPID | PC-32:1 | LIPID | TAG-52:5 |
| HILIC | SDMA | IPR | F1P | LIPID | PC-32:0 | LIPID | TAG-52:4 |
| HILIC | NMMA | IPR | Fructose/glucose/galactose | LIPID | PC-34:4 | LIPID | TAG-52:3 |
| HILIC | Allantoin | IPR | Fumarate | LIPID | PC-34:3 | LIPID | TAG-52:2 |
| HILIC | Aminoisobutyric acid | IPR | GDP | LIPID | PC-34:2 | LIPID | TAG-52:1 |
| HILIC | Anthranilic acid | IPR | Glucuronate | LIPID | PC-34:1 | LIPID | TAG-54:8 |
| HILIC | Carnitine | IPR | Glutathione-oxidized | LIPID | PC-34:0 | LIPID | TAG-54:7 |
| HILIC | Kynurenic acid | IPR | Glyceraldehyde-3-phosphate | LIPID | PC-36:4 | LIPID | TAG-54:6 |
| HILIC | 3-Hydroxyanthranilic acid | IPR | Glycochenodeoxycholate | LIPID | PC-36:3 | LIPID | TAG-54:5 |
| HILIC | N-carbamoyl-β-alanine | IPR | Glycocholate | LIPID | PC-36:2 | LIPID | TAG-54:4 |
| HILIC | Thiamine | IPR | Glycodeoxycholate | LIPID | PC-36:1 | LIPID | TAG-54:3 |
| HILIC | Niacinamide | IPR | GMP | LIPID | PC-38:6 | LIPID | TAG-54:2 |
| HILIC | Betaine | IPR | Guanosine | LIPID | PC-38:5 | LIPID | TAG-54:1 |
| HILIC | Choline | IPR | Hippurate | LIPID | PC-38:4 | LIPID | TAG-56:9 |
| HILIC | Phosphocholine | IPR | Homocystine | LIPID | PC-38:3 | LIPID | TAG-56:8 |
| HILIC | Phosphoethanolamine | IPR | Homogentistate* | LIPID | PC-38:2 | LIPID | TAG-56:7 |
| HILIC | α-Glycerophosphocholine | IPR | Homovanillate | LIPID | PC-40:6 | LIPID | TAG-56:6 |
| HILIC | Acetylcholine | IPR | Hydroxyphenylacetate | LIPID | PE-34:1 | LIPID | TAG-56:5 |
| HILIC | Creatine | IPR | Hydroxyphenylpyruvate | LIPID | PE-34:0 | LIPID | TAG-56:4 |
| HILIC | Creatinine | IPR | Hyodeoxycholate | LIPID | PE-36:2 | LIPID | TAG-56:3 |
| HILIC | Triiodothyronine | IPR | Hypoxanthine | LIPID | PE-36:1 | LIPID | TAG-56:2 |
| HILIC | Thyroxine | IPR | IMP | LIPID | SM-14:0 | LIPID | TAG-58:12 |
| HILIC | Trimethylamine-N-oxide | IPR | Indole-3-propionate | LIPID | SM-16:1 | LIPID | TAG-58:11 |
| HILIC | Glycerol | IPR | Indoleacetate | LIPID | SM-16:0 | LIPID | TAG-58:10 |
| HILIC | Adenosine | IPR | Indolelactate | LIPID | SM-18:1 | LIPID | TAG-58:9 |
| HILIC | Cytosine | IPR | Indoxylsulfate | LIPID | SM-18:0 | LIPID | TAG-58:8 |
| HILIC | 2′-Deoxycytidine* | IPR | Inosine | LIPID | SM-20:1 | LIPID | TAG-58:7 |
| HILIC | cAMP | IPR | Isocitrate | LIPID | SM-20:0 | LIPID | TAG-60:12 |
| IPR | Kynurenine | LIPID | SM-21:0 | LIPID | TAG-60:11 | ||
| IPR | Lactate | LIPID | SM-22:1 | LIPID | TAG-60:10 | ||
| IPR | Lactose | LIPID | SM-22:0 | LIPID | TAG-60:9 | ||
| IPR | Malate | ||||||
| IPR | Maleate | ||||||
| IPR | Malonate | ||||||
| IPR | NAD | ||||||
| IPR | Nicotinate* | ||||||
| IPR | Orotate | ||||||
| IPR | Pantothenate | ||||||
| IPR | PEP | ||||||
| IPR | Phenylacetylglycine* | ||||||
| IPR | Phosphocreatine | ||||||
| IPR | Phosphoglycerate | ||||||
| IPR | Propionate | ||||||
| IPR | Pyruvate | ||||||
| IPR | Salicylurate | ||||||
| IPR | Sorbitol | ||||||
| IPR | Succinate/methylmalonate | ||||||
| IPR | Sucrose | ||||||
| IPR | Taurochenodeoxycholate | ||||||
| IPR | Taurocholate | ||||||
| IPR | Taurodeoxycholate | ||||||
| IPR | Taurolithocholate | ||||||
| IPR | Thymine | ||||||
| IPR | UDP | ||||||
| IPR | UDP-galactose/UDP-glucose | ||||||
| IPR | UMP | ||||||
| IPR | Uracil | ||||||
| IPR | Urate | ||||||
| IPR | Uridine | ||||||
| IPR | Ursodeoxycholate | ||||||
| IPR | VMA | ||||||
| IPR | Xanthine |
Metabolites were analyzed with three LC-MS methods. Polar metabolites were detected in (i) positive ion mode with a hydrophilic interaction liquid chromatography (HILIC) method and (ii) negative ion mode with an ion-pairing chromatography (IPC) method. Lipids were profiled using a reverse phase method. In total 252 metabolites were detected: 53 metabolites were detected with the HILIC method, 87 with IPC, and 112 with the lipid method. Ten metabolites were excluded because measurements failed in 80% of the samples, and are identified with an asterisk after their name.
Fig. 2.
Plasma metabolites at rest in patients with mitochondrial myopathy or McArdle disease. Scatterplots of metabolites whose mean levels at rest significantly differed among the three subject groups ordered top to bottom by statistical significance. The measurements are in logged arbitrary units (A.U.) and normalized to the mean and variance of the control group.
Fig. S3.
Individual group comparison and validation of biomarkers for mitochondrial disease. (A and B) Volcano plots showing the spectrum of metabolic differences in the pairwise comparisons between (A) Mito patients vs. controls and (B) McArdle patients vs. controls. The x axis shows the ratio of the mean patient value to the mean control value, plotted against the p value for the test of equal means in both groups. (C) Resting measurements of lactate, uridine, and creatine that were identified both in this study and previous studies as distinguishing Mito from control.
Metabolic Profiles in Response to Exercise.
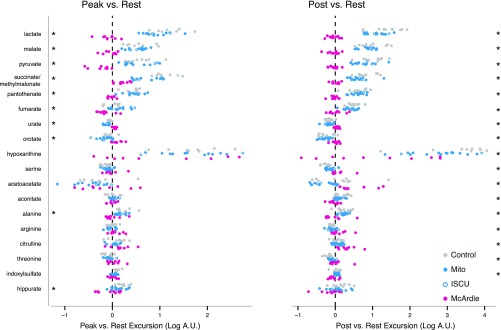
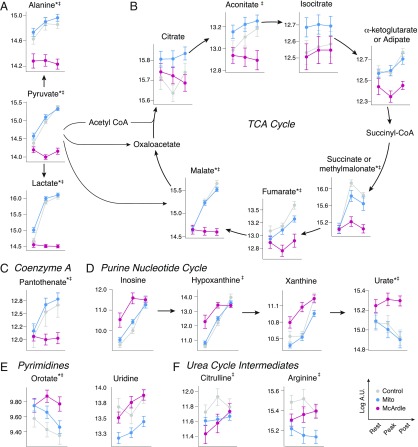
To determine how the metabolic response to exercise varied across our patient and control cohorts, we used an approach similar to the above, except rather than test for a difference in the mean metabolite intensity we tested for differences between the mean “excursions” (or deltas) that occurred with exercise. The comparison between peak and rest (peak/rest) identified 10 metabolites with significantly different deltas (Fig. S4). The comparison between postexercise and rest levels (post/rest) identified 17 metabolites that underwent different excursions (Fig. S4), including 9 of the 10 metabolites identified by the peak/rest comparison (Fig. S4). The metabolites identified through these peak/rest and post/rest comparisons were associated with several metabolic pathways, including pyruvate metabolism, the TCA cycle, the urea cycle, and the purine nucleotide cycle. Selected metabolites from these pathways are rendered in Fig. 3.
Fig. S4.
Exercise-induced changes in plasma metabolites among the three groups. Scatter plots showing metabolites whose average change between exercise time points was not equal across the three groups as described in the main text. Metabolite excursions from rest to peak are shown on the Left, whereas excursions from rest to postexercise are shown on the Right. The 10 metabolites with significantly different changes at peak/rest are starred on the Left, whereas the 17 metabolites with significantly different changes at post/rest are starred on the Right.
Fig. 3.
(A–F) Metabolic pathways whose metabolites change with exercise in patients with mitochondrial myopathy or McArdle disease. Metabolite levels during exercise shown for those in pathways found to have significantly different excursions in the post/rest comparison. The measurements are in logged arbitrary units (A.U.). Metabolites with significantly different excursions from rest to peak are indicated by an asterisk (*); those that significantly differ from rest to post are indicated by a double dagger (‡).
Our approach identified pyruvate along with its products lactate and alanine as undergoing different excursions with exercise. In stark contrast to controls and Mito patients, levels of these metabolites in McArdle patients do not increase with exercise (Fig. 3A). Although Mito patients had higher resting lactate than controls, exercise levels were approximately the same; the difference in mean lactate between controls and Mito patients at postexercise is only 60% of the difference at rest, and is no longer statistically significant (Fig. 3A).
Previous studies have shown that exercise induces a striking elevation in circulating levels of “span 2” TCA cycle intermediates in muscle (19) and blood (14). In the present study we found that both controls and Mito patients showed strong exercise-induced elevations in plasma malate, fumarate, aconitate, and succinate/methylmalonate. However, these metabolites were essentially unchanged with exercise in McArdle patients (Fig. 3B). Even the other TCA cycle intermediates and their precursors tended to be lower in McArdle patients following exercise, although the differences in the excursions did not exceed our statistical threshold. Notably, pantothenate, a precursor to CoA, correlated strongly to TCA cycle intermediates, expanding with exercise in both peak/rest and post/rest in controls and Mito patients, but remaining virtually unchanged in McArdle patients (Fig. 3C).
We observed several exercise-induced changes that likely reflect purine and pyrimidine degradation during exercise. The purine nucleotide cycle and AMP degradation products hypoxanthine, xanthine, and inosine consistently increased with exercise in the controls and both patient groups (Fig. 3D). However, the magnitude of these excursions differed across the different groups, largely because some of the metabolites were already elevated at rest in McArdle (Fig. 2). In contrast, the pyrimidine uridine is reduced at rest in Mito patients (Fig. S3), although the magnitude of increase with exercise was comparable across the three groups (Fig. 3E). We note that another pyrimidine, orotate, decreases in controls and Mito patients but is relatively unchanged in McArdle patients (Fig. 3E).
An important byproduct of AMP degradation is ammonia, which must be cleared via the urea cycle. Ammonia levels are known to rise with exercise in patients with McArdle disease. Interestingly, the post/rest comparison revealed arginine and citrulline, both urea cycle intermediates, also increase in McArdle patients but have distinctly different responses in Mito and controls (Fig. 3F and Fig. S4).
Metabolic Excursions Occur Along Two Key Axes.
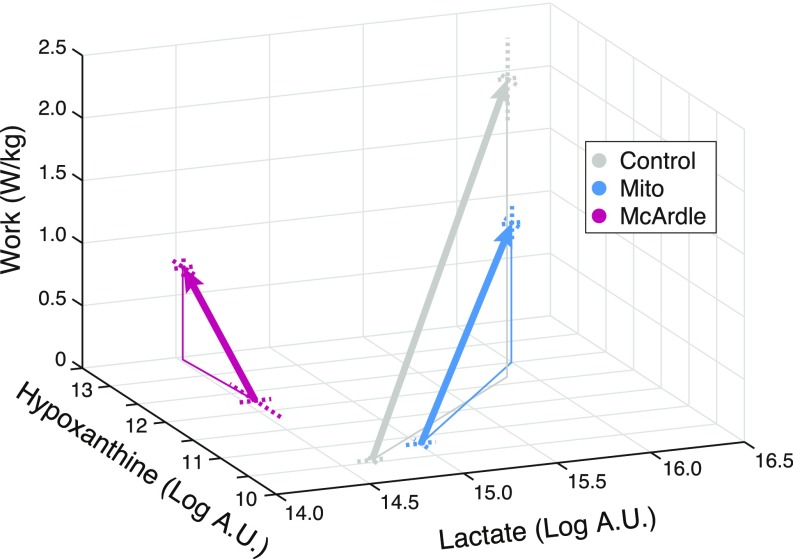
Our unbiased approach indicated the prominent metabolic differences induced by exercise in our three cohorts occurred largely in two metabolic pathways: (i) the glycolysis/TCA cycle and (ii) purine nucleotide recycling. To understand how the metabolic differences in our cohorts related to the amount of work they performed, we plotted a representative metabolite from each pathway—lactate and hypoxanthine, respectively—as a function of work performed in each cohort (Fig. 4). At rest, Mito patients have higher lactate, whereas McArdle patients have markedly higher hypoxanthine. Although Mito patients performed on average 43% as much work as controls (z axis in Fig. 4), their peak lactate and hypoxanthine levels were essentially indistinguishable, giving them parallel trajectories offset along the work axis (Fig. 4). McArdle patients performed on average 28% as much work as controls and show no change in the lactate dimension; however, their Peak hypoxanthine level rises above their resting level by a comparable amount as controls and Mitos.
Fig. 4.
Exercise-induced trajectories for lactate and hypoxanthine as a function of work. Mean values of lactate and hypoxanthine are plotted at rest and at peak. Dashed lines indicate SEs.
Long-Chain Triacylglycerols Are Predictive of Mitochondrial Disease Severity.
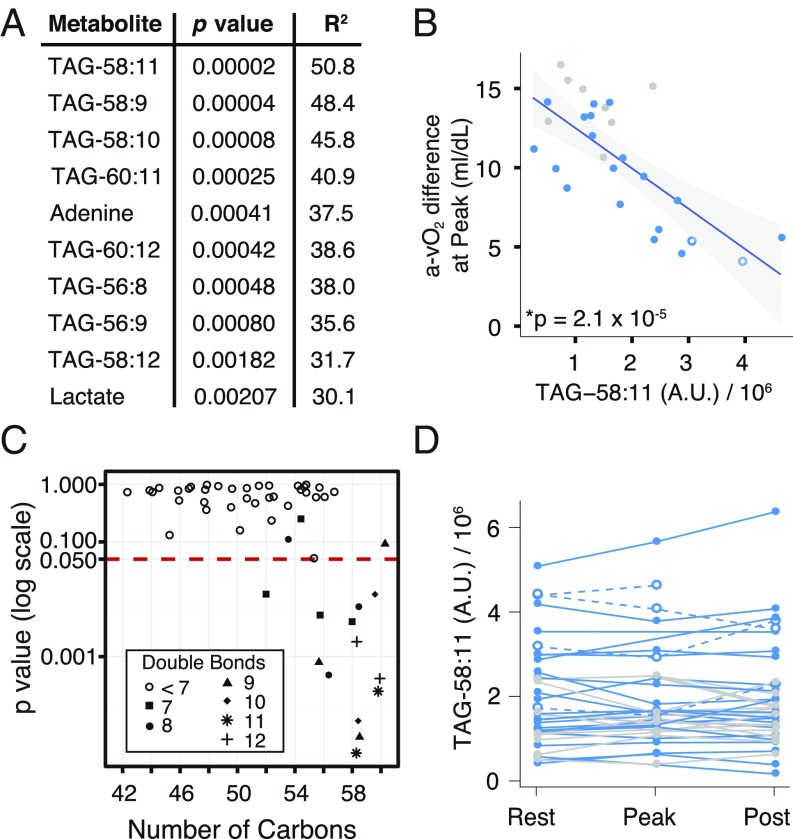
A major challenge in mitochondrial medicine is identifying biomarkers that are indicative of disease severity. Previous studies have shown that the systemic a-vO2 difference at peak exercise can serve as a quantitative measure of mitochondrial myopathy severity (5). We asked whether any of the resting metabolites are predictive of systemic a-vO2 difference at peak exercise. We regressed the peak a-vO2 difference for each Mito patient and control onto the resting level of each of the 242 metabolites measured, and ranked them by statistical significance. Although the classic biomarker lactate was the 10th most significant metabolite by p value, there were nine more significant metabolites, eight of which were triacylglycerols (TAGs) (Fig. 5A). TAG-58:11 (nomenclature indicates 58 total carbons with 11 total double bonds) was the metabolite showing strongest correlation with peak a-vO2 difference. Higher resting TAG-58:11 levels were associated with lower peak a-vO2 difference (Fig. 5B).
Fig. 5.
Resting metabolites that are predictive of peak exercise systemic a-vO2 difference in patients with mitochondrial myopathy. (A) Ordered list of the top 10 significant metabolites when the systemic a-vO2 difference at peak was regressed against the metabolite level at rest. (B) Regression result for the most significant metabolite, TAG-58:11. (C) For the 52 TAG species measured, a comparison of how the p value in the regression from A relates to the number of carbons in the TAG species. Symbols show the number of double bonds. (D) TAG-58:11 variation with exercise testing; points connected by a single line represent measurements from the same trial. Symbols and colors as in Fig. 1.
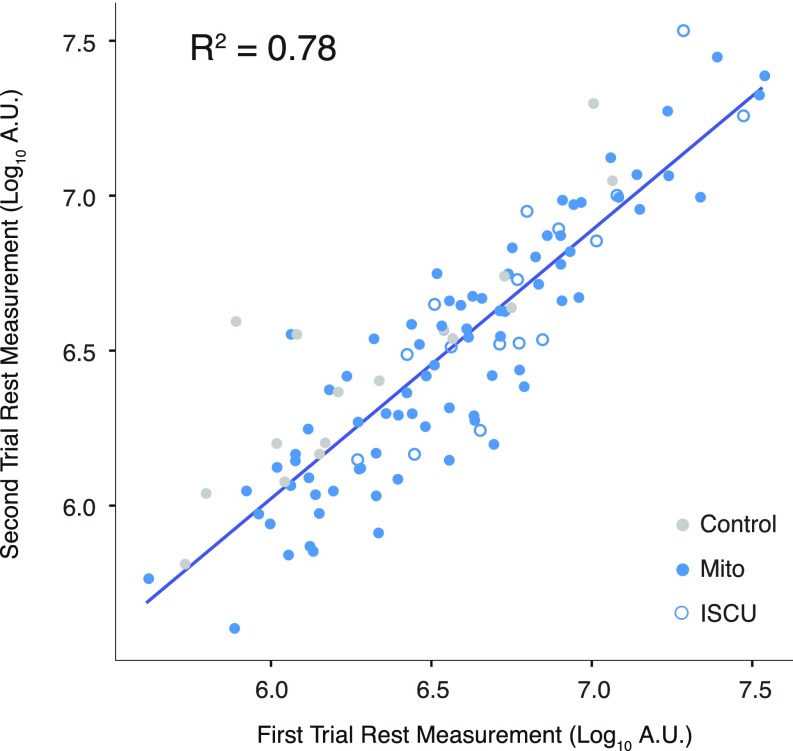
To further explore the relationship between TAG species and mitochondrial disease severity, we examined the p values for each of the 52 TAG species measured (Fig. 5C) and found that 13 of the 52 TAGs significantly correlated with peak a-vO2 difference. Interestingly, these TAGs all had a high number of carbons, 12 with 56 or more carbons, and 1 with 52 carbons, and all with 7 or more double bonds (Fig. 5C). Notably, these TAGs also appeared to be relatively stable during exercise. For example, TAG-58:11 measurements did not show much variation in Mito and control subjects during the exercise trial (Fig. 5D), and the measurements were well correlated across days (R2 = 0.78) in patients that underwent multiple exercise tests (Fig. S5).
Fig. S5.
TAG stability. Each point represents two measurements the measurement of a TAG on separate days for participants who underwent two exercise trials. Points are only shown for the eight TAGs identified in Fig. 5A.
Discussion
We have combined the power of exercise physiology and metabolic profiling to investigate the biochemical pathophysiology of two distinct forms of oxidative myopathy. We focused on patients with McArdle disease, who have a compromised ability to mobilize glucose from glycogen with resulting substrate-limited oxidative metabolism, and mitochondrial myopathy patients, in whom a defective respiratory chain limits oxidative phosphorylation. By profiling these patients both at rest and with exercise we have gained insights into the biochemical alterations that underlie and contribute to the symptoms of these patients.
Lactate and pyruvate are examples of metabolites whose response varies across disease groups at rest, and especially in response to exercise (Fig. 3A). At rest, the levels of these metabolites are lowest in McArdle patients, intermediate in controls, and highest in Mito patients (Fig. 2). Exercise amplifies these differences. Despite higher resting levels in Mito patients, lactate and pyruvate in Mito patients and controls rise comparably with exercise (Figs. 3A and 4), even though controls had far higher peak rates of work and oxidative phosphorylation (Fig. 1). In striking contrast, in McArdle patients, lactate and pyruvate tend to be lower at baseline and remain unchanged with exercise.
Another class of plasma metabolites that prominently varied across disease and with exercise were the TCA cycle intermediates (TCAI) and pantothenate (Fig. 3 B and C). Previous muscle biopsy studies have demonstrated that the skeletal muscle TCAI pool expands four- to fivefold with exercise (19). Recently, it was shown that this “TCA cycle expansion” occurs not only within muscle but also in blood plasma, a result we reproduced in this study (Fig. 3B). Strikingly, we observed that McArdle patients had no TCA cycle expansion with exercise. Our result is consistent with a small biopsy study that found levels of malate, citrate, and fumarate in skeletal muscle did not increase in McArdle patients (20), in contrast to healthy controls. This study confirms these observations and extends them to the plasma of exercising McArdle patients.
The observation that TCAI levels do not increase in McArdle disease is informative for several reasons. First, it argues by parsimony for a direct link between previously observed TCAI changes in muscle tissue and corresponding changes in plasma, because the enzymatic defect in McArdle disease is specific to skeletal muscle. Second, it establishes a direct relationship between skeletal muscle glycogenolysis and TCAI expansion, which has been the subject of debate. A few studies have investigated this relationship by experimentally manipulating muscle glycogen availability using diet and exercise to deplete or enhance glycogen stores (21, 22). Spencer et al. showed that higher resting glycogen levels led to a greater increase in the sum of TCA intermediates citrate, malate, and fumarate with exercise (22). In contrast, Baldwin et al. concluded that glycogen availability did not affect TCA cycle expansion with exercise, arguing against the idea that glycogen-dependent TCAI expansion determines exercise capacity (21). The block in glycogen breakdown in McArdle disease is complete, whereas some muscle glycogen was always still available in these studies of healthy controls, and the conspicuous changes we observe demonstrate an unequivocal connection between glycogen availability and TCAI expansion. Finally, our study supports the view that impaired oxidative capacity in McArdle disease is linked to impaired TCA cycle flux. A key feature of our study design is the comparison of Mito and McArdle patients, which allows us to conclude that restricted TCA cycle expansion is a direct consequence of blocked glycogenolysis, not a secondary consequence of impaired oxidative phosphorylation.
Pantothenate (vitamin B5) shows a pattern of dynamic changes that resembles that of TCA cycle intermediates. Recent studies have shown that plasma pantothenate rises with exercise (14). At present there is no mechanistic explanation for why pantothenate, traditionally viewed as a precursor of CoA, should change with exercise. A finding from this study is that although pantothenate dramatically increases with exercise in Mito and controls, it does not increase in McArdle patients (Fig. 3C). Although the reason for this increase is unknown, the lack of an increase in McArdle patients demonstrates a close connection with skeletal muscle glycogenolysis and fuel mobilization.
Our study recapitulates previous work indicating exaggerated AMP degradation with exercise in McArdle patients (23–25), and shows that metabolites related to the urea cycle are also elevated. Resting levels of AMP degradation products—including hypoxanthine, xanthine, and inosine—were higher in McArdle patients, consistent with previous reports including the observation that hyperuricemia is prevalent among patients with defects in muscle glycogenolysis (23–25) (Fig. 2). AMP deamination produces ammonia, and an exaggerated rise in ammonia with exercise is a diagnostic feature of McArdle disease. We find that two urea cycle intermediates, citrulline and arginine, also increase following exercise specifically in McArdle patients (Fig. 3F and Fig. S4), consistent with increased ammonia clearance in these individuals. We also show that exercise elevates the pyrimidine, uridine, in all subjects (Fig. 3E) likely related to limited ATP for pyrimidine nucleotide phosphorylation and to increased pyrimidine degradation (26).
Our measurements also identify a significant exercise-induced decrease in orotate in controls as well as Mito patients while remaining unchanged in McArdle patients (Fig. 3E). Orotate is an intermediate in de novo pyrimidine biosynthesis and is formed by the oxidation of dihydroorotate by dihydroorotate dehydrogenase (DHODH), which sits at the outer face of the inner mitochondrial membrane and reduces ubiquinone to ubiquinol. One possible explanation for our result is that as maximal exercise in controls and Mitos (but not McArdle patients, in whom electron flux is substrate limited) creates a shortage of electron acceptors in the respiratory chain, the equilibrium of the DHODH reaction causes it to reverse direction and use electrons from ubiquinol to reduce orotate into dihydroorotate. However, other mechanisms may contribute to this observation as flux through the de novo pyrimidine synthesis pathway can also be influenced by urea cycle overflow (27) and can be modulated by uric acid (28). Plasma orotate can also be absorbed by the liver (29), excreted by the kidney (29), and taken up by erythrocytes (29).
Our work has potential implications for management of mitochondrial disease, which currently lacks facile biomarkers. The present study lends additional support for elevated creatine and decreased uridine in mitochondrial myopathy, consistent with Shaham et al. (13). A major unmet need is an objective measure of disease severity. Peak a-vO2 difference during exercise is one such measure (5) but requires specialized exercise testing. Our study design allowed us to spotlight long-chain TAGs as predictors of a-vO2 difference at peak exercise (Fig. 5). These TAG species indicated the severity of disease, rather than denoting the presence of any mitochondrial dysfunction, because Mito patients with exercise performance similar to controls also had TAG levels similar to controls (Fig. 5B). Although it is notable that two previous studies (30, 31) demonstrated bulk TAGs are increased in mitochondrial myopathy, future studies will be needed to validate that resting levels of these specific TAGs predict disease severity and to determine the underlying mechanism.
Methods
Human Subjects.
The diagnoses of the Mito patients and demographic characteristics of all participants are described in Table S1. The study was approved by the Institutional Review Board of the University of Texas Southwestern Medical Center and Texas Health Presbyterian Hospital of Dallas. Each subject provided informed consent.
Exercise Testing.
The maximal cycle test was performed as previously described (5). Most mitochondrial myopathy patients were evaluated over the course of 5 days, during which time the test was performed twice. Exercise physiology and plasma metabolites from both cycle tests were evaluated for a subset of patients. McArdle patients have especially low exercise intensity in the first 6–8 min of exercise and subsequently develop a “second wind” attributable to an increase in oxidative capacity associated with a drop in exercise heart rate (Fig. S2) (4); subsequently, patients were able to achieve increased workloads, more comparable to controls (Fig. S2).
Metabolic Profiling.
Samples were coded and de-identified before further analysis. Samples were analyzed at the Broad Institute using methods that have been previously described (13–17). In total, 173 plasma samples were analyzed and 252 metabolites were detected (Table S2). Metabolites that could not be distinguished from one another were listed as Metabolite X/Metabolite Y.
Statistical Analysis.
The data were initially preprocessed for quality control and to handle missing samples (Supporting Information). To compare differences between resting-state metabolites between patient types, we tested for significantly different mean measurements between groups using a mixed-effect linear model to account for the repeated testing of some individuals, with patient or control group as a fixed effect and individuals as random effects. All metabolic profiling data were log-transformed before analysis to better fit the assumption of normally distributed errors. Metabolite excursions with exercise were calculated as the difference of the logged measurement at each time point. We reported all metabolites estimated to have a false-discovery rate below 0.05 as determined by the Benjamini–Hochberg procedure (18). Figures showing metabolite levels were generated after averaging any replicated test measurements from the same individual to more clearly show the size of each cohort. The regression of peak systemic a-vO2 difference on resting metabolite level was also performed after averaging measurements from patients with replicated tests to allow for an interpretable R2 value.
Description of Data Preprocessing
Not all samples from all subjects were available for metabolic profiling because of difficulties with sample collection or failure of the subject to maintain peak exercise for the complete sampling period. To maintain consistent datasets across different possible comparisons, when a patient had complete metabolite profiling data from one exercise trial but not a replicated trial, only the trial with complete data were used in the analysis. Not all patients had replicated exercise trials that could be used to avoid missing data, and six exercise trials (three Mito patients, two controls, and one McArdle patient) had data at postexercise and rest but were missing a measurement at peak. One Mito patient had one trial missing a peak measurement and another missing a postexercise measurement, so both trials were used in the analysis.
Of the 252 metabolites we attempted to measure, 10 were excluded from the analysis as measurements were not obtained from at least 80% of all samples. The data from one trial was excluded as a several metabolites had a resting and postexercise measurement that changed in the opposite direction of what would be expected with exercise, suggestive of a tube switch. This trial not only had the highest resting lactate measurement, but was also the only trial in a Mito patient in which the lactate level decreased during exercise. Additionally, one sample measurement was excluded as the hydrophilic interaction liquid chromatography measurements were not available and the lipids from three samples were excluded based on negative QC scores from our metabolic profiling platform. To account for possible confounding effects of diet and medications, all Mito patients were asked to list current medications and dietary supplements. One patient reported taking creatine supplements, and so was excluded from any analysis involving creatine.
Acknowledgments
We thank P. Wyrick, M. Newby, and P. Fowler for assistance in subject recruitment, exercise testing, and sample collection and A. Deik and A. Souza for technical assistance. This work was supported by the NIH Grants R01-AR050597 (to R.G.H.) and R01-DK081457 (to V.K.M.); the Muscular Dystrophy Association (R.G.H.); the Giant Tiger Foundation (R.G.H.); and the Marriott Mitochondrial Disorders Network (V.K.M.). V.K.M. is an Investigator of the Howard Hughes Medical Institute.
Footnotes
The authors declare no conflict of interest.
This article contains supporting information online at www.pnas.org/lookup/suppl/doi:10.1073/pnas.1703338114/-/DCSupplemental.
References
- 1.Chen Y-T, Kishnani PS, Koeberl D. 2014. Glycogen storage diseases. OMMBID: The Online Metabolic and Molecular Bases of Inherited Diseases, eds Valle D, et al. (McGraw Hill, New York), Chap 71.
- 2.McArdle B. Myopathy due to a defect in muscle glycogen breakdown. Clin Sci. 1951;10:13–35. [PubMed] [Google Scholar]
- 3.Rumpf KW, et al. Increased ammonia production during forearm ischemic work test in McArdle’s disease. Klin Wochenschr. 1981;59:1319–1320. doi: 10.1007/BF01711182. [DOI] [PubMed] [Google Scholar]
- 4.Haller RG, Vissing J. Spontaneous “second wind” and glucose-induced second “second wind” in McArdle disease: Oxidative mechanisms. Arch Neurol. 2002;59:1395–1402. doi: 10.1001/archneur.59.9.1395. [DOI] [PubMed] [Google Scholar]
- 5.Taivassalo T, et al. The spectrum of exercise tolerance in mitochondrial myopathies: A study of 40 patients. Brain. 2003;126:413–423. doi: 10.1093/brain/awg028. [DOI] [PubMed] [Google Scholar]
- 6.Jensen TD, Kazemi-Esfarjani P, Skomorowska E, Vissing J. A forearm exercise screening test for mitochondrial myopathy. Neurology. 2002;58:1533–1538. doi: 10.1212/wnl.58.10.1533. [DOI] [PubMed] [Google Scholar]
- 7.Taivassalo T, Abbott A, Wyrick P, Haller RG. Venous oxygen levels during aerobic forearm exercise: An index of impaired oxidative metabolism in mitochondrial myopathy. Ann Neurol. 2002;51:38–44. doi: 10.1002/ana.10027. [DOI] [PubMed] [Google Scholar]
- 8.Mochel F, Haller RG. Myopathy with deficiency of ISCU. In: Pagon RA, Bird TD, Dolan CR, Stephens K, Adam MP, editors. GeneReviews. Univ of Washington; Seattle: 2009. [PubMed] [Google Scholar]
- 9.Lewis SF, Haller RG, Cook JD, Blomqvist CG. Metabolic control of cardiac output response to exercise in McArdle’s disease. J Appl Physiol. 1984;57:1749–1753. doi: 10.1152/jappl.1984.57.6.1749. [DOI] [PubMed] [Google Scholar]
- 10.Heinicke K, et al. Exertional dyspnea in mitochondrial myopathy: Clinical features and physiological mechanisms. Am J Physiol Regul Integr Comp Physiol. 2011;301:R873–R884. doi: 10.1152/ajpregu.00001.2011. [DOI] [PMC free article] [PubMed] [Google Scholar]
- 11.Vissing J, Lewis SF, Galbo H, Haller RG. Effect of deficient muscular glycogenolysis on extramuscular fuel production in exercise. J Appl Physiol (1985) 1992;72:1773–1779. doi: 10.1152/jappl.1992.72.5.1773. [DOI] [PubMed] [Google Scholar]
- 12.Lewis SF, Haller RG. The pathophysiology of McArdle’s disease: Clues to regulation in exercise and fatigue. J Appl Physiol (1985) 1986;61:391–401. doi: 10.1152/jappl.1986.61.2.391. [DOI] [PubMed] [Google Scholar]
- 13.Shaham O, et al. A plasma signature of human mitochondrial disease revealed through metabolic profiling of spent media from cultured muscle cells. Proc Natl Acad Sci USA. 2010;107:1571–1575. doi: 10.1073/pnas.0906039107. [DOI] [PMC free article] [PubMed] [Google Scholar]
- 14.Lewis GD, et al. Metabolic signatures of exercise in human plasma. Sci Transl Med. 2010;2:33ra37. doi: 10.1126/scitranslmed.3001006. [DOI] [PMC free article] [PubMed] [Google Scholar]
- 15.Wang TJ, et al. Metabolite profiles and the risk of developing diabetes. Nat Med. 2011;17:448–453. doi: 10.1038/nm.2307. [DOI] [PMC free article] [PubMed] [Google Scholar]
- 16.Rhee EP, et al. Lipid profiling identifies a triacylglycerol signature of insulin resistance and improves diabetes prediction in humans. J Clin Invest. 2011;121:1402–1411. doi: 10.1172/JCI44442. [DOI] [PMC free article] [PubMed] [Google Scholar]
- 17.Leoni V, et al. Metabolic consequences of mitochondrial coenzyme A deficiency in patients with PANK2 mutations. Mol Genet Metab. 2012;105:463–471. doi: 10.1016/j.ymgme.2011.12.005. [DOI] [PMC free article] [PubMed] [Google Scholar]
- 18.Benjamini Y, Hochberg Y. Controlling the false discovery rate: A practical and powerful approach to multiple testing. J Roy Stat Soc B Met. 1995;57:289–300. [Google Scholar]
- 19.Bowtell JL, Marwood S, Bruce M, Constantin-Teodosiu D, Greenhaff PL. Tricarboxylic acid cycle intermediate pool size: Functional importance for oxidative metabolism in exercising human skeletal muscle. Sports Med. 2007;37:1071–1088. doi: 10.2165/00007256-200737120-00005. [DOI] [PubMed] [Google Scholar]
- 20.Sahlin K, Jorfeldt L, Henriksson KG, Lewis SF, Haller RG. Tricarboxylic acid cycle intermediates during incremental exercise in healthy subjects and in patients with McArdle’s disease. Clin Sci (Lond) 1995;88:687–693. doi: 10.1042/cs0880687. [DOI] [PubMed] [Google Scholar]
- 21.Baldwin J, et al. Glycogen availability does not affect the TCA cycle or TAN pools during prolonged, fatiguing exercise. J Appl Physiol (1985) 2003;94:2181–2187. doi: 10.1152/japplphysiol.00866.2002. [DOI] [PubMed] [Google Scholar]
- 22.Spencer MK, Yan Z, Katz A. Effect of low glycogen on carbohydrate and energy metabolism in human muscle during exercise. Am J Physiol. 1992;262:C975–C979. doi: 10.1152/ajpcell.1992.262.4.C975. [DOI] [PubMed] [Google Scholar]
- 23.Brooke MH, Patterson VH, Kaiser KK. Hypoxanthine and McArdle disease: A clue to metabolic stress in the working forearm. Muscle Nerve. 1983;6:204–206. doi: 10.1002/mus.880060307. [DOI] [PubMed] [Google Scholar]
- 24.Mineo I, et al. Myogenic hyperuricemia. A common pathophysiologic feature of glycogenosis types III, V, and VII. N Engl J Med. 1987;317:75–80. doi: 10.1056/NEJM198707093170203. [DOI] [PubMed] [Google Scholar]
- 25.Mineo I, Tarui S. Myogenic hyperuricemia: What can we learn from metabolic myopathies? Muscle Nerve Suppl. 1995;3:S75–S81. doi: 10.1002/mus.880181416. [DOI] [PubMed] [Google Scholar]
- 26.Yamamoto T, et al. Effect of muscular exercise on the concentration of uridine and purine bases in plasma–adenosine triphosphate consumption-induced pyrimidine degradation. Metabolism. 1997;46:1339–1342. doi: 10.1016/s0026-0495(97)90241-9. [DOI] [PubMed] [Google Scholar]
- 27.Milner JA, Visek WJ. Urinary metabolites characteristic of urea-cycle amino acid deficiency. Metabolism. 1975;24:643–651. doi: 10.1016/0026-0495(75)90144-4. [DOI] [PubMed] [Google Scholar]
- 28.Cantor JR, et al. Physiologic medium rewires cellular metabolism and reveals uric acid as an endogenous inhibitor of UMP synthase. Cell. 2017;169:258–272.e17. doi: 10.1016/j.cell.2017.03.023. [DOI] [PMC free article] [PubMed] [Google Scholar]
- 29.Löffler M, Carrey EA, Zameitat E. Orotate (orotic acid): An essential and versatile molecule. Nucleosides Nucleotides Nucleic Acids. 2016;35:566–577. doi: 10.1080/15257770.2016.1147580. [DOI] [PubMed] [Google Scholar]
- 30.Clarke C, et al. Mitochondrial respiratory chain disease discrimination by retrospective cohort analysis of blood metabolites. Mol Genet Metab. 2013;110:145–152. doi: 10.1016/j.ymgme.2013.07.011. [DOI] [PMC free article] [PubMed] [Google Scholar]
- 31.Kaufmann P, et al. Protean phenotypic features of the A3243G mitochondrial DNA mutation. Arch Neurol. 2009;66:85–91. doi: 10.1001/archneurol.2008.526. [DOI] [PMC free article] [PubMed] [Google Scholar]


