

Abstract
Background:
Epidemiologic and genetic studies suggest a link between insulin resistance (IR) and endometrial cancer, and endometrial hyperplasia (EH) is a precancerous stage of endometrial cancer. Adiponectin is an adipokine which previously shown to be a risk factor for endometrial cancer. The aim of the study was to develop a rat model of IR and EH and evaluate adiponectin system in circulation and uterus.
Methods:
This study was a 46-week animal trial from February 2014 to January 2015. Female Sprague-Dawley rats were fed with high-fat diet (HFD) for 40 weeks to induce IR. Followed by ovariectomization, rats were orally administrated to 17β-estradiol (E2) for 4 weeks to induce EH and then sacrificed. A total of 36 rats were divided into four groups: E2, HFD, HFD + E2, and control groups. Data were analyzed with Student's t-test, one-way analysis of variance (ANOVA), and Mann-Whitney U-tests. Chi-square was used to evaluate the score of immunohistochemistry.
Results:
The thickness of endometrial, glandular epithelium, and myometrium in the HFD-E2 group were higher than the E2 group (F = 59.02, F = 23.51 and F = 12.53, respectively, all P < 0.001). Plasma adiponectin levels in the E2 group were lower than those in the control group, and the levels in the HFD-E2 group were lower than those in the HFD group (F = 13.15, P < 0.05). However, after normalized to visceral adipose tissue, compared to the control group, plasma adiponectin levels were decreased in rat with HFD in the absence or presence of E2, respectively (F = 6.72, P < 0.05). Adiponectin gene (F = 10.48, P < 0.05) and protein (P < 0.05) levels in uterus in the HFD-E2 group were higher than those in the HFD group.
Conclusions:
This study manifests that IR can effectively modulate EH, which suggests the involvement of energetic metabolism in uterine alternation. The combination effects of IR and EH modulate circulating adiponectin levels. However, adiponectin gene and protein levels in uterus are mainly response to estradiol.
Keywords: Adiponectin, Adiponectin Receptors, Estradiol, Insulin Resistance
INTRODUCTION
Obesity, in particular abdominal obesity, is an important risk factor for insulin resistance (IR), hyperglycemia, dyslipidemia, and a proinflammatory state.[1] Proliferation of endometrial cells can lead to the gradual development of endometrial hyperplasia (EH).[2,3] In the absence of ovulation, continuous exposure of the endometrium to estrogen can lead to EH and cancer. Body mass index (BMI) is a consistent and leading risk factor for EH in premenopausal women.[4] Adipose tissue is not only an organ for fat storage but also an active participant in the regulation of energy homeostasis and secreting a large number of biologically active adipokines.[5] Adiponectin is a hormone originally identified in adipocytes and is recently shown to modulate a wide range of physiological processes including carbohydrate and lipid metabolism, atherosclerosis, blood pressure regulation, and insulin sensitivity, and even influence immunity and inflammation.[6] Adiponectin is abundant in the blood and comprise 0.01% of all proteins in the plasma.[7] The plasma adiponectin concentration is inversely correlated with BMI and with visceral fat accumulation and demonstrated to lower in individuals with obesity and type 2 mellitus diabetes.[8,9,10] Adiponectin receptors, AdipoR1 and AdipoR2, are well recognized on the regulation of glucose and lipid metabolism by adiponectin.[11,12] AdipoR1 is primarily expressed in skeletal muscle while AdipoR2 is primarily expressed in the liver. Both AdipoR1 and AdipoR2 contain seven transmembrane domains, similar but different to G-protein-coupled receptors. The ovariectomized (OVX) rat is a widely used model to study estrogen withdrawal and replacement because many phenomena in this rat model are similar to those occurring to postmenopausal women. Studies have shown that adiponectin is able to affect steroidogenic gene expression and steroidogenesis, and the effect depends on species and concentration of the hormone.[13,14]
In this study, we built a rat model with IR and EH and intended to analyze morphologic effects induced in the rat uterus after high-fat diet (HFD) and estrogen treatment. We also observed the changes of plasma adiponectin levels and determined the expression of uterine adiponectin and its receptors in the rat model.
METHODS
Ethical approval
The animal protocol in this study was reviewed and approved by the Peking University First Hospital (No. J201305). Guidelines for the use and care of laboratory animals were followed in accordance with the National Health and Medical Research Council of China guidelines.
Animals
Female Sprague-Dawley rats (aged 8 weeks) were purchased (Vital River Laboratory Animal Co. Ltd., Beijing, China, License No.: SCXK [Beijing]-2012-0001) and sacrificed 46 weeks after treatment. Animals were allowed to access to food and water ad libitum and housed under standardized conditions (room temperature, 23°C ± 2°C; relative humidity, 50% ± 5%; frequent ventilation; and an illumination schedule of 12 h light/12 h dark).
Rat model of insulin resistance and endometrial hyperplasia
This study was a 46-week animal trial from February 2014 to January 2015. Rats were fed by HFD for 40 weeks to induce IR. The HFD provided 60% of the calories as fat and 20% of the calories as carbohydrate, and standard diet (StD) was used as control which containing 10% of the calories as fat and 65% of the calories as carbohydrate. To confirm IR, total cholesterol, triglyceride, high-density lipoprotein cholesterol, low-density lipoprotein cholesterol (LDL-C), fasting blood glucose (FBG), and fast insulin (FINS) were measured every 4 weeks. The homeostasis model assessment of IR (HOMA-IR) was calculated using the following the formula: FINS (μg/ml) × FBG (mmol/L)/22.5.[15] Rats were subsequently subjected to an oral glucose tolerance test (OGTT) with glucose (2 g/kg, body weight [bw]) after fasting overnight (12 h). One week after the OGTT, an intraperitoneal insulin tolerance test (IPITT) with insulin (0.75 U/kg bw) was also performed after fasting for 7 h. Plasma glucose levels were measured by ACCU-CHEK Active Monitor (Roche Diagnostics, Basel, Switzerland) at 0, 30, 60, 90, and 120 min, and the area under the curve (AUC) was calculated. After a 40-week diet treatment, rats were subjected to bilateral OVX. Followed by a recovery period of 1 week, OVX animals were administered 17β-estradiol (E2, 800 μg/kg bw, Sigma, St. Louis, MO, USA) once a day for up to 4 weeks to induce EH. E2 was dissolved in ethanol at a high concentration and then diluted with olive oil to proper concentration. Papanicolaou staining of vagina smear was used to confirm the effect of OVX and E2 treatment.
Experimental groups
After an acclimation period of 1 week, total 36 rats were randomly divided into four groups (n = 9 per group): (1) the HFD-E2 group was fed with HFD and OVX followed by administrated with E2; (2) the E2 group was fed with StD and OVX followed by administrated with E2; (3) the HFD group was fed with HFD and OVX followed by administrated with vehicle (olive oil); and (4) the control group received StD and sham-OVX followed by administrated with vehicle. Followed by fed with StD or HFD for 40 weeks, animals were sham-OVX or OVX and went through a recovery period of 1 week. The rats were sacrificed after administrated with vehicle or E2 for 4 weeks. Body weights and food intake were recorded every 2 weeks. At the end of experiment, all animals were deprived of food for 12 h and then anesthetized. The uteri were removed and trimmed followed by weighed (uterine wet weight). Then, the uteri were placed between moistened filter paper, gently pressed to remove luminal fluid, and reweighed (uterine blotted weight). A segment of uterine horn was fixed in 10% neural buffer formalin for 24 h, dehydrated in a graded ethanol series, cleared in xylene, and embedded in paraffin. The 5 μm uterine sections were routinely stained with hematoxylin and eosin staining.
Biochemical assays
For the determination of plasma adiponectin, blood samples were collected from abdominal aorta using heparin-containing tubes and were centrifugation at 3000 ×g for 10 min and stored at −80°C until the measurements were conducted. The plasma adiponectin levels were determined with a commercially available enzyme-linked immunosorbent assay kit (R&D System, Minneapolis, USA) according to the manufacturer's instructions. The detection range of the assay was 0.2–10.0 ng/ml, and the sensitivity was 0.023 ng/ml. Intra- and inter-assay coefficients of variation were <10% for adiponectin.
RNA isolation and real-time polymerase chain reaction
Total RNAs were extracted from uterine tissue with Trizol Reagent (Invitrogen, CA, USA), according to the manufacturer's protocol. The RNAs were converted to cDNA with the High-Capacity cDNA Reverse Transcription Kit (Applied Biosystems, USA). Real-time polymerase chain reaction (RT-PCR) was carried out with SYRB Select Master Mix (Applied Biosystems, USA) on a RT-PCR detection system (Applied Biosystems, USA). Reactions were performed as follows: incubation at 50°C for 2 min and 95°C for 10 min, followed by 40 cycles of amplification, each consisting of 95°C for 15 s, 60°C for 1 min, and then the temperature increased from 60°C to 95°C to obtain a melting curve. Primers for amplification of adiponectin (ADIPOQ), adiponectin receptors (ADIPOR1 and ADIPOR2), and the reference gene β-actin were designed using Primer Express Software (Applied Biosystems, USA). Primers were as follows: ADIPOQ, forward 5’-GGCCGTGATGGCAGAGAT-3’, reverse 5’-TTCCGCTCCTGTCATTCCA-3’; ADIPOR1, forward 5’-TTCCGCATCCACACAGAAAC-3’, reverse 5’-GCATGGTCAAGATTCCCAGAA-3’; ADIPOR2 forward 5’-TACACACAGAGACGGGCAACA-3’, reverse 5’-CCCCAGGCACAGGAAGAATA-3’; β-actin forward 5’-TCAGGTCATCACTATCGGCAAT-3’, reverse 5’-CATGGATGCCACAGGATTCC-3’. RT relative mRNA levels were calculated according to the relative quantification method (2−ΔΔCt) and expressed as the fold change relative to the control.
Immunohistochemistry
Immunohistochemical analysis was performed to detect the adiponectin system proteins expression. The serial 3 μm uterine sections were deparaffinized, rehydrated, and incubated for 10 min in methanol containing 3% H2O2. Antigen retrieval was obtained using a domestic pressure for 2.5 min at maximum pressure with 0.01 mol/L citrate buffer (pH 6.0). After incubation in normal goat serum for 1 h at room temperature, sections were incubated with primary anti-adiponectin (1:250, Abcam, UK), anti-adiponectin receptor 1 (diluted 1:250, Abcam, UK), anti-adiponectin receptor 2 (1:250, Abcam, UK) antibody overnight at 4°C. Primary antibodies were used at 1:250. Immunohistochemistry was performed using a streptavidin/peroxidase kit according to the manuscript's protocol (ZSGB-BIO, Beijing, China). Immunostained sections were examined by light microscopy by two investigators and scored semiquantitatively according to the intensity of staining on a scale of 0 (no staining) to 3+ (strong staining). Tissues with 2+ or 3+ staining in greater than 10% of cells were considered positive for protein expression.[16] Stained slides were observed and photographed with microscope (Olympus, Tokyo, Japan).
Statistical analyses
Statistics analysis was performed using Statistical Product and Service Solutions software (SPSS, version 16.0, SPSS Inc., Chicago, IL, USA). Data are reported as mean ± standard error (SE). Differences between two groups were assessed using Student's t-test or nonparametric Mann-Whitney U-tests. Multiple group comparisons were performed using one-way analysis of variance (ANOVA) test followed by the least significant difference test. Chi-square test was used to evaluate the frequency of immunostaining by group. All P values were two-sided and P < 0.05 was considered statistically significant.
RESULTS
High-fat diet effects on body weight and glucose metabolism
After a 1-week acclimatization, the body weights of StD and HFD rats were similar. Following feeding for 40 weeks, IR was induced in rat with HFD. Body weight of HFD rats were significantly higher than StD rats (t = 6.06, P < 0.01). Compared to StD rats, biochemical analyses indicated that HFD rats had significantly higher levels of LDL-C, FINS, AUC of OGTT and IPITT, and HOMA-IR (P < 0.01). However, FBG showed no difference between the two groups [Table 1]. In addition, after rats were sacrificed, the weight of visceral adipose tissue levels in HFD and HFD-E2 groups were significantly increased compared to control and E2 groups (F = 33.33, P < 0.001, Table 2).
Table 1.
Body weight and biochemical parameters in rats after 40 weeks of the specified diet
| Group | StD (n = 18) | HFD (n = 18) | t | P |
|---|---|---|---|---|
| Body weight (g) | 402.19 ± 13.49 | 542.14 ± 19.07 | 6.06 | <0.001 |
| TG (mg/L) | 7.20 ± 0.50 | 6.70 ± 0.60 | 0.69 | 0.493 |
| TCHO (mg/L) | 21.10 ± 1.00 | 21.10 ± 1.80 | 0.01 | 0.990 |
| HDL-C (mg/L) | 6.80 ± 0.30 | 6.40 ± 0.40 | 0.83 | 0.412 |
| LDL-C (mg/L) | 1.20 ± 0.10 | 1.60 ± 0.10 | 2.60 | 0.015 |
| FBG (mmol/L) | 5.80 ± 0.11 | 6.05 ± 0.16 | 1.07 | 0.294 |
| FINS (U/ml) | 15.67 ± 1.05 | 33.72 ± 2.76 | 6.24 | <0.001 |
| HOMA-IR | 4.23 ± 0.27 | 9.14 ± 0.87 | 5.82 | <0.001 |
| AUC of OGTT | 13.87 ± 0.23 | 16.44 ± 0.39 | 6.03 | <0.001 |
| AUC of IPITT | 5.14 ± 0.60 | 6.46 ± 1.23 | 6.10 | <0.001 |
Values represent the mean ± SE. StD: Standard diet group; HFD: High-fat diet group; TG: Triglyceride; TCHO: Total cholesterol; HDL-C: High-density lipoprotein cholesterol; LDL-C: Low-density lipoprotein cholesterol; FBG: Fasting blood glucose; FIN: Fast insulin; HOMA-IR: Homeostasis model assessment of insulin resistance; AUC: Area under the curve; OGTT: Oral glucose tolerance test; IPITT: Intraperitoneal insulin tolerance test; SE: Standard error.
Table 2.
Weight of visceral adipose tissue and the parameters of uterus (n = 9)
| Group | Control | E2 | HFD | HFD-E2 | F | P |
|---|---|---|---|---|---|---|
| Visceral adipose tissue (g) | 33.85 ± 3.14 | 24.25 ± 4.27 | 82.43 ± 8.26*,† | 75.57 ± 4.72*,† | 33.33 | <0.001 |
| Uterine wet weight (g) | 0.41 ± 0.06 | 0.74 ± 0.05* | 0.32 ± 0.03 | 0.72 ± 0.05*,‡ | 20.21 | <0.001 |
| Uterine blotted weight (g) | 0.37 ± 0.06 | 0.70 ± 0.05* | 0.32 ± 0.04 | 0.70 ± 0.05*,‡ | 16.68 | <0.001 |
| Thickness of endometrial luminal epithelium (µm) | 17.53 ± 1.53 | 35.65 ± 2.15* | 12.81 ± 0.67 | 49.20 ± 3.42*,†,‡ | 59.02 | <0.001 |
| Thickness of endometrial glandular epithelium (µm) | 14.34 ± 1.02 | 17.79 ± 0.63 | 12.52 ± 0.40 | 27.18 ± 2.38*,†,‡ | 23.51 | <0.001 |
| Thickness of uterine lamina propria (µm) | 656.19 ± 38.40 | 803.14 ± 45.23* | 614.34 ± 42.78 | 782.63 ± 53.73‡ | 4.20 | 0.013 |
| Thickness of uterine myometrium (µm) | 383.86 ± 21.53 | 451.63 ± 25.83 | 360.86 ± 32.40 | 623.64 ± 48.26*,†,‡ | 12.53 | <0.001 |
| Squamous metaplasia, n | 0 | 3 | 0 | 6 |
Values represent the mean ± SE. *P<0.05, versus control group; †P<0.01, versus E2 group; ‡P<0.01, versus HFD group. Control: Standard diet + sham-ovariectomized + vehicle; E2: Standard diet + ovariectomized + 17β-estradiol; HFD: High-fat diet + ovariectomized + vehicle; HFD-E2: High-fat diet + ovariectomized + 17β-estradiol; SE: Standard error.
Artificial endometrial hyperplasia
Vaginal smears from rats subjected to OVX displayed nonkeratinizing epithelium in papanicolaou staining, indicating that OVX was successful. Vaginal smears from control group, which was subjected to sham-OVX, showed one of the regular estrous cycles including diestrus, proestrus, estrus, and metestrus. Vaginal smears from E2-treated rats in E2 and HFD-E2 groups showed mature red-colored keratinized epithelial cells, indicating that E2 was effective. Wet and blotted uterine weights were significantly increased in E2 and HFD-E2 groups compared with vehicle-treated rats [control and HFD groups, F = 20.21 and P < 0.001, F = 16.68 and P < 0.001, respectively; Table 2]. The morphologic findings in uteri of all animals quantified and presented in Table 2 also showed the effect of E2. In control group, normal epithelial cells of the endometrium were characterized by cuboidal-shaped luminal and glandular epithelial cells, with nucleus oriented in the center of the cells [Figure 1a]. In HFD group, which were subjected to OVX but not E2, exhibited small uterine horns, and the uminal and glandular epithelia was atrophic, which showed simple low columnar cells and low cytoplasm to nucleus ratio [Figure 1c]. In contrast, the hyperplastic endometrium that developed in E2 and HFD-E2 groups was characterized by enlarged uterine horns and taller or pseudostratified columnar luminal and glandular epithelial cells and higher cytoplasm to nucleus ratio [Figure 1b and 1d]. The thickness of uterine luminal and glandular epithelia and myometrium in HFD-E2 group are significantly higher than E2 group [F = 59.02, F = 23.51 and F = 12.53, respectively, P < 0.001; Table 2]. Squamous intraepithelial metaplasia was detected in both luminal and glandular epithelia, and the percentage of squamous epithelial metaplasia in HFD-E2 group was 66.7% compared with 33.3% in E2 group.
Figure 1.
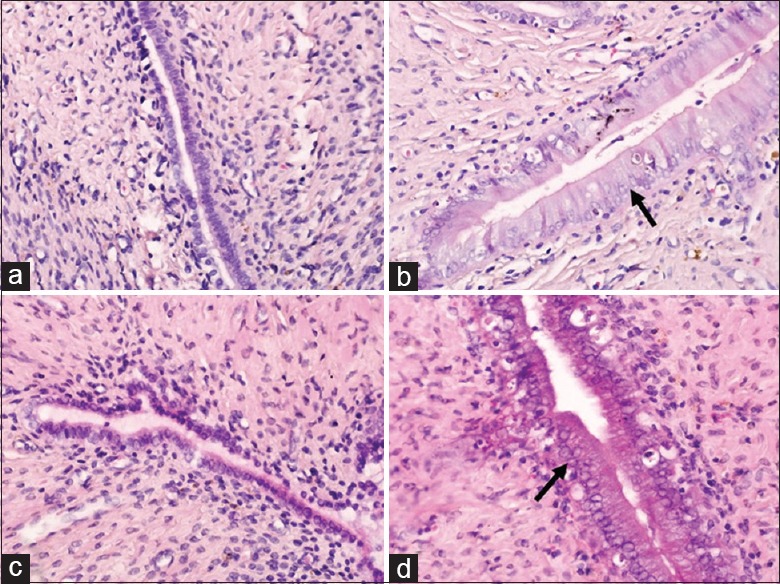
Representative microscopic images of Hematoxylin and Eeosin staining in uterus tissues (original magnification, ×400). The black arrows point to the high column endometrium. (a) Control group, standard diet + sham-ovariectomized + vehicle; (b) E2 group, standard diet + ovariectomized + 17β-estradiol; (c) HFD group, high-fat diet + ovariectomized + vehicle; (d) HFD-E2 group, high-fat diet + ovariectomized + 17β-estradiol.
Plasma adiponectin
To investigate adiponectin in circulation, plasma adiponectin levels are shown in Figure 2. Compared to control group, plasma adiponectin levels were significantly higher in HFD rats (control group: 6.28 ± 0.79 μg/ml vs. HFD group: 9.23 ± 0.72 μg/ml, F = 13.15, P < 0.05) and were significantly lower in both E2 groups (E2: 3.76 ± 0.48 μg/ml, HFD-E2 group: 4.52 ± 0.42 μg/ml, P < 0.05). HFD-E2 group presented lower levels of plasma adiponectin than HFD group (P < 0.001). However, after normalized to visceral adipose tissue, plasma adiponectin concentrations in both HFD groups (HFD and HFD-E2 groups) were significantly lower than control (F = 6.72, P < 0.05). The levels were significantly decreased in HFD-E2 group in comparison with E2 group (P < 0.01). There is no remarkable difference of normalized plasma adiponectin concentration between HFD and HFD-E2 groups (P = 0.186).
Figure 2.

Plasma adiponectin and relative plasma adiponectin concentration after high-fat diet and 17β-estradiol treatment. (a) Plasma adiponectin; (b) plasma adiponectin after normalized to visceral adipose tissue. Data represent the mean ± standard error. *P < 0.05. n = 9 in each group. Control: Standard diet + sham-ovariectomized + vehicle; E2: Standard diet + ovariectomized + 17β-estradiol; HFD: High-fat diet + ovariectomized + vehicle; HFD-E2: High-fat diet + ovariectomized + 17β-estradiol.
Expression of adiponectin and adiponectin receptor mRNA in uterus
Compared to control group, adiponectin mRNA level in the uterus was lower in HFD group (F = 10.48, P < 0.05) and was higher in HFD-E2 group (P < 0.05). Adiponectin mRNA level in HFD-E2 group was higher than HFD group (P < 0.001). However, there was no significant difference in E2-treated rats (E2 and HFD-E2 groups, P > 0.05). The mRNA levels for adiponectin receptors were detectible in uterine tissue, but there was no significant difference in ADIPOR1 and ADIPOR2 mRNA levels among all the groups [Figure 3].
Figure 3.

Relative mRNA levels of adiponectin (a), adiponectin receptor 1 (b), and adiponectin receptor 2 (c) in rat uterus. Results represent the mean ± standard error. *P < 0.05. n = 9 in each group. Control: Standard diet + sham-ovariectomized + vehicle; E2: Standard diet + ovariectomized + 17β-estradiol; HFD: High-fat diet + ovariectomized + vehicle; HFD-E2: High-fat diet + ovariectomized + 17β-estradiol.
Immunohistochemistry of adiponectin system in uterus
Adiponectin and its two receptors were detected in both luminal and glandular epithelia [Figure 4]. Adiponectin protein expression was higher in both E2 and HFD-E2 groups in comparison with control group [P = 0.131, control group vs. E2 group or HFD-E2 group; Table 3]. Compared with HFD group, adiponectin protein expression was significantly higher in HFD-E2 group [88.9% vs. 11.1%, P = 0.003; Table 3]. However, there was no significant difference in the expression of both AdipoR1 and AdipoR2 among the four groups.
Figure 4.

Immunohistochemical analysis of adiponectin and AdipoR1 and AdipoR2 expression in rat endometrium (original magnification, ×400). The black arrows point to adiponectin protein positive staining in endometrium. n = 9 in each group. Control: Standard diet + sham-ovariectomized + vehicle; E2: Standard diet + ovariectomized + 17β-estradiol; HFD: High-fat diet + ovariectomized + vehicle; HFD-E2: High-fat diet + ovariectomized + 17β-estradiol; AdipoR: Adiponectin receptor.
Table 3.
Immunohistochemical analysis of the adiponectin and AdipoR protein expression in endometrium (n = 9)
| Items | Control | E2 | HFD | HFD-E2 |
|---|---|---|---|---|
| Adiponectin | 4 (44.4) | 8 (88.9) | 1 (11.1) | 8 (88.9)* |
| AdipoR1 | 2 (22.2) | 4 (44.4) | 7 (77.8) | 4 (44.4) |
| AdipoR2 | 5 (55.6) | 4 (44.4) | 7 (77.8) | 3 (33.3) |
Values were represented as n (%). The staining intensity was scored as follows: 0, Negative; 1, Weak; 2, Moderate; 3, Strong. Samples with scores ≥2 are positive. *P = 0.003, versus HFD group. Control: Standard diet + sham-ovariectomized + vehicle; E2: Standard diet + ovariectomized + 17β-estradiol; HFD: High-fat diet + ovariectomized + vehicle; HFD-E2: High-fat diet + ovariectomized + 17β-estradiol; AdipoR: Adiponectin receptor.
DISCUSSION
Here, we have performed a rat model in which rats were put on a HFD to induce IR and administered with estradiol to induce EH. We also have investigated the effect of both HFD and 17β-estradiol on plasma adiponectin concentration and uterine adiponectin system.
Based on previous studies, HFD has been shown to cause obesity, hyperglycemia, hyperinsulinemia, and IR.[17,18] The present study showed that rats with free access to HFD consumed more calories, gained more weight, and developed glucose intolerance, while rats with free access to StD containing the same constituents but less fat. The IR in HFD rats presented hyperglycemia, impaired glucose tolerance, including AUC by OGTT and IPITT and HOMA-IR. Doses for E2 were based on our preliminary dose-response experiment of uterine histochemistry and previous studies in utero trophic effects.[19,20] Rather than short-time estrogen effect in other studies, the study is to determine the long-term and stable interaction between IR and EH. In line with previous study, E2 induced epithelial cells to adopt a tall cylindrical shape and a high cytoplasmic and nuclear ratio.[19] Cells from epithelial endometria and glands were hyperplastic, and the endometrial epithelium was pseudostratified and developed squamous metaplasia. Previous studies also revealed that the increase in uterine weight might in part be caused by the fluid imbibition.[21,22] In the present study, both wet and blotted weight of uterus were increased, indicating that uterine weight was partly attributed to fluid imbibition. Moreover, endometrium hyperplasia was mainly observed in luminal and glandular epithelium and myometrium. The height of luminal and glandular in HFD-E2 group (rat with IR and EH) is higher than that in E2 group (rat with EH but IR), and the percentage of endometrial squamous metaplasia in the HFD-E2 group was also higher than E2 group. These results indicate that IR is contributed to uterotrophic response to estradiol.
Previous study showed that adiponectin is highly expressed during adipogenesis, while secretion is significantly reduced in obesity.[11] Women with low circulating levels of adiponectin in serum due to obesity and hyperinsulinemia have high risk of developing endometrial cancer.[23] In the present study, in the absence or presence of IR, plasma adiponectin levels in E2-treatment rats were lower than rats without E2-treatment, which indicated the involvement of estradiol in circulating adiponectin levels. However, after normalized to visceral adipose tissue, plasma adiponectin levels were significantly decreased in rat with IR. Although no statistical differences were found between HFD and HFD-E2 rats, there was a tendency that rat with EH and IR had even lower plasma adiponectin levels than rat only with IR. These results indicate the combination effect of IR and EH on circulating adiponectin levels. Expression of the adiponectin system in the uterus has been observed in mouse, pig, human, and other species during pregnancy, embryo implantation, and the estrous cycle.[24,25,26] Previous studies showed differences in the protein expression of the adiponectin system during the estrous cycle and in early gestation, which demonstrated that the expression of adiponectin system could be modulated by steroid hormones, such as estrone and estradiol.[26,27] The adiponectin mRNA levels in HFD- and E2-treated rats were higher than HFD rats, and a similar trend was observed in E2-treated rats in comparison with control group. In agreement with adiponectin mRNA levels in uterus, immunostaining analysis showed that adiponectin expression was increased in rats with EH compared to rats without EH. Rather than the correlation in plasma adiponectin and visceral adipose tissue, the results in this study suggested that adiponectin in uterus is downregulated in the presence of estradiol. Interestingly, we found brown-stained particle in endometrial and glandular lumen in control and HFD group, indicating that adiponectin protein might have already secreted from luminal and glandular epithelial cells. The study has shown that adiponectin might modulate the growth of normal endometrial epithelial cells through AdipoR1 and AdipoR2.[28] However, the mRNA levels and protein expression of adiponectin receptors showed no significant differences among all groups. We hypothesized that the changes of adiponectin levels are insufficient to significantly affect its receptor levels.
There were several limitations of the present study. First, the number of rats had insufficient power to detect the difference in terms of lipid profile in circulation and adiponectin receptors in uterus, thus further studies with larger sample size are needed. Second, there should be other groups, including OVX rats fed with StD and sham-OVX rat fed with HFD, to confirm the effect of metabolic disorder and estrogen on endometrial lesion.
In summary, the findings in the rat model of HFD-induced IR and 17β-estradiol-induced EH manifested that the condition of IR or hyperinsulinemia modulated uterine alternation. Plasma adiponectin levels were regulated by both metabolic condition and steroid hormones, such as estradiol. However, adiponectin protein in uterus was mainly affected by estradiol that is distinct from disorders related to metabolic disorders, including IR. Nevertheless, further studies are required to elucidate whether adiponectin acts at the uterus level to regulate signaling pathways such as AMP-activated protein kinase.
Financial support and sponsorship
This work was supported by a grant from the National Natural Science Foundation of China (No. 81272870).
Conflicts of interest
There are no conflicts of interest.
Footnotes
Edited by: Peng Lyu
REFERENCES
- 1.Grossmann ME, Ray A, Nkhata KJ, Malakhov DA, Rogozina OP, Dogan S, et al. Obesity and breast cancer: Status of leptin and adiponectin in pathological processes. Cancer Metastasis Rev. 2010;29:641–53. doi: 10.1007/s10555-010-9252-1. doi: 10.1007/s10555-010-9252-1. [DOI] [PubMed] [Google Scholar]
- 2.Grady D, Gebretsadik T, Kerlikowske K, Ernster V, Petitti D. Hormone replacement therapy and endometrial cancer risk: A meta-analysis. Obstet Gynecol. 1995;85:304–13. doi: 10.1016/0029-7844(94)00383-O. doi: 10.1016/0029-7844(94)00383-o. [DOI] [PubMed] [Google Scholar]
- 3.Persson I. Estrogens in the causation of breast, endometrial and ovarian cancers – Evidence and hypotheses from epidemiological findings. J Steroid Biochem Mol Biol. 2000;74:357–64. doi: 10.1016/s0960-0760(00)00113-8. doi: 10.1016/S0960-0760(00)00113-8. [DOI] [PubMed] [Google Scholar]
- 4.Wise MR, Jordan V, Lagas A, Showell M, Wong N, Lensen S, et al. Obesity and endometrial hyperplasia and cancer in premenopausal women: A systematic review. Am J Obstet Gynecol. 2016;214:689–97. doi: 10.1016/j.ajog.2016.01.175. doi: 10.1016/j.ajog.2016.01.175. [DOI] [PubMed] [Google Scholar]
- 5.Kershaw EE, Flier JS. Adipose tissue as an endocrine organ. J Clin Endocrinol Metab. 2004;89:2548–56. doi: 10.1210/jc.2004-0395. doi: 10.1210/jc.2004-0395. [DOI] [PubMed] [Google Scholar]
- 6.Tilg H, Moschen AR. Role of adiponectin and PBEF/visfatin as regulators of inflammation: Involvement in obesity-associated diseases. Clin Sci (Lond) 2008;114:275–88. doi: 10.1042/CS20070196. doi: 10.1042/cs20070196. [DOI] [PubMed] [Google Scholar]
- 7.Arita Y, Kihara S, Ouchi N, Takahashi M, Maeda K, Miyagawa J, et al. Paradoxical decrease of an adipose-specific protein, adiponectin, in obesity. Biochem Biophys Res Commun. 1999;257:79–83. doi: 10.1006/bbrc.1999.0255. doi: 10.1006/bbrc.1999.0255. [DOI] [PubMed] [Google Scholar]
- 8.Fukuda S, Hirata A, Nishizawa H, Nagao H, Kashine S, Kimura T, et al. Systemic arteriosclerosis and eating behavior in Japanese type 2 diabetic patients with visceral fat accumulation. Cardiovasc Diabetol. 2015;14:8. doi: 10.1186/s12933-015-0174-7. doi: 10.1186/s12933-015-0174-7. [DOI] [PMC free article] [PubMed] [Google Scholar]
- 9.Banerjee A, Khemka VK, Roy D, Poddar J, Roy TK, Karnam SA. Role of serum adiponectin and Vitamin D in prediabetes and diabetes mellitus. Can J Diabetes. 2017;41:259–65. doi: 10.1016/j.jcjd.2016.10.006. doi: 10.1016/j.jcjd.2016.10.006. [DOI] [PubMed] [Google Scholar]
- 10.Hotta K, Funahashi T, Arita Y, Takahashi M, Matsuda M, Okamoto Y, et al. Plasma concentrations of a novel, adipose-specific protein, adiponectin, in type 2 diabetic patients. Arterioscler Thromb Vasc Biol. 2000;20:1595–9. doi: 10.1161/01.atv.20.6.1595. doi: 10.1161/01.ATV.20.6.1595. [DOI] [PubMed] [Google Scholar]
- 11.Kadowaki T, Yamauchi T. Adiponectin and adiponectin receptors. Endocr Rev. 2005;26:439–51. doi: 10.1210/er.2005-0005. doi: 10.1210/er.2005-0005. [DOI] [PubMed] [Google Scholar]
- 12.Tilg H, Moschen AR. Adipocytokines: Mediators linking adipose tissue, inflammation and immunity. Nat Rev Immunol. 2006;6:772–83. doi: 10.1038/nri1937. doi: 10.1038/nri1937. [DOI] [PubMed] [Google Scholar]
- 13.Maleszka A, Smolinska N, Nitkiewicz A, Kiezun M, Chojnowska K, Dobrzyn K, et al. Adiponectin expression in the porcine ovary during the oestrous cycle and its effect on ovarian steroidogenesis. Int J Endocrinol. 2014;2014:957076. doi: 10.1155/2014/957076. doi: 10.1155/2014/957076. [DOI] [PMC free article] [PubMed] [Google Scholar]
- 14.Smolinska N, Dobrzyn K, Kiezun M, Szeszko K, Maleszka A, Kaminski T. Effect of adiponectin on the steroidogenic acute regulatory protein, P450 side chain cleavage enzyme and 3ß-hydroxysteroid dehydrogenase gene expression, progesterone and androstenedione production by the porcine uterus during early pregnancy. J Physiol Pharmacol. 2016;67:443–56. [PubMed] [Google Scholar]
- 15.Guo LX, Zhao X, Pan Q, Sun X, Li H, Wang XX, et al. Effect of continuous positive airway pressure therapy on glycemic excursions and insulin sensitivity in patients with obstructive sleep apnea-hypopnea syndrome and type 2 diabetes. Chin Med J. 2015;128:2301–6. doi: 10.4103/0366-6999.163382. doi: 10.4103/0366-6999.163382. [DOI] [PMC free article] [PubMed] [Google Scholar]
- 16.Espinosa I, D’Angelo E, Palacios J, Prat J. Mixed and ambiguous endometrial carcinomas: A Heterogenous Group of tumors with different clinicopathologic and molecular genetic features. Am J Surg Pathol. 2016;40:972–81. doi: 10.1097/PAS.0000000000000640. doi: 10.1097/pas.0000000000000640. [DOI] [PubMed] [Google Scholar]
- 17.Marques-Neto SR, Castiglione RC, Pontes A, Oliveira DF, Ferraz EB, Nascimento JH, et al. Effects of incretin-based therapies on neuro-cardiovascular dynamic changes induced by high fat diet in rats. PLoS One. 2016;11:e0148402. doi: 10.1371/journal.pone.0148402. doi: 10.1371/journal.pone.0148402. [DOI] [PMC free article] [PubMed] [Google Scholar]
- 18.Lozano I, Van der Werf R, Bietiger W, Seyfritz E, Peronet C, Pinget M, et al. High-fructose and high-fat diet-induced disorders in rats: Impact on diabetes risk, hepatic and vascular complications. Nutr Metab (Lond) 2016;13:15. doi: 10.1186/s12986-016-0074-1. doi: 10.1186/s12986-016-0074-1. [DOI] [PMC free article] [PubMed] [Google Scholar]
- 19.Rimoldi G, Christoffel J, Seidlova-Wuttke D, Jarry H, Wuttke W. Effects of chronic genistein treatment in mammary gland, uterus, and vagina. Environ Health Perspect. 2007;115(Suppl 1):62–8. doi: 10.1289/ehp.9367. doi: 10.1289/ehp.9367. [DOI] [PMC free article] [PubMed] [Google Scholar]
- 20.Carthew P, Edwards RE, Nolan BM, Tucker MJ, Smith LL. Compartmentalized uterotrophic effects of tamoxifen, toremifene, and estradiol in the ovariectomized Wistar (Han) rat. Toxicol Sci. 1999;48:197–205. doi: 10.1093/toxsci/48.2.197. doi: 10.1093/toxsci/48.2.197. [DOI] [PubMed] [Google Scholar]
- 21.O’Connor JC, Cook JC, Craven SC, Van Pelt CS, Obourn JD. An in vivo battery for identifying endocrine modulators that are estrogenic or dopamine regulators. Fundam Appl Toxicol. 1996;33:182–95. doi: 10.1093/toxsci/33.2.182. [PubMed] [Google Scholar]
- 22.Reel JR, Lamb JC, 4th, Neal BH. Survey and assessment of mammalian estrogen biological assays for hazard characterization. Fundam Appl Toxicol. 1996;34:288–305. doi: 10.1006/faat.1996.0198. doi: 10.1006/faat.1996.0198. [DOI] [PubMed] [Google Scholar]
- 23.Ashizawa N, Yahata T, Quan J, Adachi S, Yoshihara K, Tanaka K. Serum leptin-adiponectin ratio and endometrial cancer risk in postmenopausal female subjects. Gynecol Oncol. 2010;119:65–9. doi: 10.1016/j.ygyno.2010.07.007. doi: 10.1016/j.ygyno.2010.07.007. [DOI] [PubMed] [Google Scholar]
- 24.Palin MF, Bordignon VV, Murphy BD. Adiponectin and the control of female reproductive functions. Vitam Horm. 2012;90:239–87. doi: 10.1016/B978-0-12-398313-8.00010-5. doi: 10.1016/b978-0-12-398313-8.00010-5. [DOI] [PubMed] [Google Scholar]
- 25.Kim ST, Marquard K, Stephens S, Louden E, Allsworth J, Moley KH. Adiponectin and adiponectin receptors in the mouse preimplantation embryo and uterus. Hum Reprod. 2011;26:82–95. doi: 10.1093/humrep/deq292. doi: 10.1093/humrep/deq292. [DOI] [PMC free article] [PubMed] [Google Scholar]
- 26.Smolinska N, Maleszka A, Dobrzyn K, Kiezun M, Szeszko K, Kaminski T. Expression of adiponectin and adiponectin receptors 1 and 2 in the porcine uterus, conceptus, and trophoblast during early pregnancy. Theriogenology. 2014;82:951–65. doi: 10.1016/j.theriogenology.2014.07.018. doi: 10.1016/j.theriogenology.2014.07.018. [DOI] [PubMed] [Google Scholar]
- 27.Smolinska N, Dobrzyn K, Maleszka A, Kiezun M, Szeszko K, Kaminski T. Expression of adiponectin and adiponectin receptors 1 (AdipoR1) and 2 (AdipoR2) in the porcine uterus during the oestrous cycle. Anim Reprod Sci. 2014;146:42–54. doi: 10.1016/j.anireprosci.2014.02.001. doi: 10.1016/j.anireprosci.2014.02.001. [DOI] [PubMed] [Google Scholar]
- 28.Moon HS, Chamberland JP, Aronis K, Tseleni-Balafouta S, Mantzoros CS. Direct role of adiponectin and adiponectin receptors in endometrial cancer: In vitro and ex vivo studies in humans. Mol Cancer Ther. 2011;10:2234–43. doi: 10.1158/1535-7163.MCT-11-0545. doi: 10.1158/1535-7163.MCT-11-0545. [DOI] [PMC free article] [PubMed] [Google Scholar]