

Abstract
In a recent unit in this series, protocols for the isolation, cryopreservation, thawing, and immunophenotyping of HPBMC isolated from peripheral whole blood using cell surface marker (CSM) staining and multi-color flow cytometry analysis were presented. The current procedure describes the detection and quantification of CSM and intracellular markers (ICM), including transcription factors and cytokines, following activation and differentiation of CD4+ T-cells using multi-color flow cytometry. Results indicated that repeatable and robust detection of ICM could be obtained in surface marker-defined T cells that identify functional subsets of cells. There were no observed differences between fresh and cryopreserved HPBMC in eight phenotypes analyzed (T-CD3, Th-CD4, Tmem-CD45RO, activated T-CD3/CD25, Treg- Foxp3/CD25, Th1-IFNγ, Th2- IL-4, Th17-IL-17A). There was an observed difference in activated T- CD3/CD69 in the short term (30–90 days) cryopreserved samples as compared to the freshly isolated samples, which may have resulted from the variance in controls or small sample size.
Keywords: intracellular staining, flow cytometry, immunophenotyping, HPBMC, toxicology
INTRODUCTION
In a previous protocol, we provided essential information on isolating, cryopreserving, thawing, and staining for CSM on HPBMC, in addition to addressing the effects of cryopreservation on cell surface markers (Lauer et al., 2016). Here we present a companion procedure to profile cellular function and modulation of the immune response using multi-colored staining of intracellular cytokines and the transcription factor FoxP3 in combination with CSM. Intracellular staining of immune cells can give a glimpse into the function and activation of specific cell types, which is important for investigating the overall health of the immune system. In support of using cryopreserved samples results from normal HPBMC, freshly isolated and cryopreserved, stained and analyzed using this procedure are presented and discussed.
T-cell receptor (TCR)-mediated cell activation occurs in response to introduction of a foreign pathogen to the immune system. TCR- mediated activation initiates the adaptive immune response by production of multiple cytokines and subsequent transcription factor activation (Zhu and Paul, 2010). Cytokine production directs the differentiation of naïve CD4+ T-cells into specialized T-helper (Th) subsets equipped to deal with the particular pathogen. There are four well defined types of Th cell subsets: T-helper 1 (Th1), T-helper 2 (Th2), T-helper 17 (Th17) and T regulatory (Treg) cells. Each T-helper subset has a specific function and a unique cytokine production profile (Zhu and Paul, 2010). Th1 cells defend against intracellular pathogens and viruses. Th2 cells control humoral immunity to extracellular parasites and allergic inflammatory responses. Th17 cell are involved in the innate immune response, protecting the host from bacterial infection and fungal diseases. Th17 also are key players in autoimmune diseases in chronic inflammation. However, Treg cells eliminate autoreactive T cells and promote self-tolerance. Each Th subpopulation can be identified by a specific cytokine or set of cytokines that it produces as well as the transcription factor it expresses; Th1 produce interferon-γ (IFNγ) and express the transcription factor T-bet, Th2 cells produce IL-4, IL-5, IL-9, IL-13, and IL-25 and express the transcription factor GATA3. Th17 cells produce IL-17a, IL-17f, and IL-22 and express the transcription factor RORγt (Zhu and Paul, 2010). In addition, IL-2 in the presence of transforming growth factor-ß (TGFß) promotes the differentiation of naïve CD4+ cells into regulatory T cells, or Treg (Davidson et al., 2007) which express the transcription factor Foxp3 (Zhu and Paul, 2010). Interruption or inhibition of the differentiation of Th subsets can lead to defective (suppressed or inappropriately activated) immune responses. Cytokines and transcription factors are among the most commonly used intracellular markers (ICM) for analysis of modulation of the immune response.
Ex vivo, isolated HPBMC must first be activated by antigen or mitogen to produce cytokines. IL-2 is among the first cytokines released. Activated T-cells release IL-2 and may express three different IL-2 receptors; IL-2Rα, IL-2Rß, and the common cytokine receptor gamma chain (γc) on their surface. Initially, activated T-cells release IL-2 which binds CD25 with low affinity and stabilizes a secondary binding site for IL-2Rß binding. Upon binding of IL-2Rß the γc is recruited to bind with the IL-2 as well (Wang et al., 2005). These binding moieties of IL-2 play significant roles in the subsequent cytokine production and initiation of downstream signaling cascades. They are also instrumental in upregulation of pathways mediating cell growth, survival, activation-induced cell death (AICD), and differentiation (Liao et al.,2011). Profiling of CD3+ and CD4+ T-cells with specific cytokines and transcription factors (Figure 1) can be accomplished by using multi-colored, fluorescent labeled antibodies specific for these intracellular and cell surface markers and detection by flow cytometry.
Figure 1.
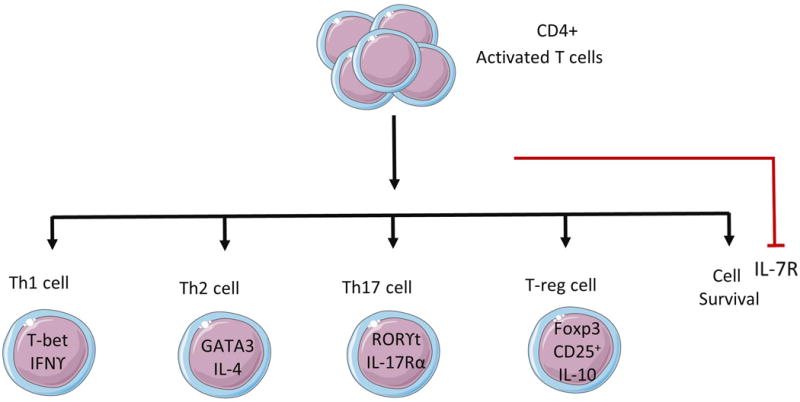
Four major Th subsets and cytokines and transcription factors produced by them.
Figure 2 provides a visual of the sequence of events described in this procedure. In brief, HPBMCs are isolated or thawed and allowed to recover overnight. The following day, cells are stimulated with immobilized anti-CD3 and soluble anti-CD28 for 24 hours, inducing production of IL-2 which binds to CD25, activating CD25 expressing cells, and initiating a positive feed forward loop upregulating further production of IL-2. HPBMCs are then plated and treated with Brefeldin A for 4 hours to block the transport of cytokines from the cell. Cells are then stained for CSM, fixed and permeabilized, and further stained for ICM. Subsequent analysis is then performed using multi-color flow cytometry (Figure 3).
Figure 2.
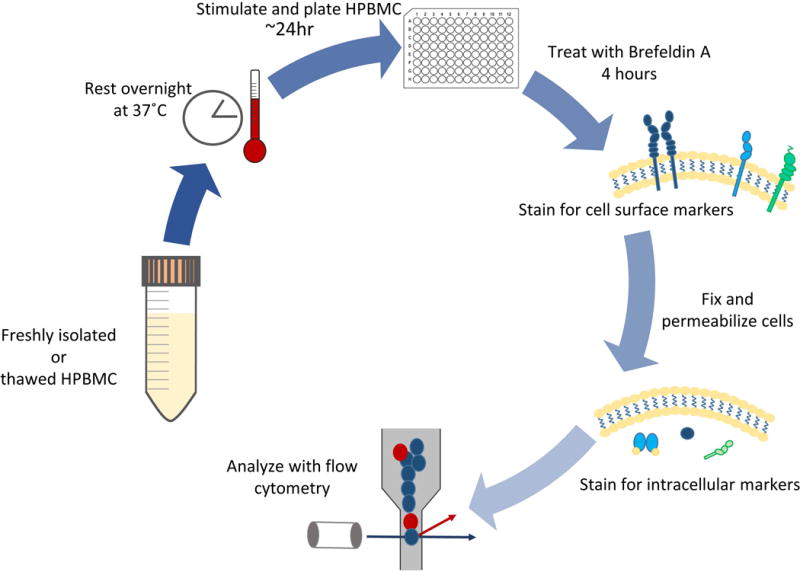
Schematic of the major steps in this procedure.
Figure 3.
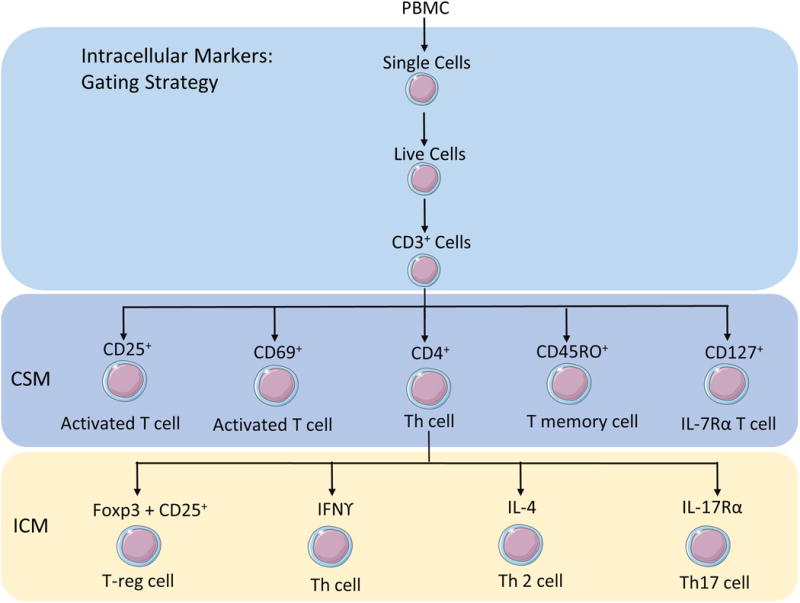
Depiction of the gating strategy and the specific antigen used to identify each subset of cells.
Basic Protocol 1: DETECTION OF INTRACELLULAR MARKERS USING 11-COLOR FLOW CYTOMETRY
Note:
It is somewhat easier and less time consuming to use a repeat pipette to add wash buffer and Brilliant Stain Buffer to the samples.
A multichannel pipette is useful in transferring the samples to the cluster tubes for staining.
Using cluster tubes reduce the handling of individual tubes and allow the supernatants to be poured off simultaneously rather than aspirating one tube at a time.
Cluster tubes also make the transfer of samples from the 96 well plate easier as they can be setup in the same format.
It is recommended to keep the cluster tubes in the rack and box while centrifuging. The legs of the rack may not withstand the centrifugation, the box adds extra support.
When incubating on ice it is best to remove the rack from the box so that the rack can be placed directly into the ice, which will allow direct contact between the ice and the cluster tubes.
Make sure to balance the centrifuge before starting it. A 48 well plate with lid can often be used as a counter balance, adding water to the wells to adjust the weight.
12 × 75 mm tubes can be used in place of cluster tubes.
If using the cluster tubes on a pressurized flow cytometer the cluster tube may be placed inside of a 12× 75 mm tube and then placed onto the cytometer for analysis.
When pouring supernatant out of the cluster tubes it is easiest to fold several Wypall towels to fit over the top the tubes (positioned in the rack), place hand firmly over the towels and rack and then invert the rack/tubes and gently shake once or twice to break the fluid tension releasing the fluid from the tube. Visually inspect the tubes to make sure the fluid has been evacuated, turn the tubes back to an upright position and dispose of the wet towels into a biohazard waste container.
An inhibitor must be used to prevent the transport of the cytokine. Approximately 24 hr after plating, add Brefeldin A to samples for 4 hr, then harvest cells and stain.
Caution:
Use personal protective equipment such as gloves, lab coat and eye protection while handling human derived blood components and hazardous chemicals.
Fixatives used in these procedures contain the hazardous chemicals, formaldehyde and methanol. These chemicals may require special disposal, check with your safety department for instructions on waste management and disposal.
Materials
Biosafety cabinet
Biohazard waste receptacle
96 well, flat bottom cell culture plate for CD3/CD28 stimulation of ICS
96- well polypropylene tubes (cluster tubes; 1.2 ml) in rack with box (Corning® 4410)
Sterile 15 ml conical centrifuge tubes
Sterile transfer pipette
Microcentrifuge tube or other tube with adequate capacity for mixing antibody cocktail
35 mm Petri dishes
12 × 75 mm (5 ml) polystyrene Round bottom tubes (flow tubes; Falcon 352008)
Rack/holder for 12 × 75 mm tubes
Dual position snap caps for 12 × 75 mm tube (Falcon 352032)
Serological pipets sterile 5, 10 and 25 ml
Pipettes 10, 100, 200 and 1000 μl
Multichannel pipette
Tips sterile to fit pipettes
Repeat pipette (50, 200 and 500 μl volumes)
Repeat pipette and tips for 50, 200 – 500 μl volumes
Refrigerated centrifuge with plate carriers (for centrifuging cluster tubes in the rack/box)
Vortex
Plate shaker
Vacuum aspirator
Absorbent paper towels (e.g. Kimberly-Clark’s Wypall L40, all-purpose wipers; Fisher Scientific Cat. No. 19-042-427)
Ice and ice bucket
Aluminum foil
Resting cells for intracellular staining
-
Aliquot 4 × 10⁶ cells into 35 mm Petri dishes in a total of 3.5 ml cRPMI and place into a humidified, 37°C, 5% CO2 incubator overnight to rest. Cells are ~1×10⁶ cell/ml.
Coating of 96 well plate(s) with anti-human CD3 antibody
Dilute anti-CD3 antibody (Ab) diluted to a concentration of 0.5 μg/ml in sterile DPBS−
To a flat bottom 96 well culture plate, add 100 μl of the antibody per well for stimulated samples (2 wells/sample) and add 100 μl of DPBS− to the unstimulated wells (1 well/sample).
Cover with plastic wrap and place at 4°C overnight.
-
Note: plates can also be coated for 2 hr before use by adding the anti-CD3 Ab as instructed above and placing the plate with lid in a humidified 37°C, 5% CO2 incubator.
Plating and activation of HPBMC
Following the overnight rest, collect cells into labeled 15 ml centrifuge tubes using a sterile transfer pipette or other adequate means. Be sure to pipette the contents over the bottom of the plate several times to free any cells that may be attached to the bottom of the plate.
Centrifuge for 10 min at ~240 × g, aspirate and resuspend cells in 720 μl cRPMI [5.6x 10⁶ cell/ml], this will yield 1×10⁵ cells per well when plated (see step 8)
Wash the CD3 coated plate two times by sterilely removing the contents of each well (anti-CD3 Ab or DPBS−) with a multichannel pipette and discarding, then adding 200 μl of sterile DPBS−.
Repeat step 6, then remove all contents and proceed to step 8.
Plate 180 μl cells/well into 3 wells, 2 wells stimulated (1 will be stained and 1 will be unstained) and 1 well unstimulated.
Add 20 μl of 20 μg/ml anti-CD28 to each well to be stimulated (final concentration is 2 μg/ml in the well). Add 20μl of cRPMI to the unstimulated wells.
-
Place plates in incubator (5% CO2, 37°C) for overnight incubation (18 to 24 hr).
Cytokine transport inhibition
Add 22 μl of a 100 μg/ml Brefeldin A (BFA) solution to each well to yield 10 μg/ml per well.
Stock Brefeldin is a 10 mg/ml solution in DMSO. Dilute in media to yield 100 μg/ml (100X) before using.
Place plate on plate shaker for approximately 2 min.
Place plate back into incubator for 4 hr.
Set up labeled cluster tubes in the same configuration as the 96 well plate; this makes the transfer from plate to tube easier.
Add 500 μl cold staining buffer to each cluster tube.
Remove plate from incubator.
Transfer cells from each well using a multichannel pipette and place into the appropriate labeled cluster tube containing DPBS−.
Draw up the mixed contents and use to rinse the wells by pipetting slowly up and down 3 to 4 times then adding it back to the cluster tube. Change tips after collection/rinse from each well to avoid mixing samples.
-
Centrifuge for 10 min, 4°C, at ~240 × g, aspirate/pour off, vortex to resuspend cells and add 50 μl brilliant stain buffer (BSB) to each tube. It is a good idea to separate the stained from the non-stained samples at this point so as not to add antibodies to a sample that should be unstained.
Cell surface marker staining
Calculate the amount of each cell surface marker antibody to be added to the antibody cocktail (add 1 additional sample to the calculation so as not to run out of Ab cocktail). See Table 1 for amounts of cell surface marker antibodies: CD127, CD4, CD69, CD45RO, CD3 and CD25, FVS. Place the antibodies into a microcentrifuge tube or tube with adequate volume capacity.
Add 31 μl of cocktail to each of the cluster tubes of the stained samples. For unstained samples: make a cocktail of 30 μl DPBS− and 1μl FVS for each sample (add 1 additional sample to the calculation so as not to run out of Ab cocktail), then add 31 μl of the cocktail to each of the unstained samples. This assay requires twice as much of the Ab cocktail than the unstained as there are two sets of samples to be stained and one set that is unstained.
Incubate 20 min on ice in the dark.
-
Add 500 μl stain buffer, centrifuge (240 × g, 4°C, 10 min), aspirate/pour off supernatant, and vortex (2–3 sec, low to medium speed).
Fixation and permeabilization using BD Pharmingen™ Transcription Factor Buffer Set (TF Fix/Perm and TF Perm/Wash)
Add 500 μl of freshly prepared TF Fix/Perm Buffer to each tube.
Vortex for approximately 3 sec.
Incubate on ice for 45 min in the dark, centrifuge (240 × g, 4°C, 10 min), aspirate/pour off, vortex (2–3 sec, low to medium speed).
Add 300 μl Perm/Wash, centrifuge (240 × g, 4°C, 10 min), aspirate/pour off, vortex (2–3 sec, low to medium speed).
Add 500 μl of Perm/Wash, centrifuge (240 × g, 4°C, 10 min), aspirate/pour off, vortex (2–3 sec, low to medium speed).
-
Add 50 μl BSB.
Staining of intracellular markers
Calculate the amount of each intracellular marker antibody to be added to the antibody cocktail (add 1 additional sample to the calculation so as not to run out of Ab cocktail). See Table 1 for amounts of the intracellular stains. Place the antibodies into a microcentrifuge tube or tube with adequate volume capacity.
Add 65 μl to each cluster tube. Intracellular markers: IFNg, IL-17A, IL-4, and FoxP3. To the unstained samples add 65 μl of stain/buffer wash solution.
Incubate at 4°C for 45 min in the dark.
Add 500 μl Perm/wash buffer, centrifuge (240 × g, 4°C, 10 min), aspirate/pour off, vortex (2–3 sec, low to medium speed).
Add 500 μl Perm/wash buffer, centrifuge (240 × g, 4°C, 10 min), and aspirate/pour off, vortex (2–3 sec, low to medium speed).
Resuspend cell pellet in 500 μl stain buffer, vortex (2–3 sec, low to medium speed).
Hold overnight at 4°C, cover to protect from the light.
-
Analyze the following day on LRSFortessa.
Staining of color compensation samples/beads
Note:
Stain Anti-mouse Ig,k/Neg control compensation particles the same day/time as the experiment samples. Vortex beads before using them.
The compensation sample for the FVS is an actual unstained HPBMC sample (contains FVS). When running the FVS compensation on the LRSFortessa it is necessary to draw the negative gate indicate the positive gate as well as so that the Diva software can determine the compensation.
In labeled 12×75 mm tubes (flow tubes):
Following manufacturer’s directions: Add 1 drop of Neg and 1 drop of CompBeads to each labeled flow tube.
Add appropriate antibody to labeled tube (See Table 1). One tube will contain no stain; prepare 1 tube for each antibody.
Incubate 20 min at RT in the dark.
Add 1ml staining buffer to each tube, centrifuge (200 × g, 4°C, for 10 min), and aspirate.
Resuspend in 500 μl staining buffer, vortex (2–3 sec, low to medium speed).
Hold overnight at 4°C, cap and cover to protect from the light.
Analyze the following day with the experiment samples.
REAGENTS AND SOLUTIONS
RPMI complete medium (cRPMI)
500 ml RPMI 1640 HEPES modified medium (Sigma Aldrich)
Add 50 ml Fetal Bovine Serum (FBS; Atlanta Biologicals)
Add 5 ml of 200 mM L-glutamine (2 mM final concentration; Sigma Aldrich)
Add 5 ml of 10,000 Units/ml penicillin with 10,000 μg/ml streptomycin sulfate (100 U/ml Penicillin with 100 μg/ml streptomycin sulfate final concentration; Gibco™)
Store up to 1 month at 4°C
Stain Buffer/Wash Solution
500 ml Dulbecco’s Phosphate Buffered Saline (does not contain calcium or magnesium; Sigma Aldrich)
Add 1 ml heat inactivated FBS (0.2% v/v final concentration; Atlanta Biologicals)
Add 0.45g sodium azide (0.09% w/v final concentration; Sigma Aldrich)
Stable at least 1 month at 4°C
BD Pharmingen™ Transcription Factor Buffer Set (BD Biosciences Cat. No. 562574) Contains formaldehyde and methanol! As per manufacturer’s instructions, slowly invert the stock solutions 5 times.
TF Fix/Perm Buffer (4X) [BD Pharmingen; Transcription Factor Reagent]
Dilute Fix/Perm Buffer to a 1X working solution. Example: To make 20 ml add 5 ml of 4X Fix/Perm to 15 ml of Diluent Buffer.
Note: Use within an hour of preparation
Caution: Fix/Perm contains 5% formaldehyde +1.76% methanol. Use personal protective equipment such as gloves, eye protection and lab coat when handling. Collect and dispose of waste according to your facilities regulations.
TF Perm/Wash Buffer (5X) [BD Pharmingen; Transcription Factor Reagent]
Dilute the Perm/Wash Buffer to a 1X working solution. Example: To make 120 ml add 30 ml of 5X Perm/Wash Buffer to 120 ml of dH2O to yield 150 ml of 1X Perm/Wash
Note: Buffer can be stored at 4°C for up to 1 week
Note: Keep all buffers on ice throughout the staining procedure
Brilliant Stain Buffer (BSB; BD Biosciences Cat. No. 563794)
Brefeldin A Ready Made Solution (BFA; Sigma-Aldrich Cat. No. B5936 in DMSO)
Anti-mouse Ig, k/Negative Control Compensation Particles Set (BD Biosciences Comp Bead Cat. No. 552843)
COMMENTARY
Background Information
This procedure is an 11-color multiparameter assay for the detection of Th1, Th2, Th17 and Treg cells in activated HPBMC. It allows up to 32 samples to be processed at one time without automation and can be used for either freshly isolated or cryopreserved HPBMC samples. To obtain quality results it is imperative to start with quality samples. It is highly recommended that the viability should be at least 80% or greater before beginning this procedure. Additional steps are taken throughout this procedure to optimize sample staining and subsequent analysis of the samples. By utilizing cluster tubes several samples can be handled at simultaneously in a time efficient way without automation and in way that reduces cell loss. To increase detection of rare populations of antigen-specific T-cells and low amounts of cytokine, such as IFNγ, cells are rested overnight (Suni et al., 2003). A method that allows the distinction between live cells and dead cells using a fixable viability stain (FVS) is included in the procedure. Along with traditional gating, the use of a viability dye is an additional measure to ensure only live cells are analyzed and to reduce detection of cells stained due to non-specific binding of the antibodies to dead cells. Compared to the traditional immuno-isotypes, unstained and unstimulated cells are preferred controls to examine cellular responses in the stimulated cells while allowing for the basal expression of target molecules and characterization of cellular subsets in unstimulated samples to be taken into account. As such, results of flow cytometry are reported here as percentage of live cells.
CRITICAL PARAMETERS
Antibodies
Optimal antibody choice is determined by the cell type or cellular event of interest and the capabilities of the available flow cytometer. It is essential for the user to understand the principles of flow cytometry and the configurations of the instrument they will be working with. There are a multitude of articles and online references (such as BD Biosciences, Excyte) that are valuable for fluorochrome selection based on the laser lines and filters of the instrument. After choosing the optimal antibodies, it’s important that they are properly vetted in the lab prior to study commencement. It is helpful when creating an experimental panel to match antibodies conjugated to bright fluorochromes with antigens expressed at low levels and to choose fluorochromes that are less bright for more highly expressed antigens. This will allow the user to achieve the most efficient panel design staining possible. For optimal performance of antibodies, store vials according to the manufacturers’ directions at 4°C and do not freeze. The fixable viability stain (lyophilized) is stored at −80°C for long term storage and −20°C for the reconstituted aliquots for short-term storage. Fluorochrome-conjugated antibodies should be protected from light and used before their expiration date. It is important that the antibodies being used in a procedure have been tested with all staining reagents, such as wash and permeabilization buffers, as well as fixatives to ensure the integrity of the antigen and therefore the detection of it. This assay is designed to accommodate large numbers of samples over long periods of time where titration is not practical so the antibody volumes in Table 1 are BD Bioscience’s recommended volumes. It is important to run compensation samples with each batch of samples to adjust for slight differences in the fluorescence of the antibody (see Color Compensation and Flow Cytometry below).
Stimulated stained, unstimulated stained, and stimulated no stain samples
In this procedure we conduct three situations, stimulated stained, stimulated no stain, and unstimulated stained in order to accurately describe the cells of interest. Stimulated stained cells are the samples stimulated to produce cytokine/activate transcription factor and are stained for cell surface markers in conjunction with intracellular markers, these samples are representative of the state of the immune system in a donor. Unstimulated stained samples indicate the ability of the immune system to respond when compared to activated cells. These samples can also be informative as to an already activated state of the immune system and/or the basal levels of cytokine production and transcription factor activation in the unstimulated cells. Stimulated no stain serve more or less as an indicator of autofluorescence as well as fluorescence that may not have been compensated out. In large assay numbers with multiple antibodies it is not advantageous to use isotype controls. In addition, it may confound the processing of the samples. Nonspecific staining should be investigated before using a set multi-colored panel.
Fixable viability stain
The use of a FVS is recommended in order to eliminate dead cells during analysis and thereby reduce the detection of non-specific binding of antibodies to the dead cells. Although the sample size used for this analysis was small, significant variations in Th2 cells (CD4+ IL4+) and Th17 cells (CD4+ IL-17A+) could be observed between cells stained with or without FVS due to the non-specific binding of cytokine IL4 and IL17A antibodies to dead cells in the cryopreserved cells (Table 2). BD, as well as other companies, offer a variety of fluorescent fixable viability stains each with unique excitations and emissions. The compatibility of the FVS with the fixation and permeabilization should be determined before use in a multi-colored panel.
Table 2. Percentage readouts of HPBMC subpopulation cell surface and intracellular markers with and without fixable viability stain.
Normal donor cryopreserved HPBMC were stained and analyzed using FlowJo V10 analysis software, either including dead cells (− FVS) or gating out dead cells (+ FVS). For comparison purposes total count and percentage of single cells for each phenotype are reported for short term (ST Cryo ~ 30 days) and long term (LT Cryo >180 days) cryopreservation.
| ST Cryo | ST Cryo | LT Cryo | LT Cryo | |
|---|---|---|---|---|
| (−FVS) | (+FVS) | (−FVS) | (+FVS) | |
| PBMC Count | 30785.33 | 30785.33 | 31038.25 | 31038.25 |
| Single cells (% PBMC) | 99.38 | 99.38 | 99.05 | 99.05 |
| Live cells (% single cells) | – | 87.10 | – | 86.90 |
| CD3+ | 75.48 | 68.35 | 73.35 | 66.80 |
| CD4 + | 46.88 | 44.77 | 48.03 | 46.00 |
| CD4 FoxP3+CD25+ | 6.22 | 6.15 | 7.03 | 6.99 |
| CD4 IFNg w-IL4 | 0.91 | 0.89 | 0.79 | 0.77 |
| CD4 IFNg+ | 0.89 | 0.89 | 0.74 | 0.73 |
| CD4 IL-4+* | 1.35 | 0.27 | 1.29 | 0.18 |
| CD4 IL17A+* | 0.44 | 0.19 | 0.34 | 0.15 |
| CD3+ CD45RO+ | 36.75 | 32.47 | 35.08 | 31.03 |
| CD3+ CD69+ | 63.28 | 62.40 | 55.60 | 54.73 |
| CD3+ CD127+ | 0.18 | 0.17 | 0.09 | 0.08 |
| CD3+ CD25+ | 49.75 | 49.07 | 37.68 | 36.98 |
Indicates significant differences between groups, with and without FVS. HPBMC phenotypes expressing IL-4 showed significant differences with and without FVS as did HPBMC subgroups expressing IL-17A. Groups were n=6 for ST Cryo, and n=4 for LT Cryo. Data shown as mean. Analysis of HPBMC was performed using multicolor flow cytometry (FACSDiva, and FlowJo V10 software). Statistical analysis (t-test) performed using SigmaPlot version 12.5.
Fixation and permeabilization
The protocol described in this unit allows for simultaneous detection of cell surface markers and intracellular antigens at the single-cell level. This procedure combines the fixation and permeabilization into one step which is recommended for transcription factors but can also be used for cytokine detection. Prior to fixation CSM should be stained to avoid damaging the surface antigens, followed by the fixation and permeabilization of the cell prior to intracellular staining to ensure the stability of soluble and easily degradable antigens. Permeabilization of the cell results in the formation of pores in the cell and nuclear membranes, allowing fluorescent labeled antibodies free access to the cytoplasm and nucleus of the cell. Antibody compatibility with different buffer systems should be determined in pilot studies prior to commencing large scale studies. There are several methods of fixation and permeabilization, this procedure uses BD Pharmingen Transcription Factor Buffer set which contains formaldehyde to keep the proteins in place and methanol to permeabilize the cell, allowing the antibodies access to the marker epitopes. For further reading on various fix/perm treatment options (for cell lines) please see Krutzik and Nolan 2003.
Stimulation/activation conditions
CD69 is a marker for cell activation, if there are no CD69 positive cells activation of the sample has not occurred. Revisit the stimulation procedure and confirm that the reagents used, CD3/CD28, are not past expiration date. CD3/CD28 labeled beads are also available for use. However, the use of beads may contribute to non-specific fluorescence as they can auto-fluoresce.
Inhibition of cytokine secretion
Labeling of secreted proteins, such as cytokines, add an additional challenge. Inhibition of the cytokine(s) transport is imperative so as to be able to detect the cytokine. For staining these proteins, it is recommended to use Brefeldin A, or a similar compound (such as monensin) which prevents protein transport and accumulation of secreted proteins in the endoplasmic reticulum or the Golgi apparatus, respectively. Researchers have used the inhibitors in combination as well as singularly, in this assay Brefeldin A was adequate.
Color Compensation and Flow cytometry
Users should be accustom with the use and the procedures for color compensation on their instrument. Correct compensation is necessary for accurate results. Color compensation is used to eliminate or reduce false fluorescent signal that may result from spectral overlap between fluorescent dyes when using multiple fluorescent antibodies. One example of spectral overlap, otherwise known as spillover, can be observed when using FITC and PE. FITC has a broad emission spectrum that overlaps with the spectra from PE. Therefore, it’s possible for the cytometer to detect emission of FITC labeled cells within the PE signal such false positives are eliminated electronically through the method of compensation. In order to reduce spillover, it is important for users to understand the configuration (laser and detector options) of the flow cytometer available and to choose fluorochromes wisely based on these parameters to reduce the chance of spillover. It is recommended that the compensation samples be stained at the same time in the same manner as the actual samples being analyzed. Please refer to Antibodies section for information on online resources to assist in antibody selection. For further reading on compensation and its importance please see Pockley et al., 2015 or Nguyen et al., 2013.
This procedure utilizes compensation beads stained with each antibody and analyzed by the FACSDiva Software on the LSRFortessa cytometer to create the compensation analog. Compensation samples are ran with each assay so as to adjust for differences in staining of a particular assay which can have day to day variations. A special compensation sample must be created for the FVS compensation control. This control can be either an extra sample created from the resting HPBMC or can be one of the unstained HPBMC samples that is to be analyzed. This sample should contain only FVS. For analysis on the LSRFortessa, compensation gates for the negative stained cells as well as the positive stained cells in the sample must be indicated by the user. Cytometers vary as to their compensation abilities and how the compensation is carried out. It is important that the user be aware of these details and informed on how to set up and use the compensation produced for analysis of the samples.
Gating analysis
We describe here a method to identify and quantitate T-helper subsets involved in the adaptive immune response. Figure 4 presents one possible gating strategy, created using FlowJo Software, to identify CD4+ differentiated subsets including Th1, Th2, Th17 and Treg.
Figure 4.
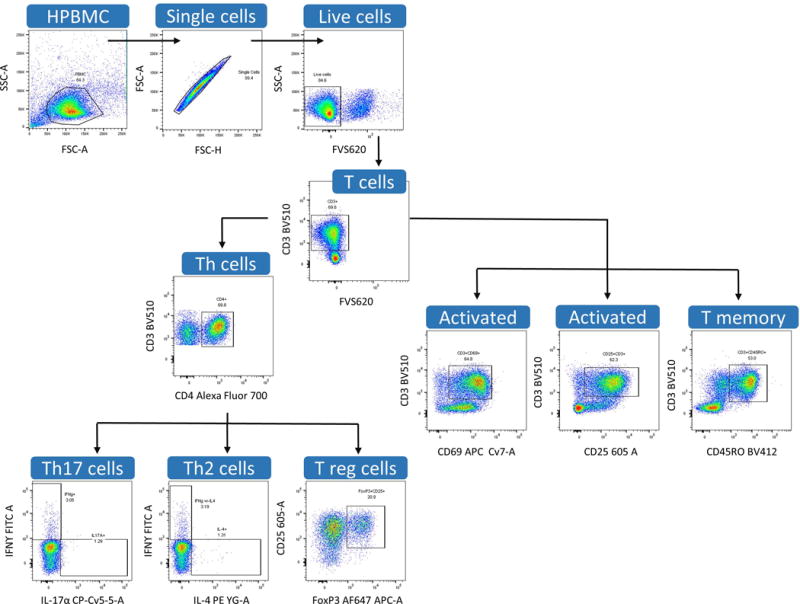
Examples of gating strategy using dot plots created in FlowJo V10 software.
HPBMC populations are first gated using forward and side scatter gating, followed by gating for single cells using FSC-H vs FSC-A to eliminate cell aggregates. Dead cells are then excluded from analysis using fixable viability staining. Following this, T cells can be gated using their distinguishing cell surface marker, CD3 and further discriminated as T-helper cells utilizing the CD4+ CSM. T cell specific subsets can then be defined by their activation markers, cytokine expression, or transcription factor expression. However, as previously mentioned, it is important to note that many combinations are possible with multi-colored flow cytometry and that other phenotypes can also be determined from this same platform.
ANTICIPATED RESULTS
This protocol focuses on the resulting T-cell subsets from an immune adaptive response precipitated by anti-CD3/anti-CD28 stimulation. The data presented here are from both freshly isolated and cryopreserved (two time periods) HPBMC. The use of cell surface markers in combination with intracellular markers is necessary for the identification and quantification of specific Th-cell subsets and T-reg cells, and to determine activation status. This protocol outlines the staining and gating strategy for analysis of T-cell specific subpopulations. As such it is necessary to determine possible effects of cryopreservation on downstream immunophenotyping analysis of HPBMC. Therefore, using a small sample group of healthy donors, peripheral blood was isolated and processed according to the protocol previously presented (Lauer et al., 2016) on either freshly isolated HPBMC or cryopreserved HPBMC form the same donors. CSM and ICM were analyzed for significant alterations in stimulated and unstimulated HPBMC using 11-color flow cytometry. Results indicate that were no observed differences between fresh and cryopreserved HPBMC in eight phenotypes analyzed. However, there was a significant differences in CD3+ CD69+ expressing T-cells could be seen following short term cryopreservation (Figure 5, A,B) compared to the fresh, in both stimulated and unstimulated samples. This difference could in part be attributed to the small sample size (n=7) and the large degree of variance in the freshly isolated HPBMC samples that were CD3+/CD69+. It is expected that the CD3, CD4 expression should not be altered in unstimulated samples. It is also expected that CD25 expression should somewhat mimic that of CD69 as it is binding of the CD25 receptor on lymphocytes which initiates the cascade of cytokine production and hence the signaling for differentiation following activation (Liao et al., 2011) indicated by CD69.
Figure 5.
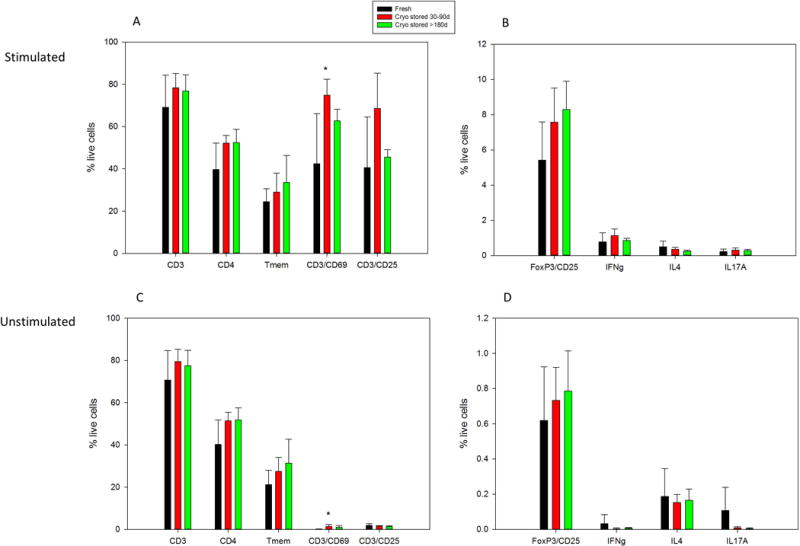
Normal HPBMC in stimulated and unstimulated conditions. Black bars represent freshly isolated and analyzed HPBMC, whereas red and black bars represent HPBMC analyzed following short term cryopreservation (Cryo stored 30–90 days) and long term cryopreservation (>180 days). Data revealed significant differences in the CD3/CD69 phenotype of the short term cryopreserved in both the stimulated and unstimulated samples (p values = 0.012 and 0.010 respectively) (A,C). No significant differences were seen in unstimulated HPBMC between fresh and cryopreserved samples (C,D). Groups were N=7 for fresh, n=6 for short term cryopreserved, and N=4 for long term cryopreserved. Data shown as mean +/- standard deviation. Analysis of HPBMC was performed using multicolor flow cytometry (FlowJo software). Statistical analysis (One Way ANOVA followed by Dunnett’s Method for multiple comparisons versus control group) performed using SigmaPlot version 12.5.
TIME CONSIDERATIONS
Prior to CSM and ICS, the freshly isolated or thawed HPBMC are rested for approximately 24 h, followed by 16–18 h activation with anti-CD3/anti-CD28 and then inhibition of cytokine secretion is inhibited for 4 h. The staining procedure for CSM requires a 20 min incubation followed by a 45 min fixation/permeabilization step and subsequent 45 min incubation for ICS. The entire procedure from resting through staining requires approximately 3 days. Stained cells are held overnight at 4°C protected from light and analyzed the following day but can instead be analyzed upon the completion of staining.
Table 1. Intracellular staining markers used in Basic Protocol.
Table contains information on fluorescent labeled antibodies as well as the amounts used for cell surface and intracellular staining. Flow cytometer laser and filter requirements are also listed. All antibodies used for staining were purchased from BD Biosciences.
| Laser | Filter | Fluorochrome | Specificity | Clone | Cat. No | Amount Ab |
|---|---|---|---|---|---|---|
| Blue 488 nm | 530/30 | FITC | IFNg | B27 | 552887 | 20 μl |
| 695/40 | PerCP-Cy™5.5 | IL-17A | N49-653 | 560799 | 5 μl | |
|
| ||||||
| Yellow -Green 561 nm | 582/15 | PE | IL-4 | 8D4-8 | 559333 | 20 μl |
| 610/20 | PE-CF594 | FVS620 | 564996 | 1 μl | ||
| 780/60 | PE-Cy™7 | CD127 | HIL-7R-M21 | 560822 | 5 μl | |
|
| ||||||
| Red 640 nm | 670/14 | Alexa Fluor 647 | FoxP3 | 259D/C7 | 560045 | 20 μl |
| 730/45 | Alexa Fluor 700 | CD4 | RPA-T4 | 557922 | 5 μl | |
| 780/60 | APC-Cy™7 | CD69 | FN50 | 557756 | 5 μl | |
|
| ||||||
| Violet 405 nm | 450/50 | BV421 | CD45RO | UCHL1 | 562641 | 5 μl |
| 525/50 | BV510 | CD3 | UCHT1 | 563109 | 5 μl | |
| 605/12 | BV605 | CD25 | 2A3 | 562660 | 5 μl | |
Significance Statement.
The ever vigilant and reactive human immune system is the body’s first defense against pathogens such as bacteria and viruses. Activation of the T-cell receptor and subsequent differentiation of naïve CD4 T-lymphocytes into distinct effector subtypes through orchestrated secretion of specific cytokines is imperative in the modulation of the immune response to foreign antigens. Flow cytometry, in combination with a multitude of fluorescence-labeled antibodies and associated technologies, allows examination of specific cellular subsets of the immune system. This current methods describe sample handling, activation, and staining of cell surface markers in combination with intracellular staining of cytokines and/or transcription factors for identification and quantification of CD4+ subpopulations using multi-colored flow cytometry analysis in human peripheral blood mononuclear cells (HPBMC).
Acknowledgments
This work was supported by grants from the National Institutes of Health (R01-ES019968 to SWB and R01CA207051-01 to EB)
Literature Cited
- Davidson TS, DiPaolo RJ, Andersson J, Shevach EM. Cutting edge: IL-2 is essential for TGF-beta-mediated induction of Foxp3+ T regulatory cells. J immunol. 2007;178(7):4022–4026. doi: 10.4049/jimmunol.178.7.4022. [DOI] [PubMed] [Google Scholar]
- Krutzik PO, Nolan GP. Intracellular phospho-protein staining techniques for flow cytometry: Monitoring single cell signaling events. Cytometry. 2003;55A:61–70. doi: 10.1002/cyto.a.10072. [DOI] [PubMed] [Google Scholar]
- Lauer et al., 2016
- Liao W, Lin JX, Leonard WJ. IL-2 family cytokines: new insights into the complex role of IL-2 as a broad regulator of T helper cell differentiation. Curr Opin Immunol. 2011 Oct;23(5):598–604. doi: 10.1016/j. 2011. Epub2011 Aug 31. [DOI] [PMC free article] [PubMed] [Google Scholar]
- Nguyen R, Perfetto S, Mahnke YD, Chatopadhyay P, Roederer M. Quantifying spillover spreading for comparing instrument performance and aiding in multicolor panel design. Cytometry A. 2013;83(3):306–15. doi: 10.1002/cyto.a.22251. [DOI] [PMC free article] [PubMed] [Google Scholar]
- Pockley AG, Foulds GA, Oughton JA, Kerkvliet I, Multhoff G. Immune cell phenotyping using flow cytometry. Curr Protoc Toxicol. 2015;66(18):8, 1–34. doi: 10.1002/0471140856.tx1808s66. [DOI] [PubMed] [Google Scholar]
- Suni MA, Dunn HS, Orr PL, de Latt R, Sinclair E, Ghanekar SA, Bredt BM, Dunne JF, Maino VC, Maecker HT. Performance of plate-based cytokine flow cytometry with automated data analysis. BMC Immunology. 2003:9. doi: 10.1186/1471-2172-4-9. R. [DOI] [PMC free article] [PubMed] [Google Scholar]
- Wang X, Rickert M, Garcia KC. Structure of the quaternary complex of interleukin-2 with its alpha, beta, and gammac receptors. Science. 2005;310(5751):1159–1163. doi: 10.1126/science.1117893. [DOI] [PubMed] [Google Scholar]
- Zhu J, Paul WE. Peripheral CD4+ T-cell differentiation regulated by networks of cytokines and transcription factors. Immunol Rev. 2010 Nov;238(1):247–262. doi: 10.1111/j1600-065x.2010.00951.x. [DOI] [PMC free article] [PubMed] [Google Scholar]