

Abstract
We have used site-directed spin labeling and EPR spectroscopy to detect structural changes within the regulatory light chain (RLC) of smooth muscle myosin upon phosphorylation. Smooth muscle contraction is activated by phosphorylation of S19 on RLC, but the structural basis of this process is unknown. There is no crystal structure containing a phosphorylated RLC, and there is no crystal structure for the N-terminal region of any RLC. Therefore, we have prepared single-Cys mutations throughout RLC, exchanged each mutant onto smooth muscle heavy meromyosin, verified normal regulatory function, and used EPR to determine dynamics and solvent accessibility at each site. A survey of spin-label sites throughout the RLC revealed that only the N-terminal region (first 24 aa) shows a significant change in dynamics upon phosphorylation, with most of the first 17 residues showing an increase in rotational amplitude. Therefore, we focused on this N-terminal region. Additional structural information was obtained from the pattern of oxygen accessibility along the sequence. In the absence of phosphorylation, little or no periodicity was observed, suggesting a lack of secondary structural order in this region. However, phosphorylation induced a strong helical pattern (3.6-residue periodicity) in the first 17 residues, while increasing accessibility throughout the first 24 residues. We have identified a domain within RLC, the N-terminal phosphorylation domain, in which phosphorylation increases helical order, internal dynamics, and accessibility. These results support a model in which this disorder-to-order transition within the phosphorylation domain results in decreased head–head interactions, activating myosin in smooth muscle.
Keywords: EPR, regulation, structure
Smooth muscle contraction is activated by phosphorylation of Ser-19 on myosin regulatory light chain (RLC) (1). The goal of the present study is to elucidate the structural changes that are induced in RLC upon phosphorylation. Several essential structural features of this regulatory process have been identified. First, regulation by phosphorylation requires two myosin heads, because both S1 and single-headed myosin are constitutively active (2, 3). A portion of the α-helical coiled-coil tail (S2) region appears also to be required for regulation (4). Thus the two-headed heavy meromyosin (HMM) fragment has all of the features that are needed for full regulation.
What structural elements of RLC are important for regulation? Chimeras containing the C terminus from skeletal RLC and the N terminus from smooth RLC remain in the “off” state even after phosphorylation, suggesting that the C-terminal domain of RLC is important for regulation (5). Mutational studies suggest that the “linker helix,” which connects the N- and C-terminal lobes of RLC, is crucial for regulation (6). The N-terminal 24 aa of RLC, which include the sites of phosphorylation (Thr-18, Ser-19), are proposed to play an important role in RLC function (7–9), but there is no structural information about this N-terminal sequence in any published crystal structure of any myosin isoform or fragment. Structural information about this region is needed to explain how phosphorylation activates the actomyosin complex.
Because regulation of smooth muscle myosin requires both heads, mechanistic models have focused on how head–head interactions might inhibit the actomyosin interaction and how phosphorylation might relieve this inhibition. Photo-crosslinking data, obtained from tissue-purified HMM, have been used to support a model in which the RLCs of the two heads interact directly to form the inhibited state, and that these head–head interactions are released by RLC phosphorylation (10). In contrast, EM data, obtained from expressed chicken gizzard HMM arrayed on lipid monolayers (11, 12), have been used to support a model in which the inhibitory head–head interactions are primarily between the catalytic domains, rather than the regulatory domains. The EM results show little or no evidence for a phosphorylation-dependent change in the interaction of RLCs of the two heads, but it is clear that this question cannot be answered definitively without obtaining structural information in the region of phosphorylation, the first 24 aa of RLC. The goal of the present study is to obtain this information as a function of phosphorylation under physiological conditions, so that structural changes can be correlated directly with regulatory function.
In recent years, site-directed spin labeling has proven to be the method of choice for detecting protein structural changes under conditions where high-resolution crystallography and NMR are not applicable (13, 14). In this technique, spin labels are attached to a series of selected sites on a protein, and the rotational dynamics and accessibility of these probes are analyzed sequentially by EPR, revealing details about protein structure and dynamics. In the present study, we have performed site-directed spin labeling to detect structural changes in the RLC, with particular emphasis on the N-terminal domain. Single-Cys mutants of RLC were prepared, spin-labeled, and incorporated into smooth muscle HMM with full retention of regulatory function, and EPR was used to obtain information on the structural dynamics of RLC, in the presence and absence of phosphorylation.
Materials and Methods
Preparation of Tissue-Purified Proteins. Smooth muscle myosin (15), native myosin RLC (16), and myosin light chain kinase (17) were prepared from frozen chicken gizzards. HMM and S1 were prepared by digesting myosin with Staphylococcus V8 protease, followed by gel filtration (18). Protein concentrations were determined by using the following extinction coefficients at 280 nm (M–1·cm–1): myosin 2.69 × 10⁵, HMM 2.28 × 10⁵, S1 8.17 × 10⁴, RLC 6.74 × 10³, and myosin light chain kinase 3.24 × 10⁴ (9, 17).
Expression and Purification of Mutant RLC. Chicken gizzard RLC mutants were expressed in Escherichia coli by using the Pet3a expression system (Novagen). The cDNA, kindly provided by Renne Lu (Boston Biomedical Research Institute, Watertown, MA), contained the mutation C108A, forming a null cysteine construct. Using the QuikChange Mutagenesis system (Stratagene), we introduced single-Cys mutations at specific positions in RLC. Sequences were verified at the Microchemical Facility of the University of Minnesota, and the Pet3a-RLC with the desired mutation was transformed into the expression strain BL21AI (Invitrogen). Inclusion bodies were isolated and solubilized in 7 M urea, and RLC was purified on an anion-exchange column (19).
Preparation of Spin-Labeled HMM and S1. Mutant RLC, at a concentration of ≈100 μM, was dialyzed into a labeling buffer containing 10 mM 4-(2-hydroxyethyl)-1-piperazinepropanesulfonic acid (pH 8.0), 50 mM NaCl, and 5 mM EDTA, then incubated with a 2.5 molar excess of 3-(5-f luoro-2,4-dinitroanilino)-PROXYL (Aldrich) spin label at 4°C overnight (20). Free label was removed by using a PD10 desalting column (Amersham Pharmacia). HMM or S1, at a protein concentration of ≈6 μM, was dialyzed into exchange buffer containing 10 mM NaHPO4 (pH 7.5), 0.5 M NaCl, 5 mM EDTA, 2 mM EGTA, and 1 mM DTT overnight. The labeled RLC was also dialyzed overnight in exchange buffer but without DTT, which was required to preserve the ATPase activity of HMM. DTT was omitted in solutions containing only spin-labeled RLC, to avoid reduction of the spin label by DTT. After binding to HMM, the signal from spin-labeled RLC was stable, even in the presence of 1 mM DTT. This was a unique property of the 3-(5-fluoro-2,4-dinitroanilino) spin label. In the presence of DTT, other labels either dissociated from RLC (e.g., disulfide-linked spin labels such as methanethiosulfonate spin label) or lost significant amounts of signal (e.g., iodoacetamide or maleimide spin labels). For exchange of labeled RLC onto HMM or S1, 0.9 moles of spin-labeled RLC per mole of heads (i.e., 1.8 mole per mole of HMM and 0.9 mole per mole of S1), and 1 mM ATP and 5 mM EDTA were added before the exchange reaction was started. After 60 min at 42°C, the sample was removed and 15 mM MgCl2 was added slowly (21). The sample was then exchanged and concentrated in 10 mM Mops (pH 7.0), 50 mM NaCl, 0.2 mM EGTA, and 100 μM DTT (EPR buffer), with an Ultrafree spin concentrator with a molecular weight cutoff of 100,000 (Millipore), so that any excess labeled RLC was removed. Quantitation of spin-label and protein concentrations showed that the fraction of spin-labeled RLC in the samples used for ATPase and EPR experiments was typically ≈0.5 but varied from 0.3 to 0.8. Control EPR experiments were performed, in which the ratio of added labeled RLC per head was varied. The fraction of free (rapidly tumbling) RLC was consistent with the conclusion that (i) labeled RLC bound with approximately the same affinity as unlabeled RLC, and (ii) binding was stoichiometric (one RLC per head, approximately half of which were labeled).
Phosphorylation. Phosphorylation was performed on HMM (or S1) and spin-labeled RLC separately before the exchange process to ensure that all myosin heads contained phosphorylated RLC. The protein was dialyzed into 10 mM Tris·HCl, pH 7.5/50 mM NaCl/2.5 mM MgCl2/2.5 mM CaCl2, followed by addition of 0.6 μM myosin light chain kinase (purified from chicken gizzard), 5 μg/ml calmodulin (Sigma), and 1.5 mM ATP-γ S (Roche Applied Science). This mixture was incubated at 25°C for at least 1 h (7). The extent of phosphorylation was determined by electrophoresis on a 15% polyacrylamide gel containing no SDS (10). The sample buffer contained 8 M Urea, 0.3 M Tris·HCl (pH 8.9), and 4% 2-mercaptoethanol and bromophenol blue. In all samples, densitometry of Coomassie-stained gels showed that RLC was at least 90% phosphorylated, as indicated by a complete shift of the RLC band.
Actin-Activated ATPase Activity. Samples were dialyzed into 10 mM Mops, pH 7.0/2 mM MgCl2/0.2 mM EGTA/1 mM DTT. The concentration of HMM during the assay was 1 μM (unphosphorylated) or 0.5 μM (phosphorylated), and the actin concentration was 25 μM. The reaction was started by adding 1 mM ATP (9), and phosphate release was measured colorimetrically by using the malachite green-enhanced ammonium molybdate assay (22). Activity was negligible in the absence of actin.
EPR Spectroscopy. Spectra were acquired by using a Bruker EleXsys 500 spectrometer with the SHQ cavity. Samples were maintained at 25°C by using the Bruker temperature controller through which nitrogen or oxygen gas flowed. All spectra were obtained with a 120-G scan width, using 100-kHz field modulation with a peak-to-peak amplitude of 5 G. Saturation curves were obtained by monitoring the peak-to-peak intensity of the central resonance as a function of incident microwave power.
To obtain optimum signal intensity from a dilute aqueous sample, a multibore sample cell, constructed from a bundle of gas-permeable Teflon capillaries, was used in all EPR experiments. The capillaries (Teflon tubing, 28-gauge, 0.38 mm i.d., 50 mm long) were filled with the sample, sealed on both ends with X-sealant (Bruker), then bundled inside a 4-mm i.d. quartz NMR tube. A cap, with holes punched into it, was placed on one end, and the other end was left open. The bundle of capillaries extended through the entire 4-cm active height of the SHQ cavity.
Most aqueous EPR samples have volumes of 10 μl or less, because the absorption of microwaves by water degrades the cavity quality factor Q and thus decreases sensitivity. For the SHQ cavity used in the present study, maximum signal intensity for a single cylindrical tube is reached at an i.d. of 0.6 mm (23), corresponding to a sample volume of ≈10 μl. This restriction to small volumes is acceptable only if the spin-label concentration is on the order of 100 μM or more. However, in the present study, the spin-label concentration was typically 10–20 μM, because of limitations in protein solubility. We found that the multibore cell, containing ≈100 μl in 20 capillaries, produced 10 times the signal intensity of the single 10-μl tube. Thus, at constant spin concentration, the multibore cell increases the signal intensity by a factor of 10. This enhancement arises from the complex effects of heterogeneous sample geometry on dielectric constant (24). The separation of the sample into separate tubes diminishes the dissipation of microwave energy, thus improving Q and signal intensity. Although this sample cell shares some features with the Bruker AquaCell, the ability to vary capillary number and the use of Teflon for gas permeability provided significant improvements for the present study.
Rotational Dynamics. The EPR spectrum provides information about anisotropic rotational motions of the spin label on the nanosecond time scale. If we assume that the spin label undergoes only subnanosecond rotational motions, the amplitude of these motions is given by the half-cone angle
 |
[1] |
where the order parameter S = (T′II – T0)/(TII – T0). 2T′II is the separation between the outer extrema, TII (35.0 G) is the rigid-limit value of this splitting, determined from a frozen sample, and T0 (15.9 G) is the isotropic-limit value, measured at the zero-crossing points from a solution of freely tumbling spin-labeled RLC. TII and T0 were unaffected by RLC phosphorylation. θc = 90° indicates unrestricted rotation (isotropic limit, S = 0), and θc = 0° indicates complete restriction (rigid limit, S = 1).
Solvent Accessibility. Accessibility of the spin label to dissolved O2 was determined from enhancement of spin-label relaxation, essentially as described (25). O2 is a collisional paramagnetic relaxant, enhancing spin relaxation and thus decreasing saturation, returning the spin system toward Boltzmann equilibrium (26). Experiments were performed with the sample equilibrated with either O2 or N2. Saturation was measured in a “saturation rollover” experiment, in which signal intensity was recorded as a function of incident microwave power, and the data set was fit to
 |
[2] |
where A is the signal intensity, P is the microwave power, P1/2 is the microwave power at half-saturation, and ε is a measure of the homogeneity of the spectral line (25). Assuming that O2 concentration and mobility do not vary from sample to sample, solvent accessibility is proportional to the collision frequency, ω, which is proportional to
 |
[3] |
where ΔH is the peak-to-peak width of the central EPR line (27).
To detect periodic variation in accessibility ΔP′1/2 along the RLC sequence, the Fourier transform power spectrum p(ω) was calculated according to refs. 28 and 29
 |
[4] |
where hk is the accessibility value of residue k and ω is the angular frequency in degrees.
The sum is from k = 0 to l – 1, where l is the number of residues in a window, which was scanned along the protein sequence. The periodicity index αPI was calculated as (29)
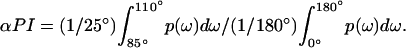 |
[5] |
The interval of integration in the numerator was centered at 97.5°, corresponding to the dominant frequency of an α-helix. A value of αPI ≥ 2 is considered to be strong evidence for α-helical periodicity (29).
Results
Functional Characterization of HMM Containing Spin-Labeled Mutant RLC. To ensure the accurate correlation of structure and function, actin-activated ATPase activity was measured in the absence and presence of phosphorylation for each spin-labeled mutant (Fig. 1). The spin-labeled RLC was exchanged onto HMM, and ATPase activity was measured as a function of RLC phosphorylation. Each sample was compared with a control HMM sample that was prepared on the same day and subjected to the same exchange process as the labeled mutants, except that WT RLC was used. None of the mutants showed a significant deviation from the control sample, which did not differ significantly from untreated HMM. In the unphosphorylated state, all samples showed very low activity, whereas phosphorylation produced substantial activation in all samples, giving at least 80% of the control activity (Fig. 1). These results are consistent with previous studies of the functional effects of point mutations in RLC; i.e., no single-residue RLC mutation, in the N-terminal segment or elsewhere, has been shown to impair the regulation of actin-activated ATPase activity (7–9), although some point mutations have been shown to change other properties of smooth muscle RLC (8). We conclude that neither the mutation nor the spin label had a significant affect on the function of any of these samples. Therefore, the EPR results below correspond to functionally normal protein.
Fig. 1.

Actin-activated ATPase of spin–labeled HMM. The value for each sample was normalized to a same-day control sample of phosphorylated HMM. The mean values for the control were 217 ± 7 units (phosphorylated) and 2.5 ± 1 units (unphosphorylated).
Rotational Dynamics. Sites throughout RLC were surveyed to determine the most sensitive regions to phosphorylation. As discussed in the Introduction, there are four regions of RLC that have been shown to be important in regulation: the phosphorylation domain (PD, residues 1–24), the N-terminal lobe (residues 25–88), the linker helix (residues 89–100), and the C-terminal lobe (residues 101–171). The labeling sites chosen from these regions were T10C and R16C (PD); M60C and M72C (N-terminal lobe); P98C (linker helix); and C108, M129C, and G165C (C-terminal lobe).
EPR spectra for these sites on HMM, in the presence and absence of phosphorylation, are shown in Fig. 2. The two sites in the N-terminal phosphorylated region showed a distinct narrowing of the spectrum with phosphorylation (Fig. 2, top row), indicating increased nanosecond dynamics. However, at all sites in other RLC regions, the spectra showed no significant change upon phosphorylation. Therefore, in subsequent experiments, we focused on the N-terminal PD.
Fig. 2.

EPR spectra of selected RLC sites. 3-(5-Fluoro-2,4-dinitroanilino)-PROXYL attached to the indicated site on single-Cys mutant RLC, bound functionally to HMM. Black lines indicate unphosphorylated, and red lines indicate phosphorylated. NL, N-terminal lobe; LH, linker helix; CL, C-terminal lobe. The splitting 2TII′, used to calculate the order parameter S and cone angle θc (Eq. 1), is illustrated for M129C.
We prepared single-Cys mutants for each of the first 24 RLC residues, excluding the two phosphorylation sites (T18 and S19), and performed EPR experiments on the spin-labeled, reconstituted HMM samples. Fig. 3 Left shows the amplitude of rotational dynamics θc measured from these spectra as indicated by Eq. 1. All but two of the first 17 residues showed a significant increase in θc (decrease in order parameter S) upon phosphorylation. The nearly uniform increase of 4–8° in θc in these first 17 residues suggests that phosphorylation induces global rotational motion of this entire region. Smaller effects were observed in residues 20–24. Remarkably, no significant effects were detected in any of the six residues probed in the remainder of RLC (Fig. 3 Right). We conclude that the N-terminal segment of RLC, including at least the first 17 aa, really is a distinct domain (PD) that is characterized by its increased dynamics upon phosphorylation.
Fig. 3.

Rotational dynamics of RLC sites. The amplitude of motion θc was calculated from the EPR spectrum (e.g., Fig. 2) by using Eq. 1. Error bars indicate SEM (n = 4 in most cases).
Solvent Accessibility Changes Upon Phosphorylation. Only slight variation in the order parameter was observed from site to site in the PD (Fig. 3), providing little information about secondary structure. This finding is probably caused by the tendency of the hydrophobic 3-(5-fluoro-2,4-dinitroanilino)-PROXYL to bind rigidly to the protein framework, making its dynamics relatively insensitive to secondary structure or changes in tertiary contacts, as documented in previous EPR studies of RLC (20, 30). Therefore, to obtain more structural information, solvent accessibility was measured at each site in the PD and at C108, using oxygen as the paramagnetic relaxant. Fig. 4 illustrates the experiment done with the spin label at C108. Upon phosphorylation, the solvent accessibility around C108 more than doubled, indicating a more exposed environment.
Fig. 4.

O2 accessibility at C108, measured by EPR saturation, before (U) and after (P) RLC phosphorylation. Normalized signal intensity (A/[I*P1/2]) (Eq. 2), plotted as a function of microwave power (P). Curves show best-fits to Eq. 2, giving P1/2 values (x axis intercepts) of 27.1 ± 2.2 (N2, U, and P), 71.6 ± 5.7 (O2 and U), and 110.4 ± 8.8 (O2 and P). Accessibility, proportional to ΔP1/2 (Eq. 3), is greater after phosphorylation, as indicated.
Phosphorylation increases accessibility for almost all sites in the PD (Fig. 5). Thus phosphorylation induces a global increase in dynamics and solvent exposure for the entire PD. The pattern of this plot, which reveals details about the secondary structure of this domain, is quite similar in the presence and absence of phosphorylation for the first five residues, but the phosphorylated sample shows a much more pronounced periodicity in the remainder of the structure.
Fig. 5.

Solvent accessibility (ΔP1/2′, Eq. 3) in PD, measured as illustrated in Fig. 4. Error bars indicate SEM (n = 4 in most cases).
Fourier analysis (Fig. 6A) confirms quantitatively the increased periodicity after phosphorylation, with a period of ≈100° per residue, corresponding to an α-helix (3.6 residues per 360° turn). Fig. 6B shows that this α-helical periodicity is substantially greater after phosphorylation over most of the first 17 residues. Each point represents the center of a nine-residue window, as defined in Eq.5. ensuring that only long-range helical order (at least two turns) is scored significantly. For example, the point at residue 5 is the center of the window for residues 1–9. We conclude that phosphorylation increases dynamics, solvent accessibility, and helical order throughout the PD.
Fig. 6.

Helical periodicity in PD. (A) Power spectrum (Eq. 4, using a window of l = 9 residues) of accessibility data (Fig. 5). (B) α-Helical periodicity index (Eq. 5), calculated at the center of the nine-residue window, indicating that phosphorylation increases periodicity from residue 3 to residue 17.
Experiments on S1. EPR experiments were performed on S1 (single-headed) to determine whether the effects in the PD observed in HMM (double-headed) were caused by head–head interactions. The probe was placed at residue 6, which is representative of the PD (Figs. 3 and 5), showing an increase in dynamics (decreased order parameter) and accessibility (increased ΔP′1/2) upon phosphorylation of HMM (Table 1). In S1 the effects of phosphorylation are in the opposite direction: in the unphosphorylated state, both dynamics and accessibility are much greater for S1 than for HMM, and phosphorylation eliminates most of these differences between HMM and S1 (Table 1). As discussed below (Fig. 7), these results support a model in which head–head interactions are strong in unphosphorylated HMM and are reduced by phosphorylation.
Table 1. EPR experiments on HMM and S1 (label at residue 6).
| HMM, U | HMM, P | S1, U | S1, P | |
|---|---|---|---|---|
| Dynamics, θc | 31.5 ± 0.8 | 36.1 ± 0.7 | 45.2 ± 1.0 | 38.3 ± 0.8 |
Accessibility, 
|
2.7 ± 0.2 | 8.7 ± 0.6 | 13.6 ± 0.7 | 10.5 ± 0.6 |
U, unphosphorylated; P, phosphorylated; θc, amplitude (half-cone angle) of ns dynamics in degrees (Eq. 1).  (arbitrary units) is from Eq. 3. Data are means ± SEM (n = 4).
Fig. 7.

Structural model based on EPR data. Only the RLC is shown, with the PD (residues 1–24) in black. Text and small arrows indicate changes, in the direction of the large arrows. (Upper) In HMM, phosphorylation of RLC Ser-19 increases the helical order of PD (Figs. 5 and 6), which decreases head–head interactions, resulting in increased dynamics (Fig. 3) and accessibility (Fig. 5) of the PD. (Lower) Opposite phosphorylation effects in S1 on both dynamics and accessibility (Table 1) support this model.
Discussion
Structure of the N Terminus of RLC. Site-directed spin labeling has revealed that the N-terminal 24 aa of RLC in smooth muscle myosin act as a distinct domain, which we designate the PD. The structure of this region has been studied amino acid by amino acid, and secondary structural elements have been assigned, based on the EPR data on dynamics (Fig. 3) and accessibility (Figs. 5 and 6). This finding is significant because no crystal structure data have been obtained from this RLC domain for any myosin isoform. In the case of chicken skeletal S1 (31), this lack of structural information may be caused by either proteolysis or disorder; in the case of the scallop regulatory domain (32, 33), it is caused by proteolysis. In contrast, our HMM samples have regulatory domains that are intact and fully functional (Fig. 1), and EPR is capable of resolving structure even in the presence of disorder.
Phosphorylation-Induced Structural Changes in RLC. The present study provides direct insight into structural changes in RLC caused by phosphorylation, especially in the PD. Dynamics (Figs. 2 and 3) shows that phosphorylation increases the amplitude of nanosecond rotational motions throughout the PD, whereas no significant changes were observed in six sites distributed throughout the other domains of RLC. We conclude that the PD is a distinct domain that is uniquely sensitive to structural perturbation by phosphorylation. Oxygen accessibility provides significantly more detail about the structural changes occurring upon phosphorylation of RLC. First, most of the sites in the PD showed a 2- to 3-fold increase in accessibility upon phosphorylation (Fig. 5), as did C108, in the C-terminal lobe (Fig. 4). These results indicate that RLC is in a more solvent-accessible environment after phosphorylation. Second, accessibility exhibited clear sequence dependence in the PD after phosphorylation, implying increased helical order in residues 1–17 (Fig. 6).
EPR Spectroscopy Is a Powerful Tool for Structural Analysis. EPR has a distinct advantage over other structural techniques. Measurements can be made in solution under native conditions where distinct structural states can be resolved and quantitated, accurately reflecting their equilibrium or steady-state populations, even if some of those states are partially disordered. Indeed, as the present study illustrates, changes in dynamics and disorder may be keys to understanding function. Most other techniques, such as crosslinking, crystallography, electron microscopy, or NMR, have a tendency to be biased toward particular states that are easily trapped or highly ordered. A potential limitation of EPR is that the probe can itself perturb structure. Fortunately, all of the spin-labeled mutants in this study showed excellent functional activity (Fig. 1), indicating that their structural perturbations are insignificant.
We found that solvent accessibility (Fig. 6) is more sensitive than dynamics (Fig. 3) to phosphorylation-induced structural change. This finding is probably caused in part by our choice of 3-(5-fluoro-2,4-dinitroanilino)-PROXYL, which was necessary because of its unusual stability in the presence of DTT. This probe tends to bind more rigidly to the protein backbone than does the standard 1-oxyl-2,2,5,5-tetramethylpyrroline-3-methyl) methanethiosulfonate spin label, so its mobility is less sensitive to secondary and tertiary interactions, as shown previously in EPR experiments on a series of spin-labeled RLC mutants in muscle (20, 30). Because dynamics did not show much variation along the sequence of the PD and remained moderately restricted in HMM even after phosphorylation (Fig. 3), we conclude that (i) the observed increase in dynamics upon phosphorylation probably reflects global segmental motions of the entire PD, and (ii) the observed changes in dynamics and solvent accessibility can be attributed to RLC tertiary and quaternary interactions, not to probe flexibility.
Implications for the Molecular Mechanism of Smooth Muscle Regulation. Most models assume that inhibition is caused by head–head interactions that are released by phosphorylation (2–4, 34). Our EPR results support this type of model and add considerable structural detail (Fig. 7). In the unphosphorylated state of HMM (Fig. 7 Upper Left), the PD lacks long-range secondary structure (Fig. 6), but the highly restricted dynamics (Fig. 3) indicate that this disorder is static, not dynamic. It has been proposed that PDs tend to contain disordered regions, because this is favorable for kinase binding, and it establishes the potential for a disorder-to-order transition that accompanies regulation (35). The observed increase in helical order in the PD upon phosphorylation (Fig. 6) is consistent with this proposal, but the concomitant global increase in PD dynamics (Fig. 3) and accessibility (Figs. 4 and 5) seems, at first glance, to contradict the increased order. However, this is easily explained by the hypothesis that phosphorylation not only induces secondary structural order in the PD, but also decreases head–head interactions that involve the PD. As depicted in Fig. 7 Upper Right, this model could allow the PD to undergo limited segmental motion with respect to the RLC, increasing both dynamics and accessibility, as we observe.
The conclusion that the two heads of HMM move apart upon phosphorylation is supported by the experiments on S1 (Table 1 and results illustrated in Fig. 7), indicating that both the dynamics and accessibility of a probe at position 6 in the PD of phosphorylated S1 are similar to (slightly greater than) those of phosphorylated HMM and are substantially greater than for unphosphorylated HMM. The result is that phosphorylation has effects on dynamics and accessibility that are opposite to those of HMM. These results are hard to explain without invoking head–head interactions in HMM, as illustrated in Fig. 7.
If phosphorylation moves the heads apart, we must consider the possibility that the apparent change in secondary structure (Fig. 7), revealed by the changes in accessibility (Figs. 5 and 6), is caused instead by head–head interactions that prevent accessibility in unphosphorylated HMM. However, EPR studies have shown that oxygen accessibility reveals helical secondary structure even in buried sites of protein–protein interactions (36). In addition, phosphorylation decreases both dynamics and accessibility in S1 (Table 1), which is consistent with the proposed increase in structural order within the PD (Fig. 7). We conclude that phosphorylation induces an increase in helical structural order within the PD, resulting in disruption of head–head interactions in HMM. Although these head–head interactions are depicted as being between the two RLCs (Fig. 7), we cannot rule out the possibility that the RLC interacts with another part of the head (e.g., catalytic domain or ELC), or even with S2. We also cannot rule out the possibility that these interactions depend on nucleotide as well as RLC phosphorilation.
Relationship to Proposed Models. In a recent study (10), computer modeling predicted, in agreement with our data (Fig. 5), that the PD begins with a short helical stretch that leads to a disordered region containing the phosphorylation site, and crosslinking data indicated that the two regulatory domains are in direct contact in the inhibited state, but that they move apart upon phosphorylation, as proposed here (Fig. 7). These effects may be more extensive in the presence of nucleotide (37). EM results from HMM on lipid monolayers, in both the unphosphorylated and phosphorylated states, have been used to propose a different model for regulation (11, 12), in which the inhibitory head–head interactions involve primarily the catalytic domains. In this model, the actin-binding region of one unphosphorylated head interacts with the converter region of the other, and phosphorylation disrupts these interactions. To obtain a definitive test of this EM-based model, it would be necessary to place probes at the proposed sites of interaction on the catalytic domain.
Conclusions and Prospects. We have used site-directed spin labeling and EPR to provide a level of detailed structural information for the N-terminal PD of smooth muscle myosin RLC, characterizing backbone dynamics and solvent accessibility, and assigning secondary structural elements. Phosphorylation reveals that the PD acts as a coherent domain, as dynamics increase exclusively and uniformly within this domain, accompanied by a global increase in solvent accessibility and helical secondary structural order within the PD. These data support a model in which inhibitory head–head interactions are stabilized by a statically disordered structure within the PD, and phosphorylation induces a disorder-to-order transition within the PD that stabilizes the internal structure of RLC, decreases its inhibitory protein–protein interactions, and activates the actomyosin complex. In the future, this model should be tested by measuring changes in the distance between pairs of probes on different heads (38).
Acknowledgments
We thank Dr. Christine Cremo (University of Nevada, Reno) for advice, insightful discussions, and encouragement. This work was supported by National Institutes of Health Grant AR32961 and the Muscular Dystrophy Association (to D.D.T.) and National Institutes of Health Grant AR48961 and a Minnesota Supercomputing Institute grant (to Y.E.N.). W.D.N. was supported by National Institutes of Health Predoctoral Training Grant AR07612.
This paper was submitted directly (Track II) to the PNAS office.
Abbreviations: RLC, regulatory light chain; HMM, heavy meromyosin; PD, phosphorylation domain.
References
- 1.Ikebe, M. & Morita, J. (1991) J. Biol. Chem. 266, 21339–21342. [PubMed] [Google Scholar]
- 2.Matsuura, M. & Ikebe, M. (1995) FEBS Lett. 363, 246–250. [DOI] [PubMed] [Google Scholar]
- 3.Cremo, C. R., Sellers, J. R. & Facemyer, K. C. (1995) J. Biol. Chem. 270, 2171–2175. [DOI] [PubMed] [Google Scholar]
- 4.Trybus, K. M., Freyzon, Y., Faust, L. Z. & Sweeney, H. L. (1997) Proc. Natl. Acad. Sci. USA 94, 48–52. [DOI] [PMC free article] [PubMed] [Google Scholar]
- 5.Trybus, K. M. & Chatman, T. A. (1993) J. Biol. Chem. 268, 4412–4419. [PubMed] [Google Scholar]
- 6.Ikebe, M., Kambara, T., Stafford, W. F., Sata, M., Katayama, E. & Ikebe, R. (1998) J. Biol. Chem. 273, 17702–17707. [DOI] [PubMed] [Google Scholar]
- 7.Ikebe, M., Ikebe, R., Kamisoyama, H., Reardon, S., Schwonek, J. P., Sanders, C. R., 2nd, & Matsuura, M. (1994) J. Biol. Chem. 269, 28173–28180. [PubMed] [Google Scholar]
- 8.Sweeney, H. L., Yang, Z., Zhi, G., Stull, J. T. & Trybus, K. M. (1994) Proc. Natl. Acad. Sci. USA 91, 1490–1494. [DOI] [PMC free article] [PubMed] [Google Scholar]
- 9.Wu, X., Clack, B. A., Zhi, G., Stull, J. T. & Cremo, C. R. (1999) J. Biol. Chem. 274, 20328–20335. [DOI] [PubMed] [Google Scholar]
- 10.Wahlstrom, J. L., Randall, M. A., Jr., Lawson, J. D., Lyons, D. E., Siems, W. F., Crouch, G. J., Barr, R., Facemyer, K. C. & Cremo, C. R. (2003) J. Biol. Chem. 278, 5123–5131. [DOI] [PubMed] [Google Scholar]
- 11.Wendt, T., Taylor, D., Messier, T., Trybus, K. M. & Taylor, K. A. (1999) J. Cell Biol. 147, 1385–1390. [DOI] [PMC free article] [PubMed] [Google Scholar]
- 12.Wendt, T., Taylor, D., Trybus, K. M. & Taylor, K. (2001) Proc. Natl. Acad. Sci. USA 98, 4361–4366. [DOI] [PMC free article] [PubMed] [Google Scholar]
- 13.Hubbell, W. L., McHaourab, H. S., Altenbach, C. & Lietzow, M. A. (1996) Structure (London) 4, 779–783. [DOI] [PubMed] [Google Scholar]
- 14.Hubbell, W. L., Gross, A., Langen, R. & Lietzow, M. A. (1998) Curr. Opin. Struct. Biol. 8, 649–656. [DOI] [PubMed] [Google Scholar]
- 15.Ikebe, M. & Hartshorne, D. J. (1985) J. Biol. Chem. 260, 13146–13153. [PubMed] [Google Scholar]
- 16.Wagner, P. D. (1982) Methods Enzymol. 85, 72–81. [DOI] [PubMed] [Google Scholar]
- 17.Adelstein, R. S. & Klee, C. B. (1982) Methods Enzymol. 85, 298–308. [DOI] [PubMed] [Google Scholar]
- 18.Ikebe, M. & Hartshorne, D. J. (1985) Biochemistry 24, 2380–2387. [DOI] [PubMed] [Google Scholar]
- 19.Wu, G., Wong, A., Qian, F. & Lu, R. C. (1998) Biochemistry 37, 7676–7685. [DOI] [PubMed] [Google Scholar]
- 20.Baker, J. E., Brust-Mascher, I., Ramachandran, S., LaConte, L. E. & Thomas, D. D. (1998) Proc. Natl. Acad. Sci. USA 95, 2944–2949. [DOI] [PMC free article] [PubMed] [Google Scholar]
- 21.Facemyer, K. C. & Cremo, C. R. (1992) Bioconjugate Chem. 3, 408–413. [DOI] [PubMed] [Google Scholar]
- 22.Lanzetta, P. A., Alvarez, L. J., Reinach, P. S. & Candia, O. A. (1979) Anal. Biochem. 100, 95–97. [DOI] [PubMed] [Google Scholar]
- 23.Nesmelov, Y. E., Gopinath, A. & Thomas, D. D. (2004) J. Magn. Reson. 167, 138–146. [DOI] [PMC free article] [PubMed] [Google Scholar]
- 24.Bergman, D. J. & Dunn, K. (1992) Phys. Rev. B 45, 13262–13271. [DOI] [PubMed] [Google Scholar]
- 25.Altenbach, C., Greenhalgh, D. A., Khorana, H. G. & Hubbell, W. L. (1994) Proc. Natl. Acad. Sci. USA 91, 1667–1671. [DOI] [PMC free article] [PubMed] [Google Scholar]
- 26.Pali, T. & Marsh, D. (2002) Cell Mol. Biol. Lett. 7, 87–91. [PubMed] [Google Scholar]
- 27.Farahbakhsh, Z. T., Altenbach, C. & Hubbell, W. L. (1992) Photochem. Photobiol. 56, 1019–1033. [DOI] [PubMed] [Google Scholar]
- 28.Eisenberg, D., Weiss, R. M. & Terwilliger, T. C. (1984) Proc. Natl. Acad. Sci. USA 81, 140–144. [DOI] [PMC free article] [PubMed] [Google Scholar]
- 29.Cornette, J. L., Cease, K. B., Margalit, H., Spouge, J. L., Berzofsky, J. A. & DeLisi, C. (1987) J. Mol. Biol. 195, 659–685. [DOI] [PubMed] [Google Scholar]
- 30.LaConte, L. E., Voelz, V., Nelson, W., Enz, M. & Thomas, D. D. (2002) Biophys. J. 83, 1854–1866. [DOI] [PMC free article] [PubMed] [Google Scholar]
- 31.Rayment, I., Rypniewski, W. R., Schmidt-Base, K., Smith, R., Tomchick, D. R., Benning, M. M., Winkelmann, D. A., Wesenberg, G. & Holden, H. M. (1993) Science 261, 50–58. [DOI] [PubMed] [Google Scholar]
- 32.Xie, X., Harrison, D. H., Schlichting, I., Sweet, R. M., Kalabokis, V. N., Szent-Gyorgyi, A. G. & Cohen, C. (1994) Nature 368, 306–312. [DOI] [PubMed] [Google Scholar]
- 33.Houdusse, A. & Cohen, C. (1996) Structure (London) 4, 21–32. [DOI] [PubMed] [Google Scholar]
- 34.Trybus, K. M. & Lowey, S. (1984) J. Biol. Chem. 259, 8564–8571. [PubMed] [Google Scholar]
- 35.Dunker, A. K., Brown, C. J., Lawson, J. D., Iakoucheva, L. M. & Obradovic, Z. (2002) Biochemistry 41, 6573–6582. [DOI] [PubMed] [Google Scholar]
- 36.Qin, Z., Wertz, S. L., Jacob, J., Savino, Y. & Cafiso, D. S. (1996) Biochemistry 35, 13272–13276. [DOI] [PubMed] [Google Scholar]
- 37.Mazharl, S., Selser, C. T. & Cremo, C. R. (2004) J. Biol. Chem. 279, 39905–39914. [DOI] [PubMed] [Google Scholar]
- 38.Lidke, D. S. & Thomas, D. D. (2002) Proc. Natl. Acad. Sci. USA 99, 14801–14806. [DOI] [PMC free article] [PubMed] [Google Scholar]