Abstract
Cleft palate is among the most common congenital disorders, and can be induced by exposure to all-trans retinoic acid (atRA) during mice and human embryogenesis. However, the mechanism underlying the implication of atRA in the development of cleft palate has yet to be elucidated. In the present study, atRA administered by gavage resulted in formation of a cleft palate in 99% of treated C57BL/6 mice. Notch2 was revealed to be upregulated in mouse embryonic palate mesenchymal (MEPM) cells in the atRA-treated group compared with untreated control mice between embryonic day (E)12.5 and E14.5. In addition, atRA was demonstrated to mediate Notch2 expression via the activation of RA receptors (RARs). Since Notch2 activation has previously been reported to inhibit the proliferation of MEPM cells, the expression levels of extracellular signal-regulated kinase (ERK), p21, cyclin D1 and Ki-67 were assessed in samples from atRA-treated and control mouse embryos between E12.5 and E14.5. It was demonstrated that Notch2 silencing partially reversed the atRA-induced inhibition of ERK phosphorylation in MEPM cells. In addition, the atRA-induced cyclin D1 downregulation and p21 upregulation were partially reversed following Notch2 silencing, whereas the atRA-induced inhibition of cellular proliferation was also attenuated. Furthermore, it was revealed that Notch2 expression was upregulated, whereas Ki-67 expression was downregulated following atRA exposure, as assessed using resin bead-released atRA in MEPM cells. The present findings suggested that during embryonic development, atRA may enhance the expression of Notch2, which may inhibit cellular proliferation, possibly through ERK signaling.
Keywords: all-trans retinoic acid, Notch2, embryonic palate mesenchymal cells, cell proliferation, phosphorylated-ERK
Introduction
Cleft palate is one of the most common congenital craniofacial disorders (1,2). The palate consists of two parts, the primary and the secondary palate. Secondary palatal development involves several steps: First, the two palatal shelves grow vertically, and then reorient to a horizontal position above the tongue. Subsequently, the opposite palatal shelves come into contact and fuse (3). Vertical growth and elevation are important during palatal development. When palatal shelf growth and elevation fail to occur, a cleft palate forms.
Retinoic acid (RA), which is the active metabolite of vitamin A, is essential for numerous biological processes and serves a critical role in vertebrate morphogenesis (4). Conversely, exogenous RA is a potent teratogen during embryonic development. According to the stage, i.e. early or late, of palatogenesis, excess RA administration can induce cleft palate of varying degrees. Exposure of pregnant mice to RA on embryonic day (E)10 has been reported to result in small palatal shelves that fail to elevate, whereas RA exposure on E12 has been demonstrated to lead to normal-sized palatal shelves that can form contacts but are incapable of fusion (5,6).
Notch signaling is an evolutionarily conserved signaling pathway in mammals that serves important roles in the regulation of cellular survival and apoptosis (7,8). Notch signaling is activated when the Notch receptor (Notch1-4) is bound by a ligand, such as Jagged1 and 2 or Delta-like-1, −3 and −4, which is expressed on the surface of an adjacent cell. The functions of Notch2 and Notch3 have been studied extensively in vascular smooth muscle cells; however, the complex roles of Notch2 in vascular smooth muscle cell proliferation have yet to be elucidated. A previous study identified the differential regulation of the unique functions of Notch2 and Notch3 during vascular smooth muscle cell proliferation (9). In addition, it has previously been reported that Notch2 may inhibit vascular smooth muscle cell proliferation through the regulation of the cyclin-dependent kinase inhibitor p27kip1 (10). The relationship between Notch and RA has also been investigated. RA treatment was demonstrated to induce cell cycle arrest at G1 phase in glioblastoma stem cells, via downregulating cyclin D1 and upregulating p27 expression (11). Jagged2-Notch1 signaling has been implicated in physiological palatogenesis during embryonic development (12). However, the role of Notch2 following RA exposure during palatal development has yet to be elucidated. The aim of the present study was therefore to investigate the role of Notch signaling in RA-induced mouse embryonic palate mesenchymal (MEPM) cell proliferation inhibition.
Materials and methods
Antibodies
Anti-Notch1 (ab52627), anti-p21 (ab109199), anti-cyclin D1 (ab134175) and anti-Ki-67 (ab15580) antibodies were purchased from Abcam (Cambridge, UK). Anti-Notch2 (5732p), anti-extracellular signal regulated kinase (ERK) (9102s) anti-phosphorylated (p)-ERK (9101s) and anti-GAPDH (2118s) antibodies were purchased from Cell Signaling Technology, Inc. (Danvers, MA, USA). Anti-Notch3 (AF1308-SP) antibody was purchased from R&D Systems, Inc. (Minneapolis, MN, USA).
Mice
All animals used were purchased from Sun Yat-sen University (Guangzhou, China). Female C57BL/6 mice (age, 10–12 weeks; weight, 25–30 g) were mated with mature males (age, 7–8 weeks; weight, 18–25 g) between 8 and 10 pm, and the detection of the vaginal plug was designated E0. A total of 30 mice were used in each control and treatment group. Female mice on E10 were administered all-trans (at)RA (100 mg/kg; Sigma-Aldrich; Merck KGaA, Darmstadt, Germany) dissolved in corn oil by oral gavage. Female mice in the control group were administered the same volume of corn oil. atRA-treated and untreated pregnant mice were sacrificed via cervical dislocation on E12.5, 13.5, 14.5 and 16.5. All animal studies were approved by the Ethics Committee for Animal Experiments of Sun Yat-sen University (approval no IACUC: DB-15-0302; Guangzhou, China).
Histological staining
Embryos dissected from atRA-treated and control mice on E12.5, 13.5, 14.5 and 16.5 were fixed in 4% paraformaldehyde for 24 h at room temperature and embedded in paraffin. For immunohistochemistry and hematoxylin-eosin (H&E) staining, deparaffinized sections (4 µm) were processed using standard procedures. Briefly, sections were deparaffinized and hydrated stepwise, heated in a microwave for 20 min for antigen retrieval, and blocked with goat serum (Wuhan Boster Biological Technology, Ltd., Wuhan, China) following nonspecific peroxidase blocking in 3% hydrogen peroxide solution. Sections were incubated with primary antibodies (Notch1, 1:500; Notch2, 1:250; Notch3, 1:250; Ki67, 1:500) diluted in 5% bovine serum albumin (BSA; Wuhan Boster Biological Technology, Ltd.) at 4°C overnight, and then with the secondary antibody (1:200; cat. no. 7074s; Cell Signaling Technology, Inc.) diluted in 1% BSA at 37°C for 30 min. Sections were subsequently stained with 3,3′-diaminobenzidine (DAB) and hematoxylin. Following gradual dehydration, sections were sealed with neutral gum. For H&E staining, sections were deparaffinized and hydrated stepwise, immersed in haematoxylin, washed in differentiation liquid, and then immersed in eosin. Following gradual dehydration, sections were sealed with neutral gum. IHC-positive mesenchymal cells were counted in a fixed area near the tip of the palatal shelf. The ratio of IHC-positive cells to the total cells was calculated and processed. Images were captured using an Axio Imager 2 light microscope (Carl Zeiss, Oberkochen, Germany). A fixed area near the tip of the palatal shelf (20×20 µm) was selected for quantification using Image-Pro Plus 6.0 software (Media Cybernetics, Inc., Rockville, MD, USA). Briefly, in the fixed areas, positive immunostaining for Notch2 was selected, and the integrated optical density (OD) was measured. The % of relative OD units compared with control was calculated as described previously (13).
Collection of palatal shelves and isolation of MEPM cells
Embryonic palatal shelves were isolated from atRA-treated or untreated pregnant female mice between E12.5 and E14.5. The epithelium was removed using tungsten needles following incubation in 1 U/ml dispase II (Roche Diagnostics, Indianapolis, IN, USA) at 37°C for 20 min. The palatal shelves were digested in 0.25% trypsin for 3 min and agitated to obtain a cell suspension. Suspended cells were collected for reverse transcription-quantitative polymerase chain reaction (RT-qPCR) or western blot analysis.
Cell culture and treatments
Primary MEPM cells were isolated from the palatal shelves of control untreated mice on E13.5 and cultured in Dulbecco's modified Eagle's medium (DMEM; Invitrogen; Thermo Fisher Scientific, Inc., Waltham, MA, USA), supplemented with 10% fetal bovine serum (FBS; Invitrogen; Thermo Fisher Scientific, Inc.). Cells were maintained at 37°C in a 5% CO2 atmosphere. The culture medium was replaced every 24 h. BMS493, an RA receptor (RAR) antagonist, was purchased from Sigma-Aldrich (Merck KGaA). MEPM cells were treated with 3 µM BMS493 or with 0, 1, 5 and 10 µM atRA, for 48 h at 37°C.
RNA interference
Notch2 small interfering (si)RNA and control siRNA were transfected into cultured MEPM cells using Lipofectamine® RNAiMAX Reagent in Opti-MEM reduced serum medium (Invitrogen; Thermo Fisher Scientific, Inc.) at 50 nM, according to the manufacturer's protocol. The control siRNA (Lot:0,0806) was purchased from Guangzhou RiboBio Co., Ltd. (Guangzhou, China). The Notch2 siRNA was chemically synthesized by Guangzhou RiboBio Co., Ltd., with the following sequence: CCA GTA CAG TGA AAT GTT T. A total of 24 h post-transfection, cells were treated with atRA (5 µM) in DMEM without FBS for 48 h at 37°C and collected for analysis.
Western blot analysis
Proteins of interest isolated from atRA-treated or control embryos and cultured MEPM cells were analyzed using western blot analysis, as previously described (14). Total protein was extracted from palatal shelves and MEPM cells using radioimmunoprecipitation assay lysis buffer (Thermo Fisher Scientific, Inc.) supplemented with protease and phosphatase inhibitors at 4°C for 30 min, and centrifuged at 15,000 × g at 4°C for 30 min. Protein content was determined by bicinchoninic acid assay. Equal amounts (30 µg) of extracted protein samples were separated by 10% SDS-PAGE and transferred onto nitrocellulose membranes (EMD Millipore, Billerica, MA, USA). The membranes were blocked with 5% evaporated skimmed milk at 37°C for 1 h and incubated with primary antibodies (Notch1, Notch2, Notch3, P21, cyclinD1, p-ERK, ERK, ki67, GAPDH; 1:1,000 dilution) in 5% evaporated skimmed milk at 4°C for 12 h, and horseradish peroxidase-conjugated secondary antibody (1:2,000 dilution; cat. no. 7074s; Cell Signaling Technology, Inc.) in 5% evaporated skimmed milk at 37°C for 1 h. Protein bands were visualized using an enhanced chemiluminescence kit (Cell Signaling Technology, Inc.) and the ImageQuant Las4000mini system (GE Healthcare Life Sciences, Chalfont, UK). GAPDH was used as an internal control. The signal intensities were quantified using ImageJ version 1.48u software (National Institutes of Health, Bethesda, MD, USA) (15).
RT-qPCR
Total RNA was extracted from MEPM cells using TRIzol® reagent (Invitrogen; Thermo Fisher Scientific, Inc.) according to the manufacturer's protocol. cDNA was reverse transcribed from 1 µg of total RNA using a Transcriptor First-Strand cDNA Synthesis kit (Roche Diagnostics, Burgess Hill, UK). qPCR was performed using the SYBR-Green I reaction mix (Roche Diagnostics), as per the manufacturer's instructions. The thermocycling conditions were as follows: 95°C for 5 min, then 40 cycles of 95°C for 10 sec, 60°C for 20 sec, and 72°C for 20 sec. qPCR reactions were performed in a Roche Light Cycler 480 system (Roche Diagnostics) The following primers were used: β-actin, forward 5′-TCAC-CCACACTGTGCCCATCTACGA-3′ and reverse 5′-GGATGCCACAGGATTCCATACCC-A-3′; RARα, forward 5′-TCAGTGCCATCTGCCTCAT-3′ and reverse 5′-CGTAGACTTT-CAGTGCTTCCAG-3′; RARβ, forward 5′-GTGCCATCTGTTTAATCTGTGG-3′ and reverse 5′-TGCTGGGTCGTCGTTTTC-3′; RARγ, forward 5′-ATACCCCAGAGCAG-GACACTA-3′ and reverse 5′-GGCAAAGGCAAAGACGAG-3′; Notch1, forward 5′-AACATGGGCCGTACTCCGTTA-3′ and reverse 5′-AGCCAGGATCAGTGGAGTTGTG-3′; Notch2, forward 5′-ACAAGTGAAGTGCAGGAGAGGGG-3′ and reverse 5′-CAGCGGC-AGGAATAGTGAGGAG-3′; and Notch3, forward 5′-CTCTGTGGTGATGCTGGAGATTGA-3′ and reverse 5′-TGCTGACAAGGCTCCCAGGTAG-3′. Target genes were normalized to β-actin, and relative fold changes in mRNA expression were calculated using the formula 2−ΔΔCq (16).
Proliferation assay
A Cell Counting Kit-8 (Wylton Chemistry Co., Ltd., Tongren, China) assay was used to assess cellular proliferation. Primary MEPM cells were seeded into a 96-well collagen-coated plate (1×10⁴ cells/well) and treated with control siRNA, control siRNA+atRA (5 µM), Notch2 siRNA and Notch2 siRNA+atRA (5 µM), prior to measuring proliferation as per the kit's instructions.
Bead implantation in palatal shelves
Palatal shelves of E13.5 mouse embryos were gently removed from the maxilla in cold PBS (Invitrogen; Thermo Fisher Scientific, Inc.). Dissected palatal shelves were placed on MF-Millipore™ membrane filters. Biggers, Gwatkin, and Judah (Fitton-Jackson modification) medium (BGJb; Invitrogen; Thermo Fisher Scientific, Inc.) was used for culture. Anion exchange resin beads (Dowex® 1×4, 100–200 mesh; Sigma-Aldrich; Merck KGaA) served as atRA carriers. Following incubation in 20–50 µM atRA at room temperature for 45 min, the beads were washed with BGJb medium for 15 min. Control beads were treated with vector alone. Beads were implanted into palate shelves using fiber probe under a stereomicroscope (Carl Zeiss AG). Samples were cultured for 48 h and then collected for immunohistochemical analysis.
Statistical analyses
The statistical significance of the difference between groups was assessed by Student's t-test and one-way analysis of variance, using SPSS 19.0 software (IBM SPSS, Armonk, NY, USA). Data was expressed as mean ± standard deviation. All experiments were repeated at least 3 times. P<0.05 was considered to indicate a statistically significant difference.
Results
atRA exposure on E10.0 induces cleft palate in mouse embryos
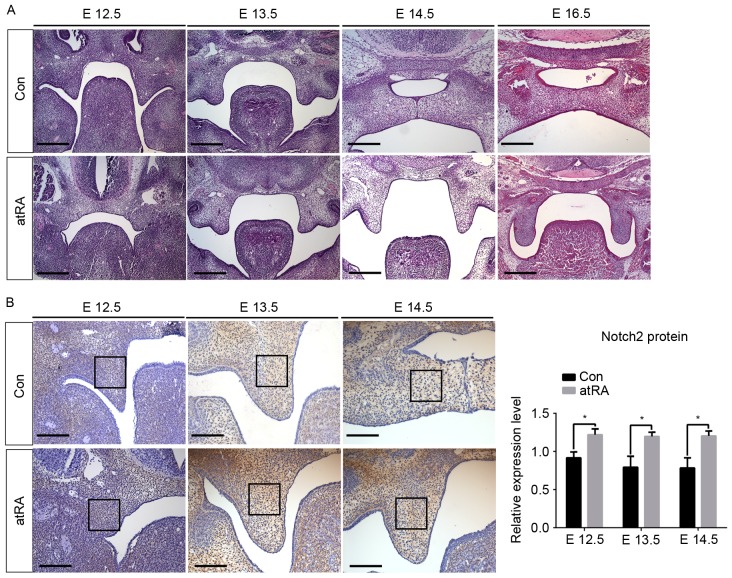
atRA exposure on E10.0 was demonstrated to induce cleft palate in 99% of the embryos (99/100), whereas no embryos exhibited cleft palate in the control group (0/100). H&E staining revealed the morphological changes of palatal shelves on E12.5, 13.4, 14.5 and 16.5 in atRA-treated embryos and controls (Fig. 1A). On E12.5, atRA-exposed embryos exhibited palatal shelves of smaller volume compared with controls, as determined by visual observation. On E13.5, palatal shelves grew vertically and no differences were apparent between atRA-treated and control embryos. On E14.5, palatal shelves elevated and contacted with the opposing palates in control embryos, whereas atRA-exposed embryos exhibited unelevated shelves. On E16.5, a firm palate formed and the medial edge epithelium disappeared in untreated embryos; however, in atRA-exposed embryos, palatal shelves failed to elevate and a cleft palate developed.
Figure 1.
atRA exposure on E10.0 induced cleft palate in mouse embryos. Immunohistochemistry revealed the expression of Notch2 in palatal tissue isolated from control and atRA-treated embryos. (A) Hematoxylin-eosin staining of palatal shelves isolated from atRA-exposed and control embryos on E12.5, 13.5, 14.5 and 16.5. Scale bars, 50 µm. (B) Notch2 expression in palatal shelves isolated from atRA-exposed and control E12.5–14.5 embryos (n=3/group). Scale bars, 20 µm. *P<0.05 vs. Con group. atRA, all-trans retinoic acid; E, embryonic day; Con, control.
Notch2 expression is upregulated in MEPM cells from atRA-treated embryos via RAR activation
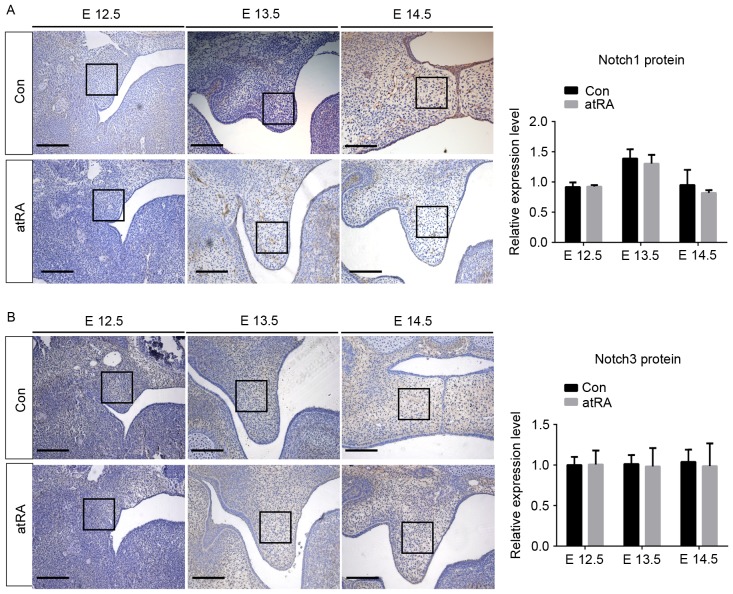
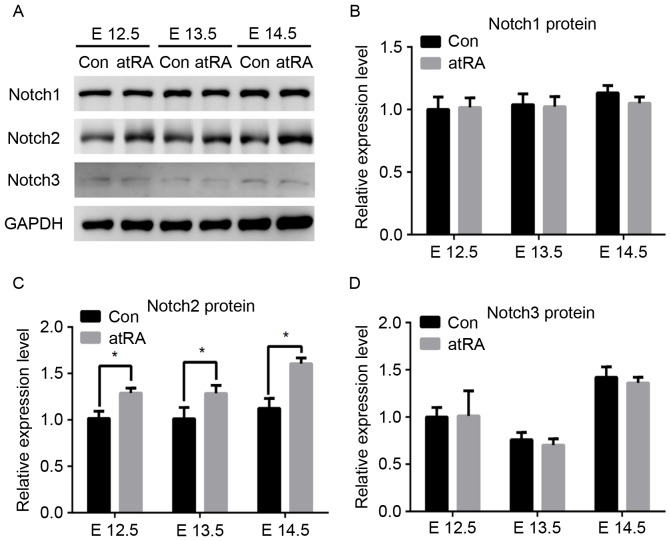
To identify atRA-induced Notch signaling events impairing palatogenesis, protein expression levels of Notch1, Notch2 and Notch3 were assessed in MEPM cells isolated from atRA-treated and untreated embryos between E12.5 and E14.5. Immunohistochemistry revealed that Notch2 expression was elevated in the atRA-treated embryos compared with in the controls (P<0.05; Fig. 1B). Notably, no significant differences were detected in the expression of Notch1 and Notch3 between atRA-exposed and control embryos (Fig. 2). Furthermore, Notch mRNA and protein expression levels were assessed using western blot analysis (Fig. 3) and RT-qPCR (Fig. 4). In accordance with the results of immunohistochemical analysis, Notch2 mRNA and protein expression levels were significantly upregulated in atRA-treated embryos compared with in the control group. Conversely, protein (Fig. 3B and D) and mRNA (Fig. 4A and C) expression levels of Notch1 and Notch3 were not significantly different between atRA-exposed embryos and controls.
Figure 2.
Immunohistochemistry revealed the expression of Notch1 and Notch3 in palatal tissue isolated from control and atRA-treated embryos between E12.5 and E14.5. (A) Notch1 expression in palatal shelves isolated from atRA-exposed and control E12.5–14.5 embryos. (B) Notch3 expression in palatal shelves isolated from atRA-exposed and control E12.5–14.5 embryos. Scale bars, 20 µm. atRA, all-trans retinoic acid; E, embryonic day; Con, control.
Figure 3.
Notch2 protein expression levels were upregulated in MEPM cells isolated from atRA-treated embryos. (A) Western blot analysis demonstrated the protein expression levels of Notch1, Notch2 and Notch3 in MEPM cells isolated from atRA-exposed and control E12.5–14.5 embryos. Semi-quantitative analysis of (B) Notch1, (C) Notch2 and (D) Notch3 relative expression levels (n=3/group). *P<0.05 vs. Con group. MEPM, mouse embryonic palate mesenchymal; atRA, all-trans retinoic acid; E, embryonic day; Con, control.
Figure 4.
Notch2 mRNA expression levels were upregulated in MEPM cells isolated from atRA-treated embryos. Relative mRNA expression levels of (A) Notch1, (B) Notch2 and (C) Notch3 (n=3/group). *P<0.05 vs. Con group. MEPM, mouse embryonic palate mesenchymal; atRA, all-trans retinoic acid; E, embryonic day; Con, control.
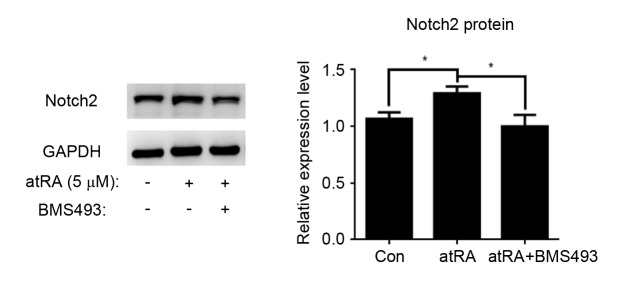
To investigate whether RAR activation was implicated in the atRA-induced Notch2 upregulation in MEPM cells, RAR mRNA expression levels were assessed in the presence of various atRA concentrations using RT-qPCR (Fig. 5). mRNA expression levels of RARβ and RARγ increased significantly following atRA treatment compared with untreated cells (P<0.05; Fig. 5), but no significant differences were observed in the mRNA expression levels of RARα. To further investigate whether the upregulation of Notch2 resulted from the direct action of atRA on RARs, the RAR antagonist BMS493 was applied to MEPM cells prior to atRA treatment. Notably, Notch2 expression was downregulated following pretreatment with BMS493 (P<0.05; Fig. 6).
Figure 5.
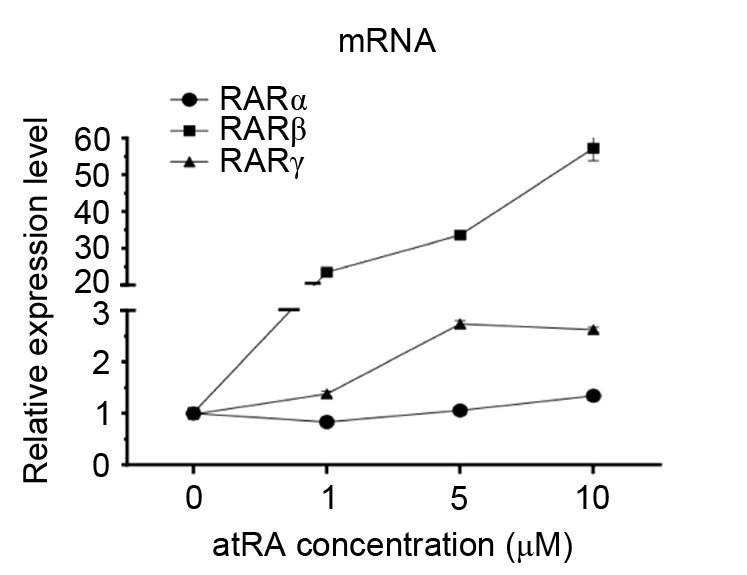
Alterations in RAR mRNA expression levels in the presence of various atRA concentrations in MEPM cells isolated from atRA-treated embryos. RAR, retinoic acid receptor; atRA, all-trans retinoic acid; MEPM, mouse embryonic palate mesenchymal; Con, control.
Figure 6.
Notch2 protein expression levels in atRA-treated MEPM cells in the presence or absence of the retinoic acid receptor inhibitor BMS493 (n=3/group). *P<0.05 vs. Con group. atRA, all-trans retinoic acid; MEPM, mouse embryonic palate mesenchymal; Con, control.
MEPM cellular proliferation is suppressed in atRA-treated embryos
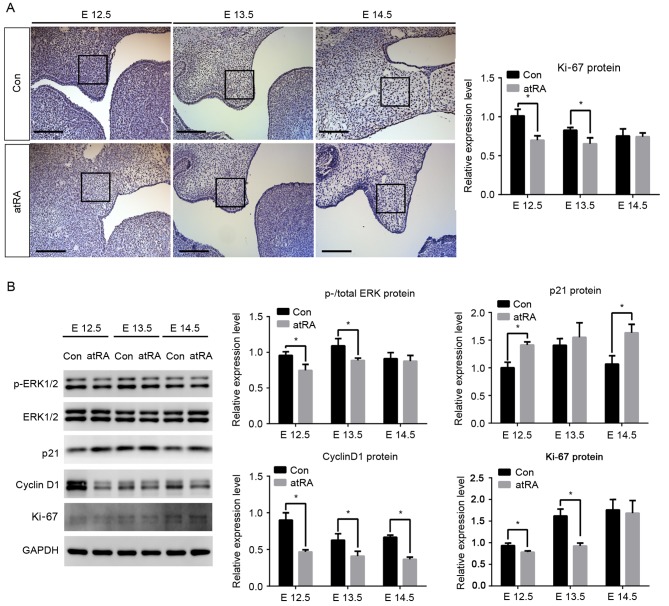
To examine the proliferation rate of MEPM cells in control and atRA-exposed embryos, the expression of Ki-67 was assessed in MEPM cells isolated from E12.5–14.5 embryos, using immunohistochemistry. There were fewer Ki-67-positive MEPM cells in atRA-treated embryonic tissue compared with in control tissue on E12.5 and 13.5 (P<0.05); however, no significant difference was observed on E14.5 (Fig. 7A). Western blot analysis demonstrated a downregulation in Ki-67 protein expression levels in MEPM cells in E12.5 and 13.5 atRA-exposed embryos compared with in age-matched controls (P<0.05; Fig. 7B).
Figure 7.
MEPM cellular proliferation rate was decreased in atRA-treated embryos. (A) Ki-67 expression in palatal shelves isolated from control and atRA-treated embryos between E12.5 and E14.5. Scale bars, 20 µm. (B) Protein expression levels of p-ERK, total ERK1/2, p21, cyclin D1 and Ki-67 in MEPM cells isolated from control and atRA-treated embryos (n=3/group). *P<0.05 vs. Con group. MEPM, mouse embryonic palate mesenchymal; atRA, all-trans retinoic acid; E, embryonic day; p, phosphorylated; ERK, extracellular signal-regulated kinase; Con, control.
To further investigate downstream Notch signaling events, total and p-ERK protein expression levels were assessed. p-ERK was significantly downregulated in E12.5 and 13.5 atRA-treated embryos compared with in the control group (P<0.05). Cell cycle-related proteins p21 and cyclin D1 were also analyzed. p21 protein expression levels were increased, whereas cyclin D1 levels were decreased in the atRA-treated group compared with in controls between E12.5 and E14.5 (P<0.05; Fig. 7B).
Notch2 silencing attenuates atRA-induced inhibition of MEPM cellular proliferation
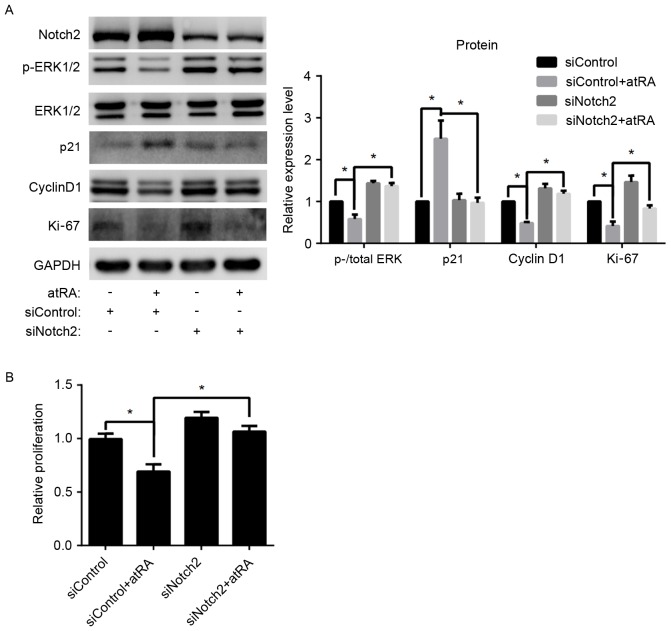
To investigate whether Notch2 may be involved in atRA-induced inhibition of MEPM cellular proliferation, Notch2 siRNA was used. atRA was demonstrated to decrease p-ERK protein expression levels; however, Notch2 knockdown attenuated the atRA-induced p-ERK downregulation (P<0.05; Fig. 8A). As a potential signaling pathway downstream of ERK, p21 expression levels were decreased in the Notch2 knockdown group compared with in the control group (P<0.05; Fig. 8A). Conversely, cyclin D1 protein levels increased in MEPM cells not expressing Notch2 compared with in control cells (P<0.05; Fig. 8A).
Figure 8.
Notch2 silencing attenuated the atRA-induced inhibition of MEPM cellular proliferation. (A) Notch2 knockdown appeared to increase p-ERK expression and partially attenuated the atRA-induced p-ERK downregulation in MEPM cells. Notch2 silencing also downregulated p21 and upregulated cyclin D1 expression (n=3/group). (B) Notch2 knockdown attenuated the atRA-induced inhibition of MEPM cellular proliferation (n=3/group). *P<0.05. atRA, all-trans retinoic acid; MEPM, mouse embryonic palate mesenchymal; p, phosphorylated; ERK, extracellular signal-regulated kinase; si, small interfering.
In the absence of Notch2, MEPM cells treated with atRA exhibited increased proliferation compared with control cells (P<0.05; Fig. 8B). Notch2 knockdown was demonstrated to partially attenuate the atRA-induced inhibition of MEPM cellular proliferation. Western blot analysis of Ki-67 protein expression levels also supported these results (P<0.05; Fig. 8A).
Stimulation of Notch2 expression in palatal shelves by atRA
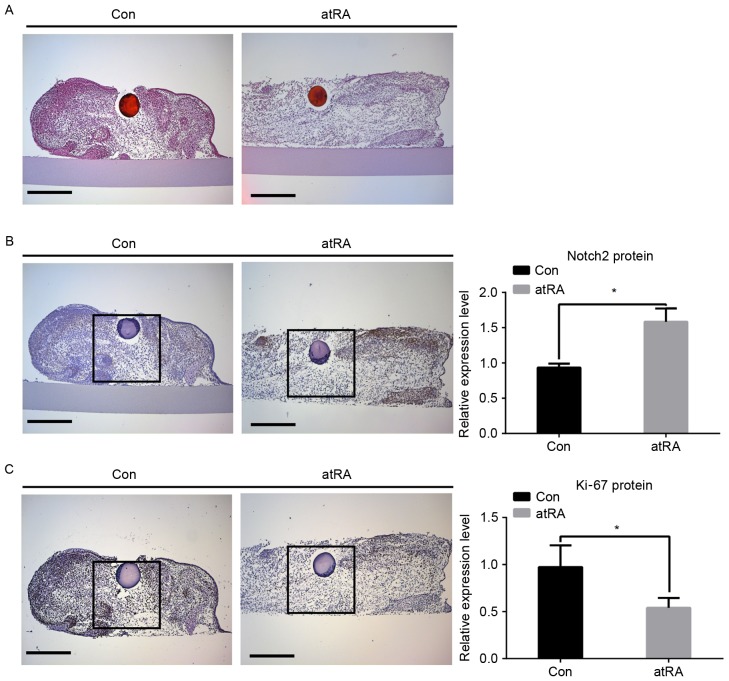
Palatal shelves isolated from E13.5 embryos were cultured for 48 h with implanted beads soaked in atRA or control vector (Fig. 9A). Notch2 protein expression was assessed using immunohistochemistry. Notch2 expression appeared to be upregulated in MEPM cells surrounding the atRA-releasing bead compared with in control cells (P<0.05; Fig. 9B). Conversely, Ki-67 expression appeared to be decreased in atRA-exposed palatal shelves compared with in controls (P<0.05; Fig. 9C).
Figure 9.
atRA stimulated the expression of Notch2 in palatal shelves. (A) Hematoxylin-eosin staining of palatal shelves cultured for 48 h with implanted beads soaked in atRA or control vector. (B) Immunohistochemistry revealed significantly elevated Notch2 protein expression in MEPM cells surrounding the atRA-releasing bead compared with in the control group (n=3/group). (C) Ki-67 expression was decreased in in MEPM cells surrounding the atRA-releasing bead compared with in the control group (n=3/group). Scale bars, 20 µm. *P<0.05 vs. Con group. atRA, all-trans retinoic acid; MEPM, mouse embryonic palate mesenchymal; Con, control.
Discussion
In the present study, the effects of atRA on MEPM cells were investigated during palatogenesis. The present results indicated that atRA inhibited MEPM cellular proliferation in vitro and in vivo. Furthermore, Notch2 appeared to be involved in the atRA-mediated inhibition of cellular proliferation.
It has previously been reported that Notch signaling is inhibited during RA-induced inhibition of glioblastoma stem cell growth (11). Notably, the present study revealed that Notch2 expression was upregulated in atRA-treated E12.5–14.5 embryos, whereas Notch1 and Notch3 expression remained unaltered. In accordance with the results of a previous study (17), p21 expression was upregulated and cyclin D1 expression was downregulated in atRA-treated E12.5–14.5 embryos. Since ERK signaling is implicated in the regulation of cellular proliferation, total and p-ERK levels were assessed. p-ERK protein expression levels were revealed to be decreased in atRA-treated E12.5–14.5 embryos.
It is well established that the effects of atRA are mediated by the activation of RARs (18). Therefore, the present study investigated whether Notch2 upregulation may result from the direct action of atRA on RARs. The present results demonstrated that RAR inhibition prevented the atRA-induced Notch2 upregulation in MEPM cells. The upregulation of Notch2 observed during the cellular response to atRA suggested that Notch2 signaling may participate in the mechanisms underlying atRA-induced cleft palate. Other pathways may also participate in this process. Previous studies had indicated that Smad2/3 and Wnt/β-catenin signaling were involved in atRA-induced MEPM growth inhibition (14,18).
ERK1/2 signaling is implicated in the regulation of cellular proliferation (19,20). The ERK pathway has been reported to serve a critical role in cellular proliferation, via inducing the transcription of cyclin D1 (21). In addition, ERK2 has been demonstrated to enhance cellular proliferation via promoting p21 degradation (22). A previous study revealed that the regulation of MEK/ERK signaling by Notch2 is implicated in vascular smooth muscle cell proliferation (9). In the present study, knockdown of Notch2 increased p-ERK protein expression levels and attenuated the atRA-induced p-ERK downregulation. In addition, p21 expression was downregulated, whereas cyclin D1 expression was upregulated following Notch2 silencing. These results suggested that atRA, via the upregulation of Notch2 protein expression, may inhibit the proliferation of MEPM cells, possibly through the implication of ERK signaling pathways.
In summary, administration of atRA inhibited the proliferation of mouse embryo mesenchymal cells and blocked the elevation of palatal shelves, thus leading to a cleft palate. The present study identified that Notch signaling was involved in atRA-induced inhibition of MEPM cell proliferation. These findings highlighted the molecular and teratogenic actions of atRA, and might contribute to the development of potential novel treatments for cleft palate in the future.
Acknowledgements
The present study was supported by the Natural Science Foundation of China (grant nos. 81300862 and 81100739), the Project of Health and Family Planning Commission of Shenzhen Municipality (grant no. 201302202) and the Natural Science Foundation of Guangdong Province (grant no. S2011040004190).
References
- 1.Chai Y, Maxson RE., Jr Recent advances in craniofacial morphogenesis. Dev Dyn. 2006;235:2353–2375. doi: 10.1002/dvdy.20833. [DOI] [PubMed] [Google Scholar]
- 2.Wyszynski DF, Beaty TH. Phenotypic discordance in a family with monozygotic twins and nonsyndromic cleft lip and palate: Follow-up. Am J Med Genet. 2002;110:182–183. doi: 10.1002/ajmg.10443. [DOI] [PubMed] [Google Scholar]
- 3.Hilliard SA, Yu L, Gu S, Zhang Z, Chen YP. Regional regulation of palatal growth and patterning along the anterior-posterior axis in mice. J ANAT. 2005;207:655–667. doi: 10.1111/j.1469-7580.2005.00474.x. [DOI] [PMC free article] [PubMed] [Google Scholar]
- 4.Ross SA, McCaffery PJ, Drager UC, De Luca LM. Retinoids in embryonal development. Physiol Rev. 2000;80:1021–1054. doi: 10.1152/physrev.2000.80.3.1021. [DOI] [PubMed] [Google Scholar]
- 5.Birnbaum LS, Harris MW, Stocking LM, Clark AM, Morrissey RE. Retinoic acid and 2,3,7,8-tetrachlorodibenzo-p-dioxin selectively enhance teratogenesis in C57BL/6N mice. Toxicol Appl Pharmacol. 1989;98:487–500. doi: 10.1016/0041-008X(89)90177-4. [DOI] [PubMed] [Google Scholar]
- 6.Abbott BD, Harris MW, Birnbaum LS. Etiology of retinoic acid-induced cleft palate varies with the embryonic stage. Teratology. 1989;40:533–553. doi: 10.1002/tera.1420400602. [DOI] [PubMed] [Google Scholar]
- 7.Cao H, Hu Y, Wang P, Zhou J, Deng Z, Wen J. Down-regulation of Notch receptor signaling pathway induces caspase-dependent and caspase-independent apoptosis in lung squamous cell carcinoma cells. APMIS. 2012;120:441–450. doi: 10.1111/j.1600-0463.2011.02825.x. [DOI] [PubMed] [Google Scholar]
- 8.Wang T, Holt CM, Xu C, Ridley C, Jones POR, Baron M, Trump D. Notch3 activation modulates cell growth behaviour and cross-talk to Wnt/TCF signalling pathway. Cell Signal. 2007;19:2458–2467. doi: 10.1016/j.cellsig.2007.07.019. [DOI] [PubMed] [Google Scholar]
- 9.Baeten JT, Lilly B. Differential regulation of NOTCH2 and NOTCH3 contribute to their unique functions in vascular smooth muscle cells. J Biol Chem. 2015;290:16226–16237. doi: 10.1074/jbc.M115.655548. [DOI] [PMC free article] [PubMed] [Google Scholar]
- 10.Boucher JM, Harrington A, Rostama B, Lindner V, Liaw L. A receptor-specific function for Notch2 in mediating vascular smooth muscle cell growth arrest through cyclin-dependent kinase inhibitor 1B. Circ Res. 2013;113:975–985. doi: 10.1161/CIRCRESAHA.113.301272. [DOI] [PMC free article] [PubMed] [Google Scholar]
- 11.Ying M, Wang S, Sang Y, Sun P, Lal B, Goodwin CR, Guerrero-Cazares H, Quinones-Hinojosa A, Laterra J, Xia S. Regulation of glioblastoma stem cells by retinoic acid: Role for Notch pathway inhibition. Oncogene. 2011;30:3454–3467. doi: 10.1038/onc.2011.58. [DOI] [PMC free article] [PubMed] [Google Scholar]
- 12.Casey LM, Lan Y, Cho ES, Maltby KM, Gridley T, Jiang R. Jag2-Notch1 signaling regulates oral epithelial differentiation and palate development. Dev Dyn. 2006;235:1830–1844. doi: 10.1002/dvdy.20821. [DOI] [PMC free article] [PubMed] [Google Scholar]
- 13.He J, Chen Q, Wang L, Wu F, Du Z. Corticotropin-releasing hormone receptor 1 coexists with endothelin-1 and modulates its mRNA expression and release in rat paraventricular nucleus during hypoxia. Neuroscience. 2008;152:1006–1014. doi: 10.1016/j.neuroscience.2007.11.051. [DOI] [PubMed] [Google Scholar]
- 14.Wang M, Huang H, Chen Y. Smad2/3 is involved in growth inhibition of mouse embryonic palate mesenchymal cells induced by all-trans retinoic acid. Birth Defects Res A Clin Mol Teratol. 2009;85:780–790. doi: 10.1002/bdra.20588. [DOI] [PubMed] [Google Scholar]
- 15.Schneider CA, Rasband WS, Eliceiri KW. NIH Image to ImageJ: 25 years of image analysis. Nat Methods. 2012;9:671–675. doi: 10.1038/nmeth.2089. [DOI] [PMC free article] [PubMed] [Google Scholar]
- 16.Livak KJ, Schmittgen TD. Analysis of relative gene expression data using real-time quantitative PCR and the 2(−Delta Delta C(T)) Method. Methods. 2001;25:402–408. doi: 10.1006/meth.2001.1262. [DOI] [PubMed] [Google Scholar]
- 17.Okano J, Suzuki S, Shiota K. Involvement of apoptotic cell death and cell cycle perturbation in retinoic acid-induced cleft palate in mice. Toxicol Appl Pharmacol. 2007;221:42–56. doi: 10.1016/j.taap.2007.02.019. [DOI] [PubMed] [Google Scholar]
- 18.Hu X, Gao J, Liao Y, Tang S, Lu F. Retinoic acid alters the proliferation and survival of the epithelium and mesenchyme and suppresses Wnt/β-catenin signaling in developing cleft palate. Cell Death Dis. 2013;4:e898. doi: 10.1038/cddis.2013.424. [DOI] [PMC free article] [PubMed] [Google Scholar]
- 19.Meloche S, Pouysségur J. The ERK1/2 mitogen-activated protein kinase pathway as a master regulator of the G1- to S-phase transition. Oncogene. 2007;26:3227–3239. doi: 10.1038/sj.onc.1210414. [DOI] [PubMed] [Google Scholar]
- 20.Kolch W. Coordinating ERK/MAPK signalling through scaffolds and inhibitors. Nat Rev Mol Cell Biol. 2005;6:827–837. doi: 10.1038/nrm1743. [DOI] [PubMed] [Google Scholar]
- 21.Weber JD, Raben DM, Phillips PJ, Baldassare JJ. Sustained activation of extracellular-signal-regulated kinase 1 (ERK1) is required for the continued expression of cyclin D1 in G1 phase. Biochem J. 1997;326:61–68. doi: 10.1042/bj3260061. [DOI] [PMC free article] [PubMed] [Google Scholar]
- 22.Hwang CY, Lee C, Kwon KS. Extracellular signal-regulated kinase 2-dependent phosphorylation induces cytoplasmic localization and degradation of p21Cip1. Mol Cell Biol. 2009;29:3379–3389. doi: 10.1128/MCB.01758-08. [DOI] [PMC free article] [PubMed] [Google Scholar]


