

Abstract
Osteoporosis is a complex and multifactorial disease caused by an imbalance between bone formation and resorption. Post-menopausal women with endogenous estrogen deficiency suffer from systemic bone loss and osteoporosis, and are at high risk of this affecting the jaw bones. MicroRNAs (miRNAs or miRs) have been implicated in the mechanisms of metabolic bone diseases and are expressed at differential levels in alveolar bone following ovariectomy. In the present study, we systematically analyzed the expression profiles of miRNAs, mRNAs and long non-coding RNA (lncRNAs) in the mandible of ovariectomized (OVX) mice. A complex miRNA-mRNA-lncRNA regulatory network was constructed based on differentially expressed RNAs. Two core differentially expressed genes (DEGs), namely, LRP2 binding protein (Lrp2bp) and perilipin 4 (Plin4), significantly influenced the network targeted by differentially expressed miRNAs. Moreover, peroxisome proliferator-activated receptor (PPAR) and insulin signaling pathways were significantly dysregulated in the mandible of OVX mice. Several differentially expressed lncRNAs were also implicated in the two signaling pathways, which influenced mandible development by forming competing endogenous RNA. On the whole, our data indicate that the comprehensive analysis of miRNAs, mRNAs and lncRNAs provides insight into the pathogenesis of estrogen deficiency-induced osteoporosis in the mandible. This study proposes potential biomarkers for diagnosis or therapeutic targets for osteoporosis which may aid in the development of novel drugs for the treatment of osteoporosis.
Keywords: ovariectomized, mandible, differentially expressed miRNAs, long non-coding RNA, biomarker
Introduction
Osteoporosis is a complex disease associated with mineral composition and bone strength; this disease affects millions of individuals worldwide, particularly those with pathological fractures (1,2). Estrogen deficiency significantly influences skeletal homeostasis by inducing oral bone loss, which aggravates with aging (3–5). Previous studies have indicated that a decline in ovarian estrogen production during menopause results in the rapid loss of the trabecular microarchitecture, enhances cortical bone resorption and increases cortical porosity; these effects promote the development of osteoporosis and increase the risk of fragility fractures (6). In fact, estrogen deficiency alters the regional distribution of tissue mineral density (7,8), leading to alterations in the mechanical properties of bone at the tissue level. These dysregulations are commonly observed in alveolar bone (9–12). Recent studies have demonstrated that estrogen deficiency-induced bone loss also occurrs in the mandible (13–16).
Non-coding RNAs, including microRNAs (miRNAs or miRs) and long non-coding RNAs (lncRNAs), play important roles in biological processes. miRNAs are involved in cell differentiation, fate and apoptosis, as well as in the pathogenesis of various diseases; miRNAs have also been shown to be involved in regulating bone mass (17). A previous study reported that several miRNAs were dysregulated in bone tissues in ovariectomized (OVX) mice (18). Specifically, miR-133 expression has been shown to be enhanced during estrogen deficiency, modulating osteogenic differentiation of mesenchymal stem cells and inducing post-menopausal osteoporosis (19). The functions of other miRNAs in regulating bone loss have also been extensively investigated (20). For example, miR-705 and miR-3077-5p were found to synergistically mediate the shift of mesenchymal stem celll lineage commitment to adipocyte in osteoporosis bone marrow (21). miR-34a can block osteoporosis by inhibiting osteoclastogenesis and tgif2 which is pro-osteoclastogenic (22). miR-26a has been reported effectively to improve the osteogenic differentiation capability of mesenchymal stem cells isolated from ovariectomized osteoporotic mice both in vitro and in vivo (23). There is evidence to indicate that circulating monocytes are directly involved in osteoclastogenesis, and lncRNAs participate in osteoblast differentiation (24). It was also shown that the lncRNA-DANCR-induced expression of interleukin (IL)-6 and tumor necrosis factor (TNF)-α in blood mononuclear cells promoted bone resorption in post-menopausal women with low bone mineral density (BMD) (24). The potential therapeutic and biomarker functions of miRNAs and lncRNAs in treating bone disorders have received increasing research attention.
In the present study, we comprehensively analyzed the expression profiles of miRNAs, mRNAs and lncRNAs in the mandible of OVX mice. We then constructed a complex regulatory network to investigate the regulatory mechanisms of miRNAs and lncRNAs in mandible bone mass in OVX mice with estrogen deficiency.
Materials and methods
Animals
Female C57BL/6 mice, aged 8 weeks (mean weight of 19 g), were purchased from SLAC Laboratory Animal Company, Ltd. (Shanghai, China). The mice were anesthetized with an intraperitoneal injection of chloral hydrate (10%, 4 ml/kg body weight). Bilateral ovariectomy (performed on 8 mice) or sham operation (Sham-op, performed on 8 mice) was performed using standard methods. An incision was made on the midline of the abdomen, in order to find the uterine body and one side of the uterine horn. The ovary was at the end of the uterine horn. A suture was placed around the ovarian artery and vein prior to the removal of the ovary. After removing the ovary, we tightly closed the incision with a nylon 4-0 suture. The mice in the sham-operated group underwent the same procedure, except that the ovarian artery was not ligated and the ovary was not removed.
All the mice were placed in cages under standard laboratory conditions and fed standard chow during the study period
After 12 weeks, all mice were prepared for subsequent experiments. The procedures performed on the mice were approved by the Institute of Animal Care and Use Committee of Tongji University (no. TJLAC-014-016).
Preparation of specimens
The animals were sacrificed 12 weeks after the surgery. The right mandible and femur were dissected, filled with 4% paraformaldehyde for 2 days at room temperature, and then stored in 0.5% paraformaldehyde at 4°C. The specimens were used to evaluate their BMD and micro-structure through micro-computerized tomography (micro-CT) analysis. Subsequently, the right mandibles were used for histological analysis. For the left mandibles, the molars and most of the incisors were first dissected; the entire mandible was then used for microarray and reverse transcription-quantitative RT-PCR (RT-qPCR) assays.
Micro-CT and histological analyses
The right mandibles and femurs of the mice (n=3), without sample preparation or decalcification, were scanned using a high-resolution micro-CT system (µCT50; Scanco Medical AG, Bassersdorf, Switzerland). Images of the femur and mandible were acquired at 70 kV of energy and 114 µA of intensity with a voxel size of 10 µm, and we then analyzed some indicators [BMD, bone volume over total volume (BV/TV), trabecular separation (Tb.Sp) and trabecular number (TB.N)] of bone quality by micro-CT. Following image acquisition, the mandible and femur samples were decalcified and embedded in paraffin. Serial sections of 4 µm in thickness were cut and then stained with H&E in accordance with the manufacturer's instructions (Beyotime, Shanghai, China).
RNA extraction and array analysis
Mandibles were extracted from sham-operated and OVX mice. The left mandibles from the sham operation and OVX groups were harvested using TRIzol reagent (Sigma-Aldrich, St. Louis, MO, USA) and used to extract total RNA. The expression profiles of the lncRNAs, miRNAs and mRNAs in the mandible were analyzed. The microarrays used in this study were the Agilent Mouse lncRNA (4×180K, design ID: 049801; Agilent Technologies, Santa Clara, CA, USA) and Affymetrix miRNA 4.0 (Affymetrix, Santa Clara, CA, USA).
Data normalization
Feature extraction software was applied to extract the raw data from the array images. GeneSpring software was employed for basic analysis and normalization of the raw data by the quantile algorithm. Data symmetry and dispersed degree distribution were described by box-and-whisker plot. The scatter plot was used to display the overall distribution of central tendency.
Differential expression analysis
Probes with at least 100% of the samples in any one of the two conditions have flags in 'P' and were selected for data analysis. Differentially expressed miRNAs (DEmiRs) and differentially expressed genes (DEGs) were identified through fold changes, and P-values were calculated using the t-test. The threshold for up- and downregulated genes was set at a fold change of ≥2.0 and a value of P≤0.05.
Prediction of miRNA target genes
GeneSpring 12.5 software was used to predict target genes and analyze the function of DEmiRs. The TargetScan (http://www.targetscan.org/vert_71/), PITA (https://genie.weizmann.ac.il/pubs/mir07/mir07_data.html) and microRNAorg (http://www.microrna.org/microrna/home.do) databases were applied for target prediction. The analysis of biological processes and pathways was performed using the DAVID database (https://david.ncifcrf.gov/summary.jsp). Screening of miRNA targets related DElncRNAs was performed by using UCSC Genome Browser (http://genome.ucsc.edu/).
Gene screening using the neighborhood scoring algorithm
To systematically identify genes affected by ovariectomy, we mapped the DEGs into the protein signaling network. Protein interactions in the OVX mice were obtained from the STRING 9.05 database (https://string-db.org/). The parameters of STRING were set as at a confidence score of 0.4 and interaction types of neighborhood, experiment, database and text mining. Subsequently, a specific protein-protein interaction (PPI) network using the data from the OVX mice was constructed using Cytoscape software (www.cytoscape.org/). Generally, disease-related genes and their adjacent proteins participate in the same disease pathways or biological processes. The core protein and its neighbor protein significantly correlate at the expression level. Thus, we calculated the neighborhood score of signature genes in the mandible of OVX mice using the following formula:
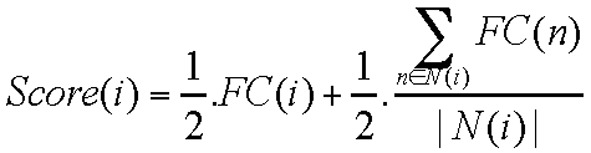 |
where i is the node in the network, FC(i) is the fold change value of genes, and N(i) is the nodes adjacent to i. Score(i) represents the relevance between node i and the disease. The neighbor-hood scoring algorithm is used to calculate the variation degree of nodes under the disease condition, as well as the influence of the node on neighboring genes using fold changes in the core node and its neighbor nodes to identify disease-related genes. When the core node and neighbor nodes exhibit a high (score >0) or low expression (score <0), the absolute scores ranked in the top 100 are designated as significant genes.
RNA extraction and RT-PCR
Mandibles were extracted from the sham-operated and OVX mice. The mandibles from the sham-operated and OVX groups were harvested using TRIzol reagent (Sigma-Aldrich) and used to extract total RNA. Complementary DNA (cDNA) were synthesized using a PrimeScript RT reagent kit (Takara, Dalian, China) under the following conditions: 37°C for 15 min, 85°C for 5 sec, and holding at 4°C. For miRNA expression analysis, miRNA was reverse transcribed using specific RT primers (RiboBio, Guangzhou, China) under the following conditions: 42°C for 60 min, 70°C for 10 min, and holding at 4°C.
RT-qPCR reactions were performed using the FastStart Universal SYBR-Green (Roche, Basel, Switzerland). RT-qPCR was performed using the following cycles: 10 min at 95°C, 10 sec at 95°C, 10 sec at 60°C and 10 sec at 72°C for 45 cycles. β-actin and U6 were used as loading controls for quantitation of mRNA and miRNAs respectively. The Bulge-Loop miRNA RT-qPCR Primer Set (RiboBio) was used for RT-qPCR. The primer information of related mRNAs was: Lrp2bp forward, 5′-ACCCAAAAGCTAGTGTGAAGGC-3′ and reverse, 5′-GGACTCCAGACTTCCGTTGC-3′; Plin4 forward, 5′-CACTACCAAGTCCGTGCTCAT-3′ and reverse, 5′-CAGACCCTTTAGCCACGTTAAT-3′; RhoQ forward, 5′-GCTAAAGGAATATGCGCCAAAC-3′ and reverse, 5′-TTCTGGGTTAAAGCTGAACACTC-3′; Phka1 forward, 5′-GTTGCCCGTTATTTAGACCGC-3′ and reverse, 5′-AAGTCGCAAGTTGTTTGCACA-3′; Gyk forward, 5′-TGAACCTGAGGATTTGTCAGC-3′ and reverse, 5′-CCATGTGGAGTAACGGATTTCG-3′; Ppp1r3c forward, 5′-CAGGAAGCCAAATCGCAGAGT-3′ and reverse, 5′-TTGGAGTCCGCAAACACGAC-3′; Lrp2bp forward, 5′-ACCCAAAAGCTAGTGTGAAGGC-3′ and reverse, 5′-GGACTCCAGACTTCCGTTGC-3′; Acsl6 forward, 5′-GAACTCAACTACTGGACCTGC-3′ and reverse, 5′-CCGTGGACGTAGATTTGTGC-3′; Fabp5 forward, 5′-CATCACGGTCAAAACCGAGAG-3′ and reverse, 5′-ACTCCACGATCATCTTCCCAT-3′; Mapk10 forward, 5′-CAAGAGGGCTTACCGGGAG-3′ and reverse, 5′-AGGTTGGCGTCCATCAGTTC-3′. Raw data can then be analyzed with LightCycler® 96 SW1.1 (Roche), generally using the automatic cycle threshold (Ct) setting for assigning baseline and threshold for Ct determination.
Statistical analysis
All values were expressed as the means ± standard deviation. All analyses were conducted using SPSS 20.0 software (SPSS, Inc., Chicago, IL, USA). The difference in the evaluated parameters among the groups was tested using the two-tailed independent sample t-test. A value of P<0.05 was considered to indicate a statistically significant difference.
Results
Establishment of the mouse model of osteoporosis induced by estrogen deficiency due to ovariectomy
We dissected the mandible and femur of the mice 12 weeks after the surgery. Micro-CT images and histological sections were used to visualize the established osteoporotic model (Fig. 1). The 3D images (Fig. 1A) and results from H&E staining (Fig. 1B) of the distal femur of the OVX mice revealed a significantly decreased subchondral trabecular bone volume compared with the sham-operated mice. We also analyzed trabecular bone 1 mm under the growth plate of the distal femur, as previously described (25). Micro-CT data demonstrated a significant decrease in BMD, BV/TV and TB.N, and an increase in Tb.Sp in the OVX group compared with the sham-operated group (Table I).
Figure 1.

Establishment of a mouse osteoporotic model. (A) The 3D images of the femur head in bone of sham-operated group and OVX group. (B) Representative H&E staining for the femurs of sham-operated group and OVX group (magnification, ×40). OVX, ovariectomized.
Table I.
Results from micro-CT analysis data of the femur between the OVX and sham-operated group.
| Control | Sham | OVX |
|---|---|---|
| BMD (mg A/ccm) | 868.7±10.39 | 824.62±3.22a |
| BV/TV(%) | 2.32±0.13 | 1.24±0.04a |
| Tb.Sp (mm) | 0.38±0.05 | 0.63±0.11a |
| Tb.N (1/mm) | 2.81±0.13 | 1.59±0.06a |
OVX, ovariectomized; BMD, bone mineral density; BV/TV, bone volume over total volume; Tb.Sp, trabecular separation; Tb.N, trabecular number.
P<0.05.
In the present study, the mandibles of the OVX mice were compared with those of the sham-operated mice. We compared the alveolar bone of the first molar, particularly the area of the furcation. The micro-CT images of the OVX mice revealed a significant decrease in alveolar bone from the coronal sagittal, and transaxial slices compared with those of the sham-operated mice (Fig. 2A). Moreover, H&E staining of the alveolar bone of the first molar in the OVX group revealed significantly reduced furcation and a relatively scant marrow space compared with those in the sham-operation group; this result is consistent with the micro-CT data (Fig. 2B). The alveolar bone of the first molar was also analyzed. The micro-CT data of the alveolar bone of the first mandibular molar in the OVX mice demonstrated decreased BV/TV (Fig. 2C).
Figure 2.

OVX induces mandibular osteoporosis. (A) 3D reconstruction images of the mandible. Sagittal slice (Sa), axial slice (ax) and coronal slice (co) at the alveolar bone of the first molar. (B) H&E staining of the alveolar bone of the first molar. (C) 3D reconstruction of region of interest for the alveolar bone. Results from micro-CT of BV/TV in the alveolar. *P<0.05. OVX, ovariectomized; BV/TV, bone volume over total volume.
Differential expression analysis of lncRNAs, miRNAs and mRNAs
Differential expression analysis was performed on the samples from the OVX and sham-operated mice following data normalization. A total of 2,915 significantly expressed mRNAs were obtained, including 1,037 upregulated mRNAs and 1,878 downregulated mRNAs. Moreover, 53 significantly expressed miRNAs were acquired; of which 18 were upregulated and 35 were downregulated (data not shown).
Functional enrichment analysis
Functional annotation was performed on the DEGs (2,915 significantly expressed mRNAs, including 1,037 upregulated and 1,878 downregulated mRNAs) in terms of biological processes, cell component and molecular function (Fig. 3A–C). In the biological process, the DEGs regulated transport, metabolic processes and oxidation-reduction (Fig. 3A). The DEGs were located in the membrane, cytoplasm and mitochondria (Fig. 3B). The DEGs also played a role in hydrolase activity and transferase activity (Fig. 3C). Moreover, the KEGG pathway analysis was used to identify differential signaling pathways between the OVX and sham-operated mice. We found that the differentially expressed mRNAs were involved in pathways such as the metabolic pathways and mitogen-activated protein kinase (MAPK) signaling pathway (Fig. 3D). Furthermore, the coverage scale of metabolic pathways was the largest, thereby indicating that genes associated with these pathways were differentially expressed between the OVX and sham-operated mice.
Figure 3.

Function enrichment of the differentially expressed genes. (A) Biological process analysis; (B) cellular component analysis; (C) molecular function analysis; (D) KEGG pathway analysis.
The target genes of DEmiRs may play important roles in mandible development; therefore, we analyzed the intersection of DEGs and the putative target genes of DEmiRs and identified this intersection as DEmiR-targeted DEGs. Functional enrichment analysis was also applied on the DEmiR-targeted DEGs. The results revealed that the DEGs targeted by DEmiRs significantly regulated the biological processes, including regulation of neuronal differentiation, muscle organ development and regulation of neurogenesis (Fig. 4A). Moreover, DEmiR-targeted DEGs were significantly involved in pathways, such as the peroxisome proliferator-activated receptor (PPAR) and insulin signaling pathways (26,27) (Fig. 4B).
Figure 4.

Function enrichment of the targets of differentially expressed miRNAs. (A) Biological process; (B) pathway.
Specific gene screening by neighborhood scoring
The DEGs were mapped to the PPI network of mice to construct differentially expressed PPI network. The nodes in the network represented the upregulated/downregulated genes, and the edges indicated the associations among the genes. The network contained 659 nodes and 3,904 edges, with 246 upregulated DEGs and 300 down-regulated DEGs, as well as 114 non-differential genes (data not shown). The analysis of topological properties indicated that the FYN, CREB binding protein (CREBBP), CREBBP, guanine nucleotide-binding protein subunit beta-2-like 1 (GNB2L1) and dynein cytoplasmic 1 heavy chain 1 (DYNC1H1) nodes exhibited relatively high degrees, suggesting their important roles in the network (data not shown). We subsequently analyzed the significance of each node in the network using the neighbor-hood scoring algorithm. The top 100 highest score nodes were obtained. The top 5 and the last 5 genes were extracted for further analysis (Table II). As shown in Table II, the first 5 genes were scored >0, representing an upregulatory tendency of the genes and their neighbor genes; conversely, the last 5 genes were scored <0, indicating a downregulatory tendency. Therefore, these 10 genes were the most significant in the network and may be potential biomarkers for clinical analysis and diagnosis.
Table II.
Network analysis to screen biomarkers.
| Gene | Neighbor score | Rank |
|---|---|---|
| Pla2g4d | 1.3395875 | 1 |
| Lrp2bp | 1.3003 | 2 |
| Rasgrf1 | 1.278100893 | 3 |
| Tmprss11a | 1.275932143 | 4 |
| Cd109 | 1.2653375 | 5 |
| Ppp1r10 | −1.365723214 | −5 |
| Atpaf1 | −1.374365402 | −4 |
| Drd4 | −1.393098215 | −3 |
| Myadml2 | −1.410200893 | −2 |
| Jun | −1.410200893 | −1 |
miRNA-mRNA regulatory network
To enhance the analysis of the DEmiR- and miRNA-targeted DEGs, we extracted 767 pairs of DEmiR-DEGs comprising 18 DEmiRs and 452 DEGs and constructed an miRNA-mRNA regulating network (Fig. 5). In this network, 23 DEmiR-targeted DEGs were significantly altered (i.e., differentially expressed with relatively high neigh-boring scores) in the OVX group compared with those in the sham group. These 23 DEGs corresponded to 12 DEmiRs and presented 36 miRNA-target pairs (Table III). Additionally, the DEmiRs and their own targets exhibited an opposite expression tendency in 19 of the 36 miRNA-target pairs (Fig. 6). Moreover, a consistent tendency was observed within 17 pairs, 6 of which presented a downregulatory tendency, and the remaining pairs exhibited an upregulatory tendency (Fig. 7). Considering that some lncRNAs have been suggested to play key roles in regulating the expression of their neighboring or overlapping genes in genome-wide analysis, we screened miRNA targets related to DElncRNAs; screening was performed based on the location distribution of these targets on mouse chromosomes (28) using UCSC Genome Browser. A total of 9 differentially expressed lncRNAs were acquired; through the prediction of lncRNAs, we found that 6 DElncRNAs regulated the target genes (Tables IV and V). In the specific pairs, LRP2 binding protein (Lrp2bp) and perilipin 4 (Plin4) exhibited the largest effect on the surrounding genes (Table III). Lrp2bp was downregulated in the experimental group and targeted by the upregulated expression of mmu-miR-203-3p (Fig. 6); conversely, Plin4 was downregulated in the experimental group and targeted by downregulated mmu-miR-486-5p and mmu-6597-PI428990136 as well as upregulated mmu-16032-PI428960544 (Fig. 7). These DElncRNAs may function as competing endogenous RNAs (ceRNAs) and thus affect the development of the mandible. The results of RT-qPCR also validated the presence of DEmiRs and DEGs in the mandible of the OVX mice (Fig. 8).
Figure 5.

miRNA-mRNA regulatory network. Triangles represent differentially expressed miRNAs; diamonds indicate risk genes which were also differentially expressed; circles represent non-risk genes that were differentially expressed. Upregulated and downregulated RNAs are marked with red and green, respectively. miRNA, microRNA; mRNA, messenger RNA.
Table III.
Risk miRNA-target pairs.
| miRNA | Label_miRNA | mRNA | Label_mRNA | mRNA_score |
|---|---|---|---|---|
| mmu-miR-203-3p | Up | Lrp2bp | Down | 1.3003 |
| mmu-miR-203-3p | Up | Vdac3 | Down | 1.234167 |
| mmu-miR-27a-3p | Up | Vdac3 | Down | 1.234167 |
| mmu-miR-486-5p | Down | Twf2 | Down | 1.186039 |
| mmu-miR-133b-3p | Down | Slc1a2 | Up | 1.17075 |
| mmu-miR-133a-3p | Down | Slc1a2 | Up | 1.17075 |
| mmu-miR-486-5p | Down | Sypl | Down | 1.144257 |
| mmu-miR-199a-3p | Up | Sypl | Down | 1.144257 |
| mmu-miR-15b-5p | Up | Sypl | Down | 1.144257 |
| mmu-miR-199b-3p | Up | Sypl | Down | 1.144257 |
| mmu-miR-199b-3p | Up | Flrt3 | Up | 1.130324 |
| mmu-miR-15b-5p | Up | Flrt3 | Up | 1.130324 |
| mmu-miR-27a-3p | Up | Flrt3 | Up | 1.130324 |
| mmu-miR-199a-3p | Up | Flrt3 | Up | 1.130324 |
| mmu-miR-342-3p | Up | Mpzl2 | Up | 1.100377 |
| mmu-miR-199b-3p | Up | Ywhag | Down | 1.093004 |
| mmu-miR-199a-3p | Up | Ywhag | Down | 1.093004 |
| mmu-miR-203-3p | Up | Ywhag | Down | 1.093004 |
| mmu-miR-205-5p | Up | Ky | Down | 1.073271 |
| mmu-miR-15b-5p | Up | Bfar | Down | 1.060279 |
| mmu-miR-15b-5p | Up | Slc2a1 | Up | 1.055304 |
| mmu-miR-203-3p | Up | Pnpla8 | Down | 1.003898 |
| mmu-miR-342-3p | Up | Perp | Up | 0.800739 |
| mmu-let-7f-5p | Up | B3galt1 | Down | 0.762609 |
| mmu-miR-486-5p | Down | B3galt1 | Down | 0.762609 |
| mmu-miR-15b-5p | Up | Cox11 | Down | −1.18494 |
| mmu-miR-17-5p | Up | Fam221a | Up | −1.19248 |
| mmu-miR-27a-3p | Up | Rnf144a | Up | −1.20161 |
| mmu-miR-205-5p | Up | Rnf144a | Up | −1.20161 |
| mmu-miR-27a-3p | Up | Tfam | Down | −1.21787 |
| mmu-miR-27a-3p | Up | Dnajc5b | Up | −1.2231 |
| mmu-miR-486-5p | Down | Sp5 | Down | −1.33851 |
| mmu-miR-133b-3p | Down | Gpr173 | Up | −1.36572 |
| mmu-miR-133a-3p | Down | Gpr173 | Up | −1.36572 |
| mmu-miR-486-5p | Down | Atpaf1 | Down | −1.37437 |
| mmu-miR-486-5p | Down | Plin4 | Down | −1.3931 |
mRNA, messenger RNA; miRNA, microRNA.
Figure 6.

Risk miRNA-gene pairs with opposite expression trend. miRNA, microRNA.
Figure 7.

Risk miRNA-gene pairs with similar expression trend. miRNA, microRNA.
Table IV.
lncRNAs associated with miRNA-targeted genes with opposite expression trend.
| Targets of miRNA
|
lncRNA
|
||||||
|---|---|---|---|---|---|---|---|
| mRNA | Label_mRNA | lncRNA | Label_lncRNA | Chr | Start | End | Strand |
| B3galt1 | Down | mmu_18405_PI428960544 | Down | chr2 | 67364593 | 67364652 | + |
| Bfar | Down | mmu_3193_PI428990136 | Down | chr16 | 13672094 | 13674200 | + |
| Bfar | Down | A_30_P01020928 | Down | chr16 | 84706136 | 84706072 | − |
| Slc1a2 | Up | mmu_542_PI428960544 | Up | chr2 | 103017944 | 103023051 | + |
| Ywhag | Down | mmu_26732_PI428960544 | Down | chr5 | 15752481 | 15877297 | + |
| Ywhag | Down | mmu_19914_PI428960544 | Down | chr5 | 15876898 | 15880322 | + |
lncRNA, long non-coding RNA; miRNA, microRNA; mRNA, messenger RNA.
Table V.
lncRNAs associated with miRNA-targeted genes with similar expression trend.
| Targets of miRNA
|
lncRNA
|
||||||
|---|---|---|---|---|---|---|---|
| mRNA | Label_mRNA | lncRNA | Label_lncRNA | Chr | Start | End | Strand |
| B3galt1 | Down | mmu_18405_PI428960544 | Down | chr2 | 67364593 | 67364652 | + |
| Fam221a | Up | mmu_12057_PI428990136 | Down | chr6 | 100518251 | 100519726 | − |
| Mpzl2 | Up | mmu_23197_PI428960544 | Down | chr9 | 79824054 | 79825631 | − |
| Mpzl2 | Up | mmu_13775_PI428960544 | Down | chr9 | 79596609 | 79597858 | − |
| Mpzl2 | Up | mmu_20471_PI428960544 | Up | chr9 | 44884261 | 44885520 | + |
| Mpzl2 | Up | mmu_5396_PI428960544 | Down | chr9 | 79648988 | 79652070 | − |
| Plin4 | Down | mmu_16032_PI428960544 | Up | chr17 | 56146354 | 56148925 | − |
| Plin4 | Down | mmu_6597_PI428990136 | Down | chr17 | 56251024 | 56256970 | − |
| Twf2 | Down | A_30_P01029984 | Up | chr9 | 106177744 | 106177800 | + |
lncRNA, long non-coding RNA; miRNA, microRNA; mRNA, messenger RNA.
Figure 8.

Relative expression of the selected miRNAs and genes. miRNA, microRNA. *P<0.05, **P<0.01, ***P<0.001.
Specific miRNA-gene-lncRNA pathway regulatory network
A total of 11 and 6 risk genes were obtained from the insulin and PPAR signaling pathways, respectively. We extracted DEmiRs that putatively targeted these risk genes and the DElncRNAs that correlated with these risk genes. A specific miRNA-gene-lncRNA pathway of the regulatory network was constructed by integrating DEmiR-risk genes and DElncRNA-risk genes (Fig. 9). To further analyze the function of the risk genes, we mapped them into the two signaling pathways.
Figure 9.

Specific miRNA-gene-lncRNA pathway regulation network. miRNA, microRNA; lncRNA, long non-coding RNA.
Several differentially expressed lncRNAs were mapped into the two pathways (Fig. 10). The results revealed that Sorbs1 participated in both pathways and was putatively targeted by mmu-miR-205-5p; this process also possibly involved two lncRNAs (mmu_12821_PI428960544 and mmu_18087_PI428960544) (Fig. 10). We deduced that these lncRNAs may function as ceRNA to regulate the signaling pathways associated with osteoporosis in the mandible of OVX mice. RT-qPCR analysis was also performed to validate the relative expression of partial miRNAs and mRNAs in the two signaling pathways (Fig. 11).
Figure 10.

Risk genes mapping into PPAR and insulin signaling pathways. The upper layer represents differentially expressed lncRNAs that may regulate risk genes; the middle layer represents differentially expressed miRNAs that target risk genes; the bottom layer represents signaling pathways. Upregulation is indicated in red, downregulation in green. lncRNA, long non-coding RNA; miRNA, microRNA.
Figure 11.

Relative expression of partial miRNAs and mRNAs in the two signaling pathways. miRNA, microRNA; mRNA, messenger RNA. *P<0.05, **P<0.01, ***P<0.001.
Discussion
Reduced ovarian production of estrogen during menopause results in rapid bone loss and increased cortical porosity (29). Estrogen deficiency increases the risk of fragility fractures in the hip, spine and wrist. A number of studies have reported that estrogen deficiency is associated with tooth loss (30,31), periodontal diseases (32,33) and decreased BMD of the mandible (34,35). However, studies have shown that estrogen deficiency-induced bone loss in the mandible is not as great as that in the long bone (36,37). The BMD and BV/TV of the mandible decrease less significantly than the long bone in response to OVX. The specific mechanism of this phenomenon remains unclear. The irregular shape of the mandible and the increased tooth mastication in OVX mice, which have been reported to eat approximately 10% more than the sham-operated controls (38), may possibly be important factors that alleviate bone loss in the mandible. The embryological difference between the mandible and long bone may also be the cause for the difference in the sensitivity of the two skeletal sites to estrogen deficiency (36). Therefore, some studies have suggested that mandibular cortical width can be used to predict osteoporosis (39,40); however, effective means with which to directly identify mandibular osteoporosis have yet to determined. We hypothesized that the specific molecular mechanisms of the mandible and long bone in response to estrogen deficiency are different. Hence, changes in biomarkers in the mandible of patients with osteoporosis may contribute to the diagnosis and treatment of mandibular osteoporosis.
With further studies on miRNAs, which regulate the expression of genes at the post-transcriptional level, researchers consider that miRNAs could be the next generation therapeutic targets in human diseases (41). Considering the key role of miRNAs in bone metabolism (42), miRNAs which subtly repress gene expression are anticipated to be highly efficacious in the treatment of bone diseases. Screening out the candidate miRNAs of post-menopausal osteoporosis and completing the target validation of these miRNAs, can provide a basis for the diagnosis and treatment of post-menopausal osteoporosis.
In the present study, we established a model of post-menopausal osteoporosis by the successful excision of ovaries in the mice. Alveolar bone loss significantly increased 3 months following ovariectomy in the mice. Theereafter, we systematically analyzed the distinct expression profiles of miRNAs, mRNAs and lncRNAs, as well as their complex regulatory networks associated with estrogen deficiency-induced osteoporosis in the mandible of OVX mice. DEmiRs between the OVX and sham-operated groups were mainly involved in metabolic systems, such as PPAR and insulin signaling pathways; hence, these DEmiRs play a crucial role in osteoporosis in the mandible of OVX mice. In the constructed DEmiR-DEG regulatory network, Lrp2bp and Plin4 exhibited the most significant effect on the network putatively regulated by mmu-miR-203-3p and mmu-miR-486-5p, respectively, and were thus associated with mandible development. Moreover, the regulatory network of the complex DEmiR-risk gene-lncRNA pathway was significantly associated with osteoporosis in the mandible of OVX mice. These findings may provide insight into the molecular mechanisms of post-menopausal osteoporosis in the mandible for the development of therapeutic strategies.
The core DEG Lrp2bp was putatively targeted by upregulated mmu-miR-203-3p, which may play an important role in estrogen deficiency-induced osteoporosis in the mandible. Further analysis through RT-qPCR validated the dysregulation of Lrp2bp and mmu-miR-203-3p in the mandible of OVX mice. Therefore, we deduced that upregulated mmu-miR-203-3p was partially targeted to inhibit Lrp2bp, which contributed to post-menopausal osteoporosis in the mandible. Similarly, a recent study indicated that mmu-miR-203 was induced by TNF-α to downregulate lysyl oxidase, thereby inhibiting osteoblast differentiation and finally inducing osteopenia (43). Another core gene, namely, DEG Plin4, was putatively targeted by downregulated mmu-miR-486-5p in the complex regulatory network; this core may also participate in mandible osteoporosis. Plin4 is a member of the PATS family of genes and is involved in the lipolysis of intracellular lipid deposits. Cusano et al (44) reported a significant association between a single nucleotide polymorphism (SNP) in Plin4 and height, but not with bone traits in adult Caucasian participants of the Framingham Osteoporosis Study. However, a gender-specific association between one polymorphism of Plin1 and BMD was reported in a Japanese population (45). These contradicting results may be due to the different ethnicities of the participants used in these studies. Nevertheless, the precise role of Plin4 in estrogen deficiency-induced osteoporosis in the mandible must be further investigated. The present findings present potential therapeutic targets for the treatment of post-menopausal osteoporosis in the mandible.
DEmiR targets were found to be significantly associated with PPAR and insulin signaling pathways, which affect the development of the mandible (46,47). Previous studies have reported a close association between lipid metabolism and bone remodeling, as well as agents inducing adipogenesis that inhibit osteoblast differentiation, thereby promoting bone loss. PPARγ plays a critical role in adipocyte differentiation (48) and acts as a molecular switch between osteogenic and adipogenic lineage commitment (49). In a previous study, the overexpression of PPARγ in osteoblasts using collagen type 1 promoter decreased bone mass gain in males and accelerated bone loss in female OVX mice (50). Moreover, thiazolidinediones, inducers of PPARγ, and the subsequent induction of mesenchymal stem cells into adipocytes are associated with bone loss and osteoporosis. By contrast, PPARγ agonist has been shown to suppress inflammatory periodontal bone loss by inhibiting osteoclastogenesis (51). The insulin-like growth factor (Igf) family, as well as other growth factor families (Hh, Wnt, Tgf-Bmp, Mapk-Fgf and Notch), which implement biological function via the insulin signaling pathway, may contribute to the merging of the mandibular arch (52). Variations in the promoter region of the IGF-1 gene have been shown to be associated with BMD and the risk of osteoporosis in a Chinese post-menopausal population (53,54). Furthermore, we noted that some DEGs involved in the two signaling pathways were not only differentially expressed, but were also targeted by DEmiRNAs; Sorbs1 correlated with the two signaling pathways. The present results indicated that upregulated mmu-miR-205-5p putatively targeted the Sorbs1 gene, implicating both PPAR and insulin signaling pathways. miR-205 expression is enhanced by STAT3 activation, whereas CHOP expression is inhibited in osteoblasts; these findings may provide a basis for elucidating the mechanisms underlying the pathogenesis of associated diseases, including osteoporosis (55). We also validated the upregulation of miR-205-5p in the mandible of OVX mice through qRT-qPCR analysis; the present study may provide insight into the complex molecular mechanisms of estrogen deficiency-induced osteoporosis in the mandible.
Six differentially expressed lncRNAs were acquired in the present study. These lncRNAs may act as miRNA sponges, i.e., as ceRNAs, to decrease the amount of miRNAs available to target mRNAs (56). Moreover, two lncRNAs (mmu_12821_PI428960544 and mmu_18087_PI428960544) may be associated with the regulation of mmu-miR-205-5p and its putatively targeted Sorbs1 gene. We deduced that these lncRNAs may function as ceRNAs to regulate the signaling pathways in osteoporosis in the mandible of OVX mice. The differentially expressed lncRNA-mmu-16032-PI428960544 and mmu-6597-PI428990136, as well as Plin4 and mmu-miR-486-5p may intervene in mandible development via forming ceRNAs. This hypothesis may highlight a potential method for the treatment of osteoporosis; however, this requires validation in future studies.
Acknowledgments
The present study was supported by the National Natural Science Foundation of China (grant no. 81470716) and Science and Technology Committee Foundation of Shanghai (grant no. 14411967200).
References
- 1.Simsek G, Uzun H, Karter Y, Aydin S, Yigit G. Effects of osteoporotic cytokines in ovary-intact and ovariectomised rats with induced hyperthyroidism; is skeletal responsiveness to thyroid hormone altered in estrogen deficiency? Tohoku J Exp Med. 2003;201:81–89. doi: 10.1620/tjem.201.81. [DOI] [PubMed] [Google Scholar]
- 2.Zhao L, Mao Z, Schneider LS, Brinton RD. Estrogen receptor β-selective phytoestrogenic formulation prevents physical and neurological changes in a preclinical model of human menopause. Menopause. 2011;18:1131–1142. doi: 10.1097/gme.0b013e3182175b66. [DOI] [PMC free article] [PubMed] [Google Scholar]
- 3.Mawatari T, Miura H, Higaki H, Kurata K, Moro-oka T, Murakami T, Iwamoto Y. Quantitative analysis of three-dimensional complexity and connectivity changes in trabecular microarchitecture in relation to aging, menopause, and inflammation. J Orthop Sci. 1999;4:431–438. doi: 10.1007/s007760050126. [DOI] [PubMed] [Google Scholar]
- 4.Liang H, Ma Y, Pun S, Stimpel M, Jee WS. Aging- and ovariectomy-related skeletal changes in spontaneously hypertensive rats. Anat Rec. 1997;249:173–180. doi: 10.1002/(SICI)1097-0185(199710)249:2<173::AID-AR3>3.0.CO;2-Z. [DOI] [PubMed] [Google Scholar]
- 5.Zhao Q, Liu X, Zhang L, Shen X, Qi J, Wang J, Qian N, Deng L. Bone selective protective effect of a novel bone-seeking estrogen on trabecular bone in ovariectomized rats. Calcif Tissue Int. 2013;93:172–183. doi: 10.1007/s00223-013-9739-1. [DOI] [PMC free article] [PubMed] [Google Scholar]
- 6.Manolagas SC, O'Brien CA, Almeida M. The role of estrogen and androgen receptors in bone health and disease. Nat Rev Endocrinol. 2013;9:699–712. doi: 10.1038/nrendo.2013.179. [DOI] [PMC free article] [PubMed] [Google Scholar]
- 7.Wronski TJ, Dann LM, Scott KS, Cintrón M. Long-term effects of ovariectomy and aging on the rat skeleton. Calcif Tissue Int. 1989;45:360–366. doi: 10.1007/BF02556007. [DOI] [PubMed] [Google Scholar]
- 8.Sharma D, Ciani C, Marin PA, Levy JD, Doty SB, Fritton SP. Alterations in the osteocyte lacunar-canalicular microenvironment due to estrogen deficiency. Bone. 2012;51:488–497. doi: 10.1016/j.bone.2012.05.014. [DOI] [PMC free article] [PubMed] [Google Scholar]
- 9.Xu T, Yan M, Wang Y, Wang Z, Xie L, Tang C, Zhang G, Yu J. Estrogen deficiency reduces the dentinogenic capacity of rat lower incisors. J Mol Histol. 2014;45:11–19. doi: 10.1007/s10735-013-9533-4. [DOI] [PMC free article] [PubMed] [Google Scholar]
- 10.Liu X, Zhang R, Zhou Y, Yang Y, Si H, Li X, Liu L. The effect of Astragalus extractive on alveolar bone rebuilding progress of tooth extracted socket of ovariectomied rats. Afr J Tradit Complement Altern Med. 2014;11:91–98. doi: 10.4314/ajtcam.v11i5.15. [DOI] [PMC free article] [PubMed] [Google Scholar]
- 11.Zhang R, Liu ZG, Li C, Hu SJ, Liu L, Wang JP, Mei QB. Du-Zhong (Eucommia ulmoides Oliv.) cortex extract prevent OVX-induced osteoporosis in rats. Bone. 2009;45:553–559. doi: 10.1016/j.bone.2008.08.127. [DOI] [PubMed] [Google Scholar]
- 12.Tewari D, Khan MP, Sagar N, China SP, Singh AK, Kheruka SC, Barai S, Tewari MC, Nagar GK, Vishwakarma AL, et al. Ovariectomized rats with established osteopenia have diminished mesenchymal stem cells in the bone marrow and impaired homing, osteoinduction and bone regeneration at the fracture site. Stem Cell Rev. 2015;11:309–321. doi: 10.1007/s12015-014-9573-5. [DOI] [PubMed] [Google Scholar]
- 13.Bhatnagar S, Krishnamurthy V, Pagare SS. Diagnostic efficacy of panoramic radiography in detection of osteoporosis in post-menopausal women with low bone mineral density. J Clin Imaging Sci. 2013;3:23. doi: 10.4103/2156-7514.113140. [DOI] [PMC free article] [PubMed] [Google Scholar]
- 14.Aguilera-Barreirode LA, Dáva los-Vázquez KF, Jiménez-Méndez C, Jiménez-Mendoza D, Olivarez-Padrón LA, Rodríguez-García ME. The relationship of nutritional status, body and mandibular bone mineral density, tooth loss and fracture risk (FRAX) in pre-and postmenopausal women with periodontitis. Nutr Hosp. 2014;29:1419–1426. doi: 10.3305/nh.2014.29.6.7382. In Spanish. [DOI] [PubMed] [Google Scholar]
- 15.Nackaerts O, Jacobs R, Devlin H, Pavitt S, Bleyen E, Yan B, Borghs H, Lindh C, Karayianni K, van der Stelt P, et al. Osteoporosis detection using intraoral densitometry. Dentomaxillofac Rad. 2008;37:282–287. doi: 10.1259/dmfr/30424604. [DOI] [PubMed] [Google Scholar]
- 16.Barngkgei I, Al Haffar I, Khattab R. Osteoporosis prediction from the mandible using cone-beam computed tomography. Imaging Sci Dent. 2014;44:263–271. doi: 10.5624/isd.2014.44.4.263. [DOI] [PMC free article] [PubMed] [Google Scholar]
- 17.Chen J, Qiu M, Dou C, Cao Z, Dong S. MicroRNAs in bone balance and osteoporosis. Drug Dev Res. 2015;76:235–245. doi: 10.1002/ddr.21260. [DOI] [PubMed] [Google Scholar]
- 18.An JH, Ohn JH, Song JA, Yang JY, Park H, Choi HJ, Kim SW, Kim SY, Park WY, Shin CS. Changes of microRNA profile and microRNA-mRNA regulatory network in bones of ovariectomized mice. J Bone Miner Res. 2014;29:644–56. doi: 10.1002/jbmr.2060. [DOI] [PubMed] [Google Scholar]
- 19.Lv H, Sun Y, Zhang Y. MiR-133 is involved in estrogen deficiency-induced osteoporosis through modulating osteogenic differentiation of mesenchymal stem cells. Med Sci Monit. 2015;21:1527–1534. doi: 10.12659/MSM.894323. [DOI] [PMC free article] [PubMed] [Google Scholar]
- 20.Sun M, Zhou X, Chen L, Huang S, Leung V, Wu N, Pan H, Zhen W, Lu W, Peng S. The regulatory roles of microRNAs in bone remodeling and perspectives as biomarkers in osteoporosis. Biomed Res Int. 2016;2016:1652417. doi: 10.1155/2016/1652417. [DOI] [PMC free article] [PubMed] [Google Scholar]
- 21.Liao L, Yang X, Su X, Hu C, Zhu X, Yang N, Chen X, Shi S, Shi S, Jin Y. Redundant miR-3077-5p and miR-705 mediate the shift of mesenchymal stem cell lineage commitment to adipocyte in osteoporosis bone marrow. Cell Death Dis. 2013;4:e600. doi: 10.1038/cddis.2013.130. [DOI] [PMC free article] [PubMed] [Google Scholar]
- 22.Krzeszinski JY, Wei W, Huynh H, Jin Z, Wang X, Chang TC, Xie XJ, He L, Mangala LS, Lopez-Berestein G, et al. miR-34a blocks osteoporosis and bone metastasis by inhibiting osteoclastogenesis and Tgif2. Nature. 2014;512:431–435. doi: 10.1038/nature13375. [DOI] [PMC free article] [PubMed] [Google Scholar] [Retracted]
- 23.Li Y, Fan L, Hu J, Zhang L, Liao L, Liu S, Wu D, Yang P, Shen L, Chen J, Jin Y. MiR-26a rescues bone regeneration deficiency of mesenchymal stem cells derived from osteoporotic mice. Mol Ther. 2015;23:1349–1357. doi: 10.1038/mt.2015.101. [DOI] [PMC free article] [PubMed] [Google Scholar]
- 24.Tong X, Gu PC, Xu SZ, Lin XJ. Long non-coding RNA-DANCR in human circulating monocytes: A potential biomarker associated with postmenopausal osteoporosis. Biosci Biotechnol Biochem. 2015;79:732–737. doi: 10.1080/09168451.2014.998617. [DOI] [PubMed] [Google Scholar]
- 25.Kang DM, Yoon KH, Kim JY, Oh JM, Lee M, Jung ST, Juhng SK, Lee YH. CT imaging biomarker for evaluation of emodin as a potential drug on LPS-mediated osteoporosis mice. Acad Radiol. 2014;21:457–462. doi: 10.1016/j.acra.2013.12.009. [DOI] [PubMed] [Google Scholar]
- 26.Cao J, Ou G, Yang N, Ding K, Kream BE, Hamrick MW, Isales CM, Shi XM. Impact of targeted PPARγ disruption on bone remodeling. Mol Cell Endocrinol. 2015;410:27–34. doi: 10.1016/j.mce.2015.01.045. [DOI] [PMC free article] [PubMed] [Google Scholar]
- 27.Liu Q, Liu H, Yu X, Wang Y, Yang C, Xu H. Analysis of the role of insulin signaling in bone turnover induced by fluoride. Biol Trace Elem Res. 2016;171:380–390. doi: 10.1007/s12011-015-0555-5. [DOI] [PubMed] [Google Scholar]
- 28.Aydin A, Kenar H, Atmaca H, Alici T, Gacar G, Müezzinoğlu ÜS, Karaöz E. The short- and long- term effects of estrogen deficiency on apoptosis in musculoskeletal tissues: an experimental animal model study. Arch Iran Med. 2013;16:271–276. [PubMed] [Google Scholar]
- 29.Väänänen HK, Härkönen PL. Estrogen and bone metabolism. Maturitas. 1996;23(Suppl):S65–S69. doi: 10.1016/0378-5122(96)01015-8. [DOI] [PubMed] [Google Scholar]
- 30.Darcey J, Horner K, Walsh T, Southern H, Marjanovic EJ, Devlin H. Tooth loss and osteoporosis: To assess the association between osteoporosis status and tooth number. Br Dent J. 2013;214:E10. doi: 10.1038/sj.bdj.2013.165. [DOI] [PubMed] [Google Scholar]
- 31.Jang KM, Cho KH, Lee SH, Han SB, Han KD, Kim YH. Tooth loss and bone mineral density in postmenopausal South Korean women: The 2008–2010 Korea National Health and Nutrition Examination Survey. Maturitas. 2015;82:360–364. doi: 10.1016/j.maturitas.2015.07.016. [DOI] [PubMed] [Google Scholar]
- 32.Numoto Y, Mori T, Maeda S, Tomoyasu Y, Higuchi H, Egusa M, Miyawaki T. Low bone mass is a risk factor in periodontal disease-related tooth loss in patients with intellectual disability. Open Dent J. 2013;7:157–161. doi: 10.2174/1874210601307010157. [DOI] [PMC free article] [PubMed] [Google Scholar]
- 33.Guiglia R, Di Fede O, Lo Russo L, Sprini D, Rini GB, Campisi G. Osteoporosis, jawbones and periodontal disease. Med Oral Patol Oral Cir Bucal. 2013;18:e93–e99. doi: 10.4317/medoral.18298. [DOI] [PMC free article] [PubMed] [Google Scholar]
- 34.Khojastehpour L, Mogharrabi S, Dabbaghmanesh MH, Iraji Nasrabadi N. Comparison of the mandibular bone densitometry measurement between normal, osteopenic and osteoporotic postmenopausal women. J Dent (Tehran) 2013;10:203–209. [PMC free article] [PubMed] [Google Scholar]
- 35.Ejiri S, Tanaka M, Watanabe N, Anwar RB, Yamashita E, Yamada K, Ikegame M. Estrogen deficiency and its effect on the jaw bones. J Bone Miner Metab. 2008;26:409–415. doi: 10.1007/s00774-008-0870-4. [DOI] [PubMed] [Google Scholar]
- 36.Mavropoulos A, Rizzoli R, Ammann P. Different responsiveness of alveolar and tibial bone to bone loss stimuli. J Bone Miner Res. 2007;22:403–410. doi: 10.1359/jbmr.061208. [DOI] [PubMed] [Google Scholar]
- 37.Zhang Y, Li Y, Gao Q, Shao B, Xiao J, Zhou H, Niu Q, Shen M, Liu B, Hu K, Kong L. The variation of cancellous bones at lumbar vertebra, femoral neck, mandibular angle and rib in ovariectomized sheep. Arch Oral Biol. 2014;59:663–669. doi: 10.1016/j.archoralbio.2014.03.013. [DOI] [PubMed] [Google Scholar]
- 38.Elovic RP, Hipp JA, Hayes WC. Ovariectomy decreases the bone area fraction of the rat mandible. Calcif Tissue Int. 1995;56:305–310. doi: 10.1007/BF00318051. [DOI] [PubMed] [Google Scholar]
- 39.Nagi R. Relationship between femur bone mineral density, body mass index and dental panoramic mandibular cortical width in diagnosis of elderly postmenopausal women with osteoporosis. J Clin Diagn Res. 2014;8:ZC36–ZC40. doi: 10.7860/JCDR/2014/9210.4748. [DOI] [PMC free article] [PubMed] [Google Scholar]
- 40.Hekmatin E, Ahmadi SS, Ataiekhorasgani M, Feizianfard M, Jafaripozve S, Jafaripozve N. Prediction of lumbar spine bone mineral density from the mandibular cortical width in postmenopausal women. J Res Med Sci. 2013;18:951–955. [PMC free article] [PubMed] [Google Scholar]
- 41.Srinivasan S, Selvan ST, Archunan G, Gulyas B, Padmanabhan P. MicroRNAs - the next generation therapeutic targets in human diseases. Theranostics. 2013;3:930–942. doi: 10.7150/thno.7026. [DOI] [PMC free article] [PubMed] [Google Scholar]
- 42.Zhao X, Xu D, Li Y, Zhang J, Liu T, Ji Y, Wang J, Zhou G, Xie X. MicroRNAs regulate bone metabolism. J Bone Miner Metab. 2014;32:221–231. doi: 10.1007/s00774-013-0537-7. [DOI] [PubMed] [Google Scholar]
- 43.Khosravi R, Sodek KL, Xu WP, Bais MV, Saxena D, Faibish M, Trackman PC. A novel function for lysyl oxidase in pluripotent mesenchymal cell proliferation and relevance to inflammation-associated osteopenia. PLoS One. 2014;9:e100669. doi: 10.1371/journal.pone.0100669. [DOI] [PMC free article] [PubMed] [Google Scholar]
- 44.Cusano NE, Kiel DP, Demissie S, Karasik D, Cupples LA, Corella D, Gao Q, Richardson K, Yiannakouris N, Ordovas JM. A Polymorphism in a gene encoding Perilipin 4 is associated with height but not with bone measures in individuals from the Framingham Osteoporosis Study. Calcif Tissue Int. 2012;90:96–107. doi: 10.1007/s00223-011-9552-7. [DOI] [PMC free article] [PubMed] [Google Scholar]
- 45.Yamada Y, Ando F, Shimokata H. Association of polymorphisms in forkhead box C2 and perilipin genes with bone mineral density in community-dwelling Japanese individuals. Int J Mol Med. 2006;18:119–127. [PubMed] [Google Scholar]
- 46.Surve VV, Andersson N, Alatalo S, Lehto-Axtelius D, Halleen J, Väänänen K, Håkanson R. Does combined gastrectomy and ovariectomy induce greater osteopenia in young female rats than gastrectomy alone? Calcif Tissue Int. 2001;69:274–280. doi: 10.1007/s002230020044. [DOI] [PubMed] [Google Scholar]
- 47.Reinwald S, Mayer LP, Hoyer PB, Turner CH, Barnes S, Weaver CM. A longitudinal study of the effect of genistein on bone in two different murine models of diminished estrogen-producing capacity. J Osteoporos. 2009;2010 doi: 10.4061/2010/145170. [DOI] [PMC free article] [PubMed] [Google Scholar]
- 48.Tontonoz P, Hu E, Spiegelman BM. Stimulation of adipogenesis in fibroblasts by PPAR gamma 2, a lipid-activated transcription factor. Cell. 1994;79:1147–1156. doi: 10.1016/0092-8674(94)90006-X. [DOI] [PubMed] [Google Scholar]
- 49.Lecka-Czernik B, Gubrij I, Moerman EJ, Kajkenova O, Lipschitz DA, Manolagas SC, Jilka RL. Inhibition of Osf2/Cbfa1 expression and terminal osteoblast differentiation by PPARgamma2. J Cell Biochem. 1999;74:357–371. doi: 10.1002/(SICI)1097-4644(19990901)74:3<357::AID-JCB5>3.0.CO;2-7. [DOI] [PubMed] [Google Scholar]
- 50.Cho SW, Yang JY, Her SJ, Choi HJ, Jung JY, Sun HJ, An JH, Cho HY, Kim SW, Park KS, et al. Osteoblast-targeted overexpression of PPARγ inhibited bone mass gain in male mice and accelerated ovariectomy-induced bone loss in female mice. J Bone Miner Res. 2011;26:1939–1952. doi: 10.1002/jbmr.366. [DOI] [PubMed] [Google Scholar]
- 51.Hassumi MY, Silva-Filho VJ, Campos-Júnior JC, Vieira SM, Cunha FQ, Alves PM, Alves JB, Kawai T, Gonçalves RB, Napimoga MH. PPAR-gamma agonist rosiglitazone prevents inflammatory periodontal bone loss by inhibiting osteoclastogenesis. Int Immunopharmacol. 2009;9:1150–1158. doi: 10.1016/j.intimp.2009.06.002. [DOI] [PubMed] [Google Scholar]
- 52.Fujita K, Taya Y, Shimazu Y, Aoba T, Soeno Y. Molecular signaling at the fusion stage of the mouse mandibular arch: Involvement of insulin-like growth factor family. Int J Dev Biol. 2013;57:399–406. doi: 10.1387/ijdb.120110ys. [DOI] [PubMed] [Google Scholar]
- 53.Li F, Xing WH, Yang XJ, Jiang HY, Xia H. Influence of polymorphisms in insulin-like growth factor-1 on the risk of osteoporosis in a Chinese postmenopausal female population. Int J Clin Exp Pathol. 2015;8:5727–5732. [PMC free article] [PubMed] [Google Scholar]
- 54.Yun-Kai L, Hui W, Xin-Wei Z, Liang G, Jin-Liang Z. The polymorphism of Insulin-like growth factor-I (IGF-I) is related to osteoporosis and bone mineral density in postmenopausal population. Pak J Med Sci. 2014;30:131–135. doi: 10.12669/pjms.301.4264. [DOI] [PMC free article] [PubMed] [Google Scholar]
- 55.Zhuang J, Gao R, Wu H, Wu X, Pan F. Signal transducer and activator of transcription 3 regulates CCAAT-enhancer-binding homologous protein expression in osteoblasts through upregulation of microRNA-205. Exp Ther Med. 2015;10:295–299. doi: 10.3892/etm.2015.2464. [DOI] [PMC free article] [PubMed] [Google Scholar]
- 56.Paci P, Colombo T, Farina L. Computational analysis identifies a sponge interaction network between long non-coding RNAs and messenger RNAs in human breast cancer. BMC Syst Biol. 2014;8:83. doi: 10.1186/1752-0509-8-83. [DOI] [PMC free article] [PubMed] [Google Scholar]