Abstract
OBJECTIVE
The purpose of this study is to analyze the 18F-FDG PET/CT features of solid renal masses detected in patients with lymphoma and to evaluate the ability of PET/CT to differentiate renal cell carcinoma (RCC) from renal lymphomatous involvement.
MATERIALS AND METHODS
Thirty-six patients with solid renal masses on PET/CT performed for staging or follow-up of lymphoma were evaluated retrospectively. The features recorded for each renal mass included the following standardized uptake values (SUVs) on PET/CT: the maximum SUV (SUVmax), the mean SUV (SUVmean), the ratio of the SUVmax of the tumor to that of the normal kidney cortex, the ratio of the SUVmean of the tumor to that of the normal kidney cortex, the ratio of the SUVmax of the tumor to that of the normal liver, and the ratio of the SUVmean of the tumor to that of the normal liver. Renal mass size and margins (well defined vs infiltrative) and the presence of calcifications were evaluated on CT. Renal biopsy results were used as the reference standard. Relationships between imaging parameters and histopathologic findings were assessed.
RESULTS
Of the 36 renal masses evaluated, 22 (61.1%) were RCCs and 14 (38.9%) were renal lymphomas. All SUV metrics were higher for renal lymphomas than for RCCs (p< 0.0001, for all). All renal lymphomas had an SUVmax higher than 5.98 g/mL (median, 10.99 g/mL), whereas all RCCs had an SUVmax lower than 5.26 g/mL (median, 2.91 g/mL). No statistically significant differences in mass size or margins were found between RCCs and renal lymphoma.
CONCLUSION
PET/CT features may be useful for differentiating RCCs from renal involvement in patients with lymphoma with solid renal masses.
Keywords: cancer, CT, lymphoma, PET, renal cell carcinoma
Renal involvement in patients with lymphoma is relatively common, particularly in the setting of disseminated disease, and it can result from direct invasion or hematogenous spread [1, 2]. Secondary renal involvement has a frequency of approximately 3% [3] and occurs more commonly in patients with non-Hodgkin lymphoma than in those with Hodgkin lymphoma. Primary renal lymphoma is more uncommon and accounts for fewer than 1% of all lymphomas. Renal lymphoma may be unilateral or bilateral. It may present as a solitary mass or as multiple renal masses, and it may develop as infiltrative renal disease or as direct invasion from contiguous retroperitoneal adenopathy [2, 4].
Patients with lymphoma also have an increased risk for renal cell carcinoma (RCC) [5, 6]. No clear explanation exists for this increased incidence of RCC in patients with lymphoma, although a number of factors, such as prior treatment, exposure to environmental agents, genetic predisposition, and immune dysregulation, have been suggested [5]. When a renal mass is detected in patients with a history of lymphoma, differentiation between RCC and renal lymphoma is essential because management of the two entities differs. Renal lymphoma is treated with chemotherapy, whereas the management options for RCC include active surveillance, surgery, or focal ablation, depending on tumor stage and the prognosis of the patient [7].
Fluorine-18 FDG PET/CT combines functional and anatomic imaging information and is considered the standard of care for tumor staging and response assessment in patients with lymphoma [8, 9]. As with lymphomatous involvement in other organs, renal lymphomas are usually FDG avid, whereas the reported FDG uptake of RCCs is variable [10]. In line with the increased frequency of asymptomatic renal masses in the general population, which has resulted from the widespread use of cross-sectional imaging [11], renal masses are also detected in patients undergoing FDG PET/CT for the evaluation of lymphoma. Differentiation of RCC from lymphomatous involvement is crucial in this context because the management strategy will vary depending on the cause. Thus, the aim of the present study is to analyze the FDG PET/CT features of solid renal masses detected in patients with lymphoma and to evaluate the ability of PET/CT to differentiate RCC from renal lymphomatous involvement.
Materials and Methods
Patients
This retrospective study was approved by the institutional review board at Memorial Sloan Kettering Cancer Center, which waived the informed consent requirement.
The electronic database at Memorial Sloan Kettering Cancer Center was used to identify patients who fulfilled the following criteria for inclusion in the study: having undergone FDG PET/CT performed between 2003 and 2014 for staging or follow-up of known lymphoma, having a solid renal mass without intratumoral fat reported on the original standard-of-care PET/CT report, and having undergone biopsy of the renal mass within 6 months of the PET/CT examination.
Image Acquisition and Data Analysis
All patients underwent scanning performed using dedicated PET/CT systems, with 26 patients undergoing scanning with one of five PET/CT systems (Discovery ST, Discovery STE, Discovery LS, Discovery 600, or Discovery 690, all from GE Healthcare) and with 10 patients undergoing scanning with one PET/CT system (Biograph LSO, Siemens Healthcare). The clinical imaging protocol included the injection of approximately 400–455 MBq of FDG after the patient had fasted for at least 6 h and had a documented blood glucose level of less than 200 mg/dL; this was followed by a mean uptake period of 66 minutes (range, 55–80 minutes). Subsequently, a low-dose attenuation-correction CT scan (tube voltage, 120 140 kV; tube current, ≈80 mA) was acquired, followed by PET emission images acquired from the mid thigh to the base of the skull. All patients received an oral contrast agent (either 900 mL of 2% barium sulfate suspension or 25 mL of diatrizoate meglumine and diatrizoate sodium solution [MD-Gastroview, Mallinckrodt Imaging] diluted in 1000 mL of drink mix [Crystal Light, Kraft Foods]) during FDG uptake. No iodinated IV contrast agent was administered.
PET/CT images were reviewed on a commercially available software platform (Advantage Workstation, GE Healthcare) and were quantified by an independent reader for FDG uptake in renal masses, the renal cortex, and background liver. To obtain standardized uptake values (SUVs), a volume of interest was placed to cover all slices where the renal tumors were present. CT and fused CT images were used to avoid inclusion of physiologic accumulation of FDG in the urinary tract in the renal mass and renal cortex volumes of interest. The maximum SUV (SUVmax), mean SUV (SUVmean), SUVmax kidney ratio (i.e., the ratio of the SUVmax of the lesion to that of the normal kidney cortex), SUVmean kidney ratio (i.e., the ratio of the SUVmean of the lesion to that of the normal kidney cortex), SUVmax liver ratio (i.e., the ratio of the SUVmax of the lesion to that of the normal liver), and SUVmean liver ratio (i.e., the ratio of the SUVmean of the lesion to that of the normal liver) of all renal masses were assessed. For each tumor, the oral contrast-enhanced CT features (e.g., size [longest axis diameter] and margins [well defined vs infiltrative]) and the presence of calcifications were also recorded.
Statistical Analysis
Patient characteristics and PET/CT features were summarized as frequency and percentage values, for categoric variables, and as median and range values, for continuous variables. The relationship between imaging features and histologic findings was assessed using the Wilcoxon rank sum test, for continuous parameters, and the Fisher exact test, for categoric parameters. Differences in SUVs were graphically modeled using box plots. A p < 0.05 was considered to denote statistical significance. All analyses were performed using statistical software (SAS software, version 9.4, The SAS Institute).
Results
Patient Characteristics
Thirty-six patients with a median age of 61 years (range, 36–87 years) were included in the study. No patients who fulfilled the inclusion criteria were excluded from analysis. Most of the patients (27/36 [75.0%]) were men. Fourteen patients were referred to undergo a baseline PET/CT examination, and 22 were referred to undergo a follow-up PET/CT examination. All renal masses evaluated at follow-up were either stable or had increased in size with respect to the size noted during the previous examination. Of the 36 lesions, 22 (61.1%) were RCCs and 14 (38.9%) were lymphomas. Fifteen of the 22 RCCs were clear cell RCCs, five were non–clear cell RCCs, and two were undifferentiated RCCs. Thirteen of the 14 lymphomas were B-cell lymphomas, and one was a Hodgkin lymphoma (Table 1).
TABLE 1.
Demographic and Clinical Characteristics of 36 Patients
| Characteristic | Value |
|---|---|
|
| |
| Age (y), median (range) | 61.4 (36.1–87) |
| Sex | |
| Male | 27 (75.0) |
| Female | 9 (25.0) |
| Histologic finding | |
| Lymphoma | 14 (38.9) |
| Subtype B cell | 13 (92.9) |
| Hodgkin lymphoma | 1 (7.1) |
| Renal cell carcinoma | 22 (61.1) |
| Non–clear cell | 5 (22.7) |
| Clear cell | 15 (68.2) |
| Undifferentiated | 2 (9.1) |
Note—Except where noted otherwise, data are no. (%) of patients.
FDG Uptake Metrics
All SUV metrics were statistically significantly higher for renal lymphomas than for RCCs (p < 0.0001, for all), with the following median values noted for each metric: SUVmax, 10.99 versus 2.91 g/mL; SUVmean, 7.10 versus 2.01 g/mL; SUVmean kidney ratio, 3.97 versus 1.19 g/mL; SUVmean liver ratio, 4.01 versus 0.85 g/mL; SUVmax kidney ratio, 6.05 versus 1.71 g/mL; and SUVmax liver ratio, 5.13 versus 0.93 g/mL (Table 2).
TABLE 2.
Metabolic Parameter Values for Lymphoma Versus Renal Cell Carcinomas (RCCs)
| Lymphoma Values | RCC Values | ||||
|---|---|---|---|---|---|
|
|
|||||
| Variable | Median | Range | Median | Range | p |
|
| |||||
| SUVmax of tumor (g/mL) | 10.99 | 5.98–26.39 | 2.91 | 1.78–5.26 | < 0.001 |
| SUVmean of tumor (g/mL) | 7.10 | 4.68–16.66 | 2.01 | 1.33–3.39 | < 0.001 |
| SUVmean ratio (g/mL) | |||||
| Tumor to normal kidney cortex | 3.97 | 1.97–8.95 | 1.19 | 0.68–2.26 | < 0.001 |
| Tumor to normal liver | 4.01 | 1.54–8.48 | 0.85 | 0.58–1.32 | < 0.001 |
| SUVmax ratio (g/mL) | |||||
| Tumor to normal kidney cortex | 6.05 | 2.46–14.24 | 1.71 | 0.7–2.92 | < 0.001 |
| Tumor to normal liver | 5.13 | 1.34–11.27 | 0.93 | 0.63–1.57 | < 0.001 |
| Mass size (mm) | 46 | 12–150 | 35 | 11–93 | 0.948 |
Note—Boldface type denotes statistically significant value. SUVmax, maximum standardized uptake value; SUVmean, mean standardized uptake value.
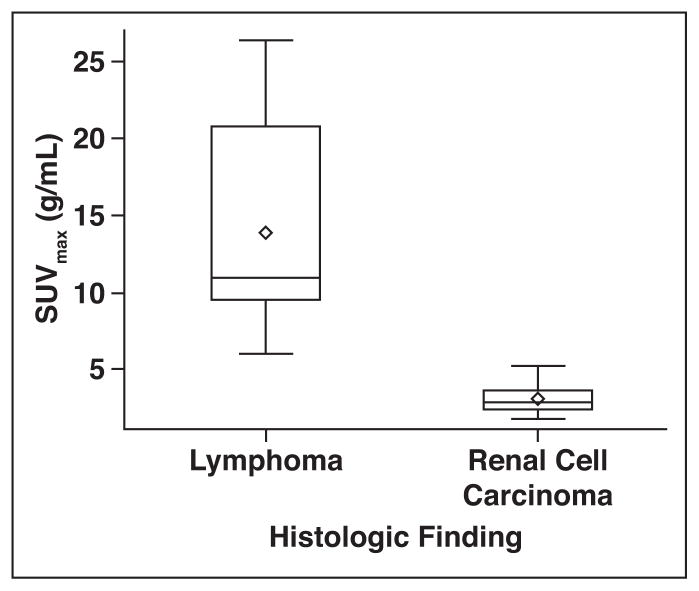
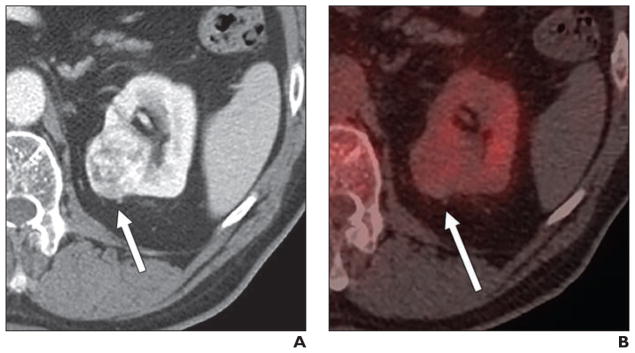
No overlap existed between the SUVmax of renal lymphomas and the SUVmax of RCCs. All 14 renal lymphomas had an SUVmax higher than 5.98 g/mL (median, 10.99 g/mL), whereas all 22 RCCs had an SUVmax lower than 5.26 g/mL (median, 2.91 g/mL) (Figs. 1–5). Similarly, all renal lymphomas had an SUVmean higher than 4.68 g/mL, whereas all RCCs had an SUVmean lower than 3.39 g/mL. These metrics perfectly differentiated RCCs from renal lymphomas.
Fig. 1.
Box-and-whisker plot of distribution of maximum standardized uptake values (SUVmax). Ends of box represent 25th and 75th percentiles. Center line and diamond represent median and mean, respectively. Interquartile Range (IQR) equals 75th minus 25th percentile. Ends of whiskers are at 1.5 times IQR. Values lying outside these boundaries are considered outliers.
Fig. 5.
57-year-old man with non-Hodgkin lymphoma and renal mass.
A, Unenhanced CT image shows 50-mm homogeneous renal mass (arrow).
B, Axial fused PET/CT image shows that lesion (arrow) is moderately avid (maximum standardized uptake value, 5.26 g/mL). Final diagnosis, as determined on basis of histologic findings, was papillary renal cell carcinoma.
CT Imaging Features
No statistically significant differences in mass size (p = 0.948) or margins (p = 0.307) were noted between RCCs and renal lymphomas. The median mass size was 46 mm (range, 12–150 mm) for renal lymphomas and 35 mm (range, 11–93 mm) for RCCs. Six of the 14 renal lymphomas (42.8%) and 14 of the 22 RCCs (63.6%) had well-defined margins. Calcifications were noted in zero lymphomas (0%) and two RCCs (9%); however, the presence of calcifications was too infrequent for formal comparisons.
Discussion
Our results indicate that PET/CT can assist in the characterization of solid renal masses in patients with lymphoma. All SUV metrics evaluated were statistically significantly different between both entities, with renal lymphomas having consistently higher SUVs than RCCs. Furthermore, the SUVmax and the SUVmean correctly differentiated renal lymphomas from RCCs; their distributions did not overlap.
To our knowledge, no studies have been published on the use of PET/CT to evaluate the cause of renal masses in patients with lymphoma. Few studies have compared the features of RCCs in patients without lymphoma to the features of renal involvement by lymphoma. Nakhoda et al. [12] evaluated the PET/CT features of 19 patients with 25 renal masses (18 RCCs, four metastases, and three lymphomas). They found that SUVs and lesion-to-background ratios were statistically higher for renal metastases than for the other histologic types, but they found no differences in these parameters when comparing the 18 RCCs and the three renal lymphomas. Ye et al. [13] did not find statistically significant differences in the SUVmax of 12 patients with renal involvement secondary to lymphoma and in 12 different patients without lymphoma but with renal cancer. However, they reported differences in the SUVmean between the 12 renal lymphomas and the subgroup of five clear cell RCCs, which were statistically significantly less FDG avid than were the lymphomas (SUVmean, 2.58 vs 6.37 g/mL) [13]. Most of the RCCs in the present study (15/22 [68.2%]) showed histologic findings of clear cell RCCs, with an SUVmax lower than 5.26 g/mL noted in all cases. The reported FDG avidity of RCCs is variable and depends not only on the subtype but also on the cell degree of differentiation, because high-grade RCC often shows increased FDG up- take [14, 15]; thus, an overlap between high-grade RCCs and lymphomas is conceivable. In the present study, all renal lymphomas were FDG avid, which is in line with previous observations [13, 16]; all renal lymphomas had an SUVmax higher than 5.98 g/mL.
Some researchers have proposed the use of SUV ratios to adjust for background tracer accumulation in PET/CT examinations [17, 18]. In our study, SUVs adjusted to background renal cortex and liver uptakes were also statistically significantly different between RCCs and renal lymphomas. Liver SUV ratios were higher than 4.00 for renal lymphomas (SUVmax ratio, 5.13; SUVmean ratio, 4.01), which reflects the avidity of renal lymphoma, whereas liver SUV ratios for RCCs were lower than 1.00 (SUVmax ratio, 0.93; SUVmean ratio, 0.85). However, the SUVmax and SUVmean showed complete separation in values and were equally able to assist in differentiation between RCCs and renal lymphomas, which suggests that the use of SUV ratios may not provide incremental value for the assessment of renal masses in this clinical context.
The possibility of differentiating between both entities with the use of PET/CT has important implications because an overlap of features exists when imaging modalities based on morphologic and enhancement features, such as CT and MRI, are used [19]. Most CT/MRI examinations performed for staging or follow-up of known or suspected lymphoma are mainly performed in the portal phase, when both lymphoma and RCC usually present as well-defined or infiltrating hypoenhancing lesions [4, 19]. Performing imaging at multiple time points after IV contrast administration may also help. Clear cell RCCs, which are the most common type of RCC, usually show hyperenhancement in the arterial phase on both CT and MRI [20, 21]. However, low-grade RCCs, such as papillary and chromophobe types, often show slow progressive enhancement without hyperenhancement in the arterial phase and may mimic renal lymphoma, which shows hypoenhancement in all phases [19, 22–24]. We did not evaluate the CT enhancement features because our PET/CT examinations were performed without iodinated IV contrast agents. We evaluated lesion size and margins (well defined vs ill defined) on oral contrast-enhanced CT and found no statistically significant differences in these features between renal lymphomas and RCCs. This finding is in line with other findings in the literature reporting the limited use of these morphologic features to differentiate between these two entities [22, 23].
Our study had several limitations. First, the study was performed retrospectively and had a relatively small sample size, primarily because renal lymphoma is not frequently encountered at the time of imaging. Second, we chose to include only patients who had undergone renal biopsy, to ensure a consistent and accurate standard of reference. We acknowledge that, in clinical practice, some patients with renal masses may receive treatment for their lymphoma without undergoing histologic assessment of the renal mass, particularly patients with high-grade lymphomas that require treatment without delay. In such cases, resolution of FDG uptake in the renal mass after lymphoma treatment may be considered indicative of lymphomatous involvement as the cause of the renal mass. Although including such patients would have increased our sample size, we thought that the multiple assumptions (e.g., assumptions that all renal lymphomas are FDG avid and that a decrease in FDG avidity after treatment occurs in renal lymphoma only) would introduce further bias in our study, and we therefore included only patients with biopsy-proven diagnoses. It is also worth noting that, in some lymphomas, such as the most common subtype of aggressive B-cell non-Hodgkin lymphoma (i.e., diffuse large B-cell lymphoma), the presence of renal involvement may significantly alter treatment. Renal involvement is considered one of the factors indicating worse prognosis, as is reflected by scores such as those based on the International Prognostic Index [25, 26]; thus, characterization of the renal mass is essential before treatment initiation.
Third, because of the retrospective nature of this study, all patients were not evaluated using the same PET/CT scanner. It is well known that differences in equipment and technical parameters (including count recovery and the reconstruction algorithm) vary between scanners and that these differences can influence SUV measurements. Despite this limitation, all PET/CT examinations in the present study were acquired using similar technical parameters (e.g., injected FDG dose, uptake period, blood glucose measurement, and other parameters), and the patients were randomly distributed to undergo examinations performed using the different scanners. Although this supports the general concept of renal lymphomas having more intense uptake than RCCs, establishing absolute SUV thresholds for diagnosis is not recommended.
Fourth, the ROIs were placed by a single reader, which potentially led to measurement errors, and we did not evaluate the intra- and interobserver variability in these measurements. Fifth, there is inherent difficulty in using PET/CT to evaluate renal masses because of the presence of radiotracer within the excretory tract. However, evaluation of CT and fused PET/CT images was used to differentiate physiologic and tumoral sites of FDG uptake. Finally, we did not evaluate enhancement behavior of the masses on CT images because no iodinated IV contrast agent was administered for the PET/CT examinations.
In conclusion, for patients with lymphoma and renal masses, PET/CT showed that the distribution of FDG uptake in RCCs allowed differentiation of these masses from renal lymphomatous involvement. Larger prospective studies should further confirm the SUV boundaries between RCCs and renal lymphomas. In addition, the detection of a non-avid mass should lead to recommendation for biopsy because of the probability of RCC.
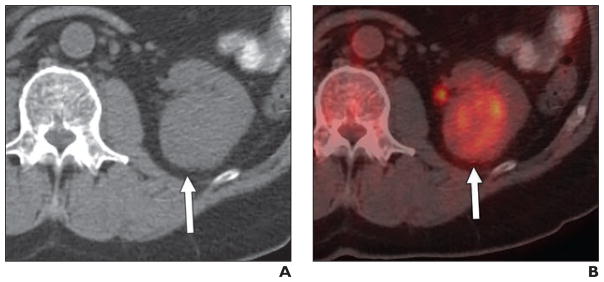
Fig. 2.
52-year-old man with non-Hodgkin lymphoma and renal mass.
A, Contemporaneous portal venous phase CT scan shows left kidney mass (arrow).
B, Axial fused PET/CT image shows lesion (arrow) that is markedly FDG avid (maximum standardized uptake value, 12.00 g/mL). Renal involvement secondary to non-Hodgkin lymphoma was histologically proven.
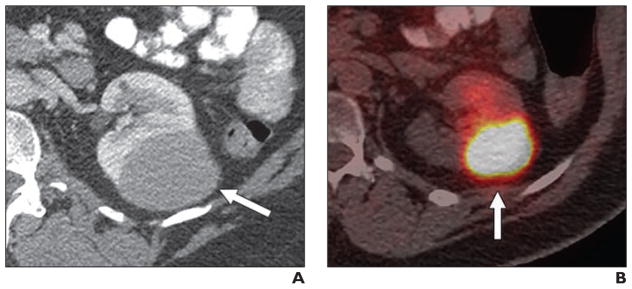
Fig. 3.
42-year-old woman with Hodgkin lymphoma and renal mass.
A, Contemporaneous portal venous phase CT scan shows right cortical mass (arrow).
B, Axial fused PET/CT image shows that lesion (arrow) is markedly FDG avid (maximum standardized uptake value, 10.32 g/mL). Renal Hodgkin lymphoma was histologically proven.
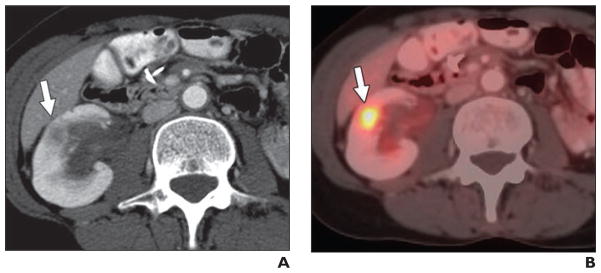
Fig. 4.
66-year-old man with non-Hodgkin lymphoma and renal mass.
A, Contemporaneous IV contrast-enhanced CT scan shows right cortical mass (arrow).
B, Axial fused PET/CT image shows lesion (arrow) that is not FDG avid (maximum standardized uptake value, 2.68 g/mL). Clear cell renal cell carcinoma was diagnosed on basis of histologic findings.
Acknowledgments
Supported by NIH grant P30 CA008748.
References
- 1.Poitou-Verkinder AL, Francois A, Drieux F, et al. The spectrum of kidney pathology in B-cell chronic lymphocytic leukemia / small lymphocytic lymphoma: a 25-year multicenter experience. PLoS One. 2015;10:e0119156. doi: 10.1371/journal.pone.0119156. [DOI] [PMC free article] [PubMed] [Google Scholar]
- 2.El-Sharkawy MS, Siddiqui N, Aleem A, Al Diab A. Renal involvement in lymphoma: prevalence and various patterns of involvement on abdominal CT. Int Urol Nephrol. 2007;39:929–933. doi: 10.1007/s11255-007-9224-8. [DOI] [PubMed] [Google Scholar]
- 3.Chua SC, Rozalli FI, O’Connor SR. Imaging features of primary extranodal lymphomas. Clin Radiol. 2009;64:574–588. doi: 10.1016/j.crad.2008.11.001. [DOI] [PubMed] [Google Scholar]
- 4.Sheth S, Ali S, Fishman E. Imaging of renal lymphoma: patterns of disease with pathologic correlation. RadioGraphics. 2006;26:1151–1168. doi: 10.1148/rg.264055125. [DOI] [PubMed] [Google Scholar]
- 5.Kunthur A, Wiernik PH, Dutcher JP. Renal parenchymal tumors and lymphoma in the same patient: case series and review of the literature. Am J Hematol. 2006;81:271–280. doi: 10.1002/ajh.20533. [DOI] [PubMed] [Google Scholar]
- 6.Lossos C, Ferrell A, Duncan R, Lossos IS. Association between non-Hodgkin lymphoma and renal cell carcinoma. Leuk Lymphoma. 2011;52:2254–2261. doi: 10.3109/10428194.2011.603443. [DOI] [PubMed] [Google Scholar]
- 7.Ljungberg B, Bensalah K, Bex A, et al. Guidelines on renal cell carcinoma. European Association of Urology website. [Accessed January 1, 2016]; uroweb.org/wp-content/uploads/EAU-Guidelines-Renal-Cell-Cancer-2015-v2.pdf Published 2016.
- 8.Johnson SA, Kumar A, Matasar MJ, Schöder H, Rademaker J. Imaging for staging and response assessment in lymphoma. Radiology. 2015;276:323–338. doi: 10.1148/radiol.2015142088. [DOI] [PubMed] [Google Scholar]
- 9.Barrington SF, Mikhaeel NG, Kostakoglu L, et al. Role of imaging in the staging and response assessment of lymphoma: consensus of the International Conference on Malignant Lymphomas Imaging Working Group. J Clin Oncol. 2014;32:3048–3058. doi: 10.1200/JCO.2013.53.5229. Erratum in J Clin Oncol 2016;34:25612. [DOI] [PMC free article] [PubMed] [Google Scholar]
- 10.Zukotynski K, Lewis A, O’Regan K, et al. PET/CT and renal pathology: a blind spot for radiologists? Part 2. Lymphoma, leukemia, and metastatic disease. AJR. 2012;199:W168–W174. doi: 10.2214/AJR.11.7923. [web] [DOI] [PubMed] [Google Scholar]
- 11.Silverman SG, Israel GM, Herts BR, Richie JP. Management of the incidental renal mass. Radiology. 2008;249:16–31. doi: 10.1148/radiol.2491070783. [DOI] [PubMed] [Google Scholar]
- 12.Nakhoda Z, Torigian DA, Saboury B, Hofheinz F, Alavi A. Assessment of the diagnostic performance of 18F-FDG-PET/CT for detection and characterization of solid renal malignancies. Hell J Nucl Med. 2013;16:19–24. doi: 10.1967/s002449910067. [DOI] [PubMed] [Google Scholar]
- 13.Ye XH, Chen LH, Wu HB, et al. 18F-FDG PET/CT evaluation of lymphoma with renal involvement: comparison with renal carcinoma. South Med J. 2010;103:642–649. doi: 10.1097/SMJ.0b013e3181e23cb0. [DOI] [PubMed] [Google Scholar]
- 14.Zukotynski K, Lewis A, O’Regan K, et al. PET/CT and renal pathology: a blind spot for radiologists? Part 1. Primary pathology. AJR. 2012;199:W163–W167. doi: 10.2214/AJR.11.7790. [web] [DOI] [PubMed] [Google Scholar]
- 15.Takahashi M, Kume H, Koyama K, et al. Preoperative evaluation of renal cell carcinoma by using 18F-FDG PET/CT. Clin Nucl Med. 2015;40:936–940. doi: 10.1097/RLU.0000000000000875. [DOI] [PMC free article] [PubMed] [Google Scholar]
- 16.Kaneta T, Hakamatsuka T, Yamada T, et al. FDG PET in solitary metastastic/secondary tumor of the kidney: a report of three cases and a review of the relevant literature. Ann Nucl Med. 2006;20:79–82. doi: 10.1007/BF02985596. [DOI] [PubMed] [Google Scholar]
- 17.Burger IA, Vargas HA, Beattie BJ, et al. How to assess background activity: introducing a histogram-based analysis as a first step for accurate one-step PET quantification. Nucl Med Commun. 2014;35:316–324. doi: 10.1097/MNM.0000000000000045. [DOI] [PubMed] [Google Scholar]
- 18.Keramida G, Dizdarevic S, Bush J, Peters AM. Quantification of tumour 18F-FDG uptake: nor-malise to blood glucose or scale to liver uptake? Eur Radiol. 2015;25:2701–2708. doi: 10.1007/s00330-015-3659-6. [DOI] [PubMed] [Google Scholar]
- 19.Ganeshan D, Iyer R, Devine C, Bhosale P, Paulson E. Imaging of primary and secondary renal lymphoma. AJR. 2013;201:W712–W719. doi: 10.2214/AJR.13.10669. [web] [DOI] [PubMed] [Google Scholar]
- 20.Young JR, Margolis D, Sauk S, Pantuck AJ, Sayre J, Raman SS. Clear cell renal cell carcinoma: discrimination from other renal cell carcinoma subtypes and oncocytoma at multiphasic multidetector CT. Radiology. 2013;267:444–453. doi: 10.1148/radiol.13112617. [DOI] [PubMed] [Google Scholar]
- 21.Vargas HA, Chaim J, Lefkowitz RA, et al. Renal cortical tumors: use of multiphasic contrast-enhanced MR imaging to differentiate benign and malignant histologic subtypes. Radiology. 2012;264:779–788. doi: 10.1148/radiol.12110746. [DOI] [PMC free article] [PubMed] [Google Scholar]
- 22.Nicolau C, Aldecoa I, Bunesch L, Mallofre C, Sebastia C. The role of contrast agents in the diagnosis of renal diseases. Curr Probl Diagn Radiol. 2015;44:346–359. doi: 10.1067/j.cpradiol.2015.02.001. [DOI] [PubMed] [Google Scholar]
- 23.Dyer R, DiSantis DJ, McClennan BL. Simplified imaging approach for evaluation of the solid renal mass in adults. Radiology. 2008;247:331–343. doi: 10.1148/radiol.2472061846. [DOI] [PubMed] [Google Scholar]
- 24.Lee-Felker SA, Felker ER, Tan N, et al. Qualitative and quantitative MDCT features for differentiating clear cell renal cell carcinoma from other solid renal cortical masses. AJR. 2014;203:W516–W524. doi: 10.2214/AJR.14.12460. [web] [DOI] [PubMed] [Google Scholar]
- 25.Zhou Z, Sehn LH, Rademaker AW, et al. An enhanced International Prognostic Index (NCCN-IPI) for patients with diffuse large B-cell lymphoma treated in the rituximab era. Blood. 2014;123:837–842. doi: 10.1182/blood-2013-09-524108. [DOI] [PMC free article] [PubMed] [Google Scholar]
- 26.Sehn LH, Berry B, Chhanabhai M, et al. The revised International Prognostic Index (R-IPI) is a better predictor of outcome than the standard IPI for patients with diffuse large B-cell lymphoma treated with R-CHOP. Blood. 2007;109:1857–1861. doi: 10.1182/blood-2006-08-038257. [DOI] [PubMed] [Google Scholar]


