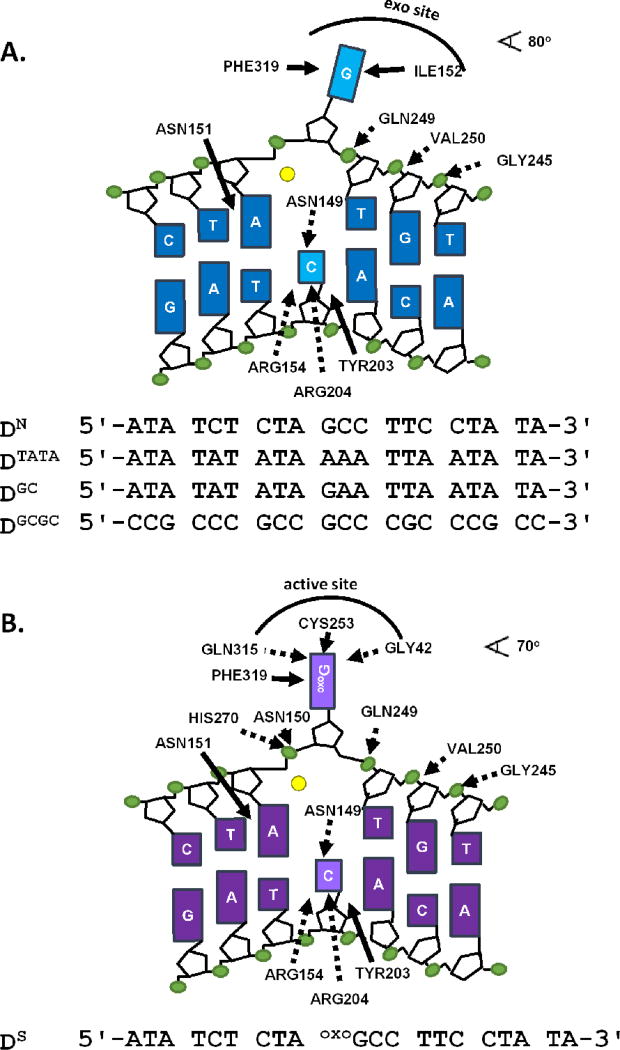
Figure 1.
Schematics of undamaged and damaged DNA bound to hOGG1. (A) Depiction of electrostatic (dashed lines) and non-electrostatic (solid lines) contacts between undamaged DNA and WT hOGG1 (Protein Data Bank entry 1YQK26). The top strands of all undamaged DNA sequences used in this studied are listed. A fluorescein label (not shown) is attached to the 5’ end of each strand. Full sequences are listed in Supplemental Methods. (B) Schematic of electrostatic (dashed arrows) and the non-electrostatic (solid arrows) interactions between hOGG1 and specific DNA (Protein Data Bank entry 1EMH27. The top strand of the specific DNA sequence used in this study is shown. A 5’ fluorescein label was attached to the complimentary strand (not shown, see Supplemental Methods). Electrostatic interactions are defined by nitrogen and oxygen atoms of the enzyme within 3.3 Å of DNA phosphate oxygens or heteroatoms on the bases, while non-electrostatic interactions are defined as any enzyme carbon atom within 3.9 Å of a DNA carbon. Hydrogen bonds with the cytosine on the complementary strand are not expected to result in ion displacement. The yellow circles represent a potassium ion, which is likely to be bound in place of the Ca2+ ion observed in crystal structures of both the damaged and undamaged DNA complexes.

