Abstract
Some pathogenesis-related genes are expressed in fungi only when the pathogen is in the host, but the host signals that trigger these gene expressions have not been identified. Virulent Nectria haematococca infects pea plants and requires either pelA, which is induced by pectin, or pelD, which is induced only in planta. However, the host signal(s) that trigger pelD expression was unknown. Here we report the isolation of the host signals and identify homoserine and asparagine, two free amino acids found in uniquely high levels in pea seedlings, as the pelD-inducing signals. N. haematococca has evolved a mechanism to sense the host tissue environment by using the high levels of two free amino acids in this plant, thereby triggering the expression of pelD to assist the pathogenic process.
Keywords: fungal infection, pectate lyase, Pisum sativum, host–pathogen interactions, pathogen–host coevolution
Understanding the molecular events involved in host–pathogen interactions could help devise new ways to intervene in the infection process and thus help protect the host. In the case of fungal pathogens, communication between the plant host and the fungal spore starts as soon as the two contact each other (1, 2). Both physical and chemical signals have been shown to be involved in the early phases of this interaction (1–3), causing mutual triggering of gene expression. Many of the fungal and host genes whose expression is induced by such signals have been identified (2, 4–6). Because identification of the fungal genes that are essential for pathogenesis may suggest new targets for antifungal approaches, such genes have been sought in many host–pathogen systems (2, 7). Studies with axenic cultures involved expression of fungal genes induced by host contact or by substrates of fungal enzymes suspected to be involved in pathogenesis. Some of the fungal genes involved in pathogenesis may be expressed only in planta. However, such genes have been more difficult to identify. For example, the Ustilago maydis mig1 gene is not expressed during growth in the yeast form and is only weakly expressed during filamentous growth in axenic culture. Upon fungal penetration of the host tissue, expression of this gene is dramatically up-regulated (8). Another gene cluster, mig2-1, was recently found to have a plant-specific expression profile (9). Even when the genes have been identified, the host signals that trigger the expression of such genes remain unidentified.
Nectria haematococca uses pectate lyase to invade its host as indicated by the finding that antibodies against the lyase(s) protect the host (10). Disruption of a pectin-inducible pel gene (pelA) did not reduce virulence because another gene, pelD, which is induced in planta, could substitute. Disruption of both pelA and pelD drastically reduced virulence (11). Neither pectin nor any other substrate tested caused induction of pelD. The host signals that induce either pelD or other fungal genes that are induced only in planta have not been identified. Here we report isolation of the pelD-inducing components from pea seedlings and identify them as homoserine and asparagine, both of which are known to be present in high levels in the host (12, 13). The pathogen seems to have evolved a mechanism to sense the host tissue environment by the presence of uniquely high levels of these simple amino acids present in the host at the time of infection.
Materials and Methods
Materials. 5-Bromo-4-chloro-3-indolyl β-d-glucuronide [cyclohexylammonium salt (X-Gluc)] was purchased from Gold Biotechnology (St. Louis). Oligonucleotide primers were synthesized by Integrated DNA Technologies (Coralville, IA). Restriction and modification enzymes were from Invitrogen. Cultures of N. haematococca field isolate T8 were maintained on potato dextrose agar containing 0.1% finely ground pea stem for conidia isolation, or grown in liquid culture to produce mycelia for transformation, or for isolation of genomic DNA (14). Plasmids were propagated in Escherichia coli DH5α.
Construction of Transformation Vector and N. haematococca Transformation. A 1.2-kb fragment from the 5′ flanking region of pelD was amplified by PCR by using the plasmid DNA of PX55, the pelD genomic clone (15), as template with a sense primer, 5′-GGG TGA TCA CAG TCA AGA CCG GAC GA-3′, and an antisense primer, 5′-GGG TGA TCA TGC ATG TTG GCG GTT GT-3′, by using Pfu DNA polymerase (Stratagene). The purified 1.2-kb DNA product was digested with BclI and cloned into the β-glucuronidase (GUS) expression fragment purified from a BamHI digestion of the pelA/GUS expression construct (16). The resulting pelD promoter/GUS expression construct, pelD/GUS, was used to transform N. haematococca protoplasts as described (14), and transformants were selected on media containing 300 μg/ml hygromycin B (Calbiochem) (16). Construct integration was analyzed by genomic Southern blot analysis (14) by using EcoRI-digested DNA and an 800-bp fragment of the GUS gene as the probe.
Isolation of the pelD-Inducing Material from Pea Seedlings. Etiolated peas (Pisum sativum, variety Extra Early Alaska; Livingston Seed Co., Columbus, OH) were grown as described (17). After delipidation with CHCl3/methanol (2:1 vol/vol), pea seedling stem sections were air-dried and powdered by using a Wiley mill. The powder was homogenized in water (6 g/120 ml) with a Polytron homogenizer (Brinkmann), finely ground with a Ten-Broeck glass homogenizer (Fisher), and centrifuged at 20,000 × g for 20 min at 4°C. The supernatant was centrifuged at 105,000 × g for 1 h at 4°C, lyophilized, and then dissolved in and dialyzed against water in 1-kDa molecular weight cutoff (MWCO) dialysis tubing (Spectrapor, Fisher). The retained material was lyophilized, redissolved (material from 6 g of stem powder/7–8 ml of H2O), and dialyzed against water with 2-kDa MWCO dialysis tubing. The material passing through the 2-kDa MWCO dialysis tubing was lyophilized and is called the crude pelD inducer. The material retained by this tubing was also recovered to be used as a fungal growth inducer.
Chromatographic Separations. The crude pelD inducer, dissolved in H2O (20–25 mg/ml) and filtered (0.2 μm), was applied to a Superdex 30 (Amersham Pharmacia) FPLC gel filtration column (1.6 × 53 cm) and eluted with water (1 ml/min). Fractions (2 min) were lyophilized and assayed for pelD-promoter-inducing activity. The pooled pelD-inducing fractions were subjected to a Sephadex LH-20 (Amersham Pharmacia) gel filtration (1.9 × 73-cm column) in water (1.5 ml/min). The fractions (1.5 ml) with pelD-inducing activity were pooled and subjected to TLC on 0.5-mm-thick cellulose layers (SigmaCell, type 101, Sigma; activated at 105°C for 10 min) with 1-butanol/acetic acid/water (12:3:5 vol/vol/vol) as the solvent (18). Ninhydrin reagent was used on air-dried plates (19). Cellulose from the different areas of the TLC plate was scraped off, eluted with water, and assayed for pelD/GUS-inducing activity. The two pelD-inducing fractions were designated inducer 1 and inducer 2.
Inducer 1 was further purified by three sequential TLCs, and each time a very narrow band of cellulose was selected for elution with 100% ethanol. Inducer 2 was purified by gel filtration on a Bio-Gel P-2 (Bio-Rad) column (2.0 × 73 cm) in water (0.5 ml/min, 1.5-ml fractions). Initially comparisons were based on the original amount of dried tissue extracted. At the final stages of purification, the inducer preparations were quantified by reaction with ninhydrin (20), using homoserine or asparagine as standard.
Assay for pelD-Promoter-Inducing Activity. Conidia from 6- to 10- day-old potato dextrose agar cultures of the N. haematococca (pelD promoter–GUS fusion) transformants were harvested in water under sterile conditions and quantitated by hemocytometer.
To test for inducible expression of GUS activity by intact tissue, 3- to 5-cm segments of etiolated pea epicotyls were placed on moist filter paper in 100-mm-diameter Petri dishes, 5 ml of a conidial suspension in water (1 × 10⁸/ml) was added, and the cultures were incubated at 24°C in the dark with high humidity. The tissue segments were finely ground in liquid nitrogen in a mortar and pestle, and the powder was homogenized for 2 min in GUS assay buffer (1× buffer: 50 mM sodium phosphate buffer, pH 7.0, containing 10 mM 2-mercaptoethanol/10 mM EDTA/0.1% sodium lauryl sarcosine/0.1% Triton X-100) in a 2-ml screw-cap microfuge tube with two 4-mm metal beads, by using a MiniBead-beater (Biospec Products, Bartlesville, OK). The homogenate was centrifuged for 20 min at 16,000 × g at 4°C, and the supernatant was used for protein determination (Bio-Rad Protein Assay) and GUS assay (21).
To test for induction of GUS expression by fractions from pea extracts during purification of the inducing factor, conidia (2 × 10⁷) were incubated at 24°C for 48 h in a medium containing 2% pectin (pectin, esterified, potassium salt; Sigma), 1 mM CaCl2, and 2 mg of the crude inducer or of the inducer fractions or pure compounds to be tested, in a total volume of 0.8 ml in 35-mm Petri dishes. The levels of pectin and CaCl2 used were experimentally determined to be optimal for the pelD inducer activity (data not shown). After incubation, the entire culture (0.8 ml) with 0.4 ml of 3× GUS assay buffer (above) was homogenized and centrifuged as described for the whole tissue. Aliquots of the supernatant were assayed for GUS activity (21). Two independent transformants gave identical results.
Asparaginase Treatment of Inducer 1. Purified inducer 1 (0.18 μmol of asparagine equivalent in 400 μl of water) was mixed with 2 units of asparaginase (Sigma). After incubation at 37°C for 1 h, the mixture was heated at 70°C for 4 min to denature the enzyme (22) and then fractionated by TLC as described above. The eluted fractions were assayed for pelD-inducing activity.
Dansylation Analysis. Aliquots of the purified inducer 1, inducer 2, and authentic amino acids were dansylated as described (23). The dansylated sample was applied to polyamide sheets (Macherey & Nagel) for 2D TLC with water/pyridine/formic acid (93:3.5:3.5 vol/vol/vol) for the first dimension and benzene/acetic acid (9:2 vol/vol) for the second dimension (24). The dansyl amino acids were visualized under UV light.
NMR Spectroscopy. NMR experiments were carried out by using a Bruker (Billerica., MA) DRX600 spectrometer operating at an ambient temperature. 1H-1H and 1H-13C 2D experiments were performed, including COSY, heteronuclear single quantum coherence (HSQC), and heteronuclear multiple bond correlation (25).
Mass Spectrometry. The MALDI-TOF experiments were carried out on a TofSpec 2E MALDI-TOF mass spectrometer (Micromass, Manchester, U.K.) by using the matrix α-cyano-4-hydroxy cinnamic acid. Each sample was also analyzed by capillary column liquid chromotography–tandem mass spectrometry by using a Finnigan LCQ Deca ion trap system (Thermo Electron, Boston) with a 50 μm i.d. × 6 cm C18 column, eluted with a linear gradient from 2% to 70% acetonitrile in 50 mM acetic acid.
Histology Staining. A suspension of the N. haematococca transformant (106 conidia/4 μl) was placed on sections of pea epicotyl from dark-grown seedlings (17) and incubated 3–4 days at 24°C in the dark (26). The stems were hand-sectioned through the site of infection and activity-stained for GUS activity by using 5-bromo-4-chloro-3-indolyl β-d-glucuronide (cyclohexylammonium salt) (27), with the addition of 1 mM K3Fe6 to the substrate solution, or stained for the presence of mycelia by using acid fuchsin in lactophenol (28).
Amino Acid Analysis. Free amino acid analysis was done at the Bioanalytical Laboratory, Washington State University, Pullman, and at the Protein Chemistry Core Facility, University of Florida, Gainesville.
Results
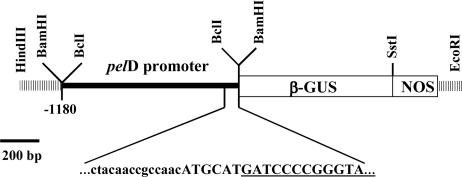
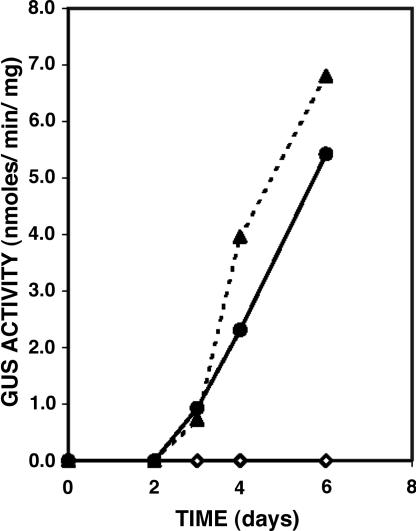
The fact that some fungal pathogenesis genes are expressed only in the host has been established for some time; however, the host signals that trigger the expression of such genes in planta have not been identified. We developed a reporter gene expression assay to search for the host components that induce pelD expression in planta. A 1.2-kb fragment from the 5′ flanking region of pelD was fused to the GUS gene, yielding pelD/GUS (Fig. 1). N. haematococca was transformed with this construct. Ten randomly selected transformants expressed GUS during infection of pea epicotyls. That the GUS induction observed was not caused by any specific site of insertion of the pelD promoter into the fungal genome was shown by Southern analyses of all 10 transformants that indicated different sites of insertion (data not shown). GUS activity could be detected as early as 72 h after pea epicotyls were inoculated with the transformants, and there was a steady increase in GUS activity with longer infection time (Fig. 2). Growth of the transformants on pectin did not induce GUS activity.
Fig. 1.
The pelD promoter–GUS fusion construct used for N. haematococca transformation. The nucleotide sequence spanning the translational fusion of the pectate lyase gene to the GUS gene is shown, with the sequence of the GUS gene underlined.
Fig. 2.
Time course of the appearance of GUS activity during growth of N. haematococca wild type (⋄) and two pelD/GUS transformants (• and ▴) on pea epicotyl segments. Experimental conditions are described in the text.
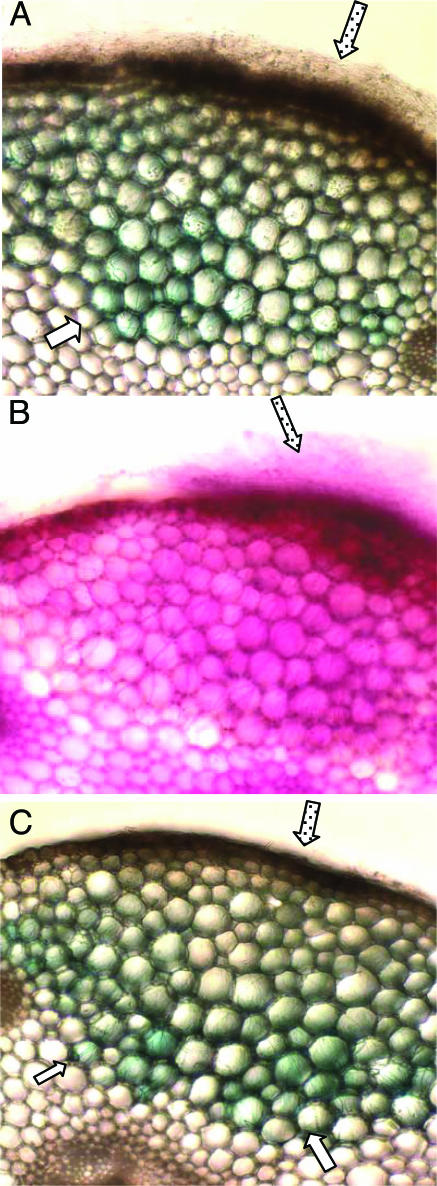
To determine the in planta location of expression of pelD, segments of pea epicotyl were inoculated with a suspension of the pelD/GUS transformant. Activity staining of tissue sections cut through the infected area revealed GUS activity associated with the fungal mycelia only inside the pea tissue; mycelia growing on the host surface showed no GUS staining (Fig. 3A), whereas acid fuchsin stained the mycelia both inside and outside the host (Fig. 3B). This result showed that pelD expression by the fungus occurs only when the pathogen is inside the host environment. GUS activity was predominantly associated with the infection front; in sections showing deep mycelial penetration, often only the mycelia in the 3- to 5-host-cell layers at the leading edge of the infection were expressing GUS (Fig. 3 A and C), suggesting that pelD expression is associated with the fungal invasion front. Thus, GUS expression by the transformant is an appropriate assay for the in planta pelD-inducing activity.
Fig. 3.
Localization of GUS expression in cross sections of pea epicotyl infected with the pelD/GUS N. haematococca transformant. The infected tissue was sectioned through the site of infection and activity-stained for the presence of expressed GUS (A and C) or stained with acid fuchsin for the presence of mycelia (B) as described in the text. Open arrow, fungal mycelia, inside the pea tissue, expressing GUS (A and C); stippled arrow, fungal mycelia external to the pea tissue (A–C).
When the transformant was grown in culture, an aqueous homogenate of delipidated pea stem induced GUS activity, whereas the lipids showed no GUS induction. Pectin or pectin oligomers did not induce GUS expression in the in vitro assay, but inclusion of pectin with the inducer in the assay increased the induction caused by pea homogenate. The pelD-inducing activity was found to be localized mainly in the 105,000 × g supernatant (data not shown). The pelD-inducing material was retained by 1-kDa MWCO dialysis tubing but passed through 2-kDa MWCO dialysis tubing, yielding the crude pelD inducer preparation. The material retained in the 2-kDa MWCO dialysis tubing showed fungal growth-enhancing activity but no pelD-inducing activity. Therefore, we included this material in routine assays so that pelD induction would not be limited by the lack of growth of the fungus. GUS induction by the crude inducer was found to be optimal with 2% pectin and 1 mΜ CaCl2 (data not shown).
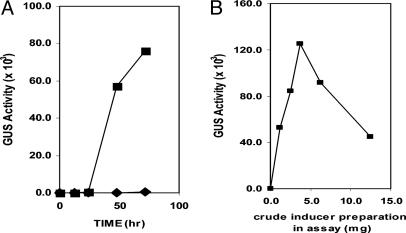
Time course of induction by using the crude pelD inducer showed detectable activity after 24 h, with the induction level increasing at 48 and 72 h (Fig. 4A). Inclusion of the material retained in the 2-kDa MWCO tubing as growth enhancer did not shorten the 24-h lag in GUS expression. In a previous study (15), pelD expression could be detected by RT-PCR at 24 h and longer but not at 12 h. Increasing amounts of the crude pelD inducer showed increasing induction of GUS expression up to ≈3–4 mg/ml in the assay; greater amounts were inhibitory (Fig. 4B). Inclusion of the material retained in the 2-kDa MWCO tubing did not change this induction pattern. The crude pelD inducer was found to be heat stable and contained ninhydrin-reacting material (19).
Fig. 4.
Time-course and inducer concentration on pelD promoter-driven GUS expression. (A) Time course of expression of pelD-promoter-driven GUS. pelD/GUS transformant (2 × 10⁷ spores) was grown without (♦) or with (▪) crude pelD inducer (3 mg). (B) Effect of increasing concentration of the crude pelD inducer on pelD-promoter-driven expression of GUS. Experimental details are given in the text. GUS activity is in arbitrary fluorescence units.
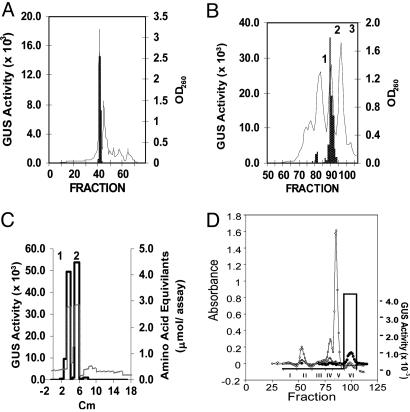
When the crude pelD inducer was subjected to gel filtration FPLC on Superdex 30 in water, the pelD-inducing activity eluted in a single sharp peak at ≈90% of the bed volume (Fig. 5A). Cellulose TLC of the active fractions from FPLC showed many bands of autofluorescing material that were also reactive with ninhydrin (19). A pelD induction assay of the TLC fractions showed that the two most active fractions, inducer 1 and inducer 2, were coincident with two of the major ninhydrin-positive bands (data not shown).
Fig. 5.
Chromatographic isolation of pelD inducers. Purification of the pelD-inducing components in the crude pelD inducer preparation by FPLC-gel filtration of Superdex 30 in water (A), followed by gel filtration on LH20 in water (B), and TLC on cellulose in 1-butanol/glacial acetic acid/water (C). (D) Gel filtration of peak 2 from the TLC separation (C) on Bio-Gel P2 in water. Experimental details of chromatographic separations and GUS-induction assay are in the text. In A and B, absorbance at 260 nm is shown as a solid line, and GUS activity is shown as stippled columns. In C, the solid line is GUS activity, and the dashed line is amino acid content. In D, the left y axis is absorbance at 210 (○) and 260 (⋄) nm, and ninhydrin reaction (20) at 570 nm (•), and the GUS activity (right y axis) is shown by the bar graph for each pooled fraction identified by Roman numerals. GUS activity is in arbitrary fluorescence units.
Sephadex LH-20 gel filtration of the pelD-inducing fractions from the FPLC step showed three 260-nm-absorbing fractions. pelD-inducing activity was associated mainly with the second major peak (Fig. 5B). TLC of this material yielded two ninhydrin-reactive components that had the same Rf values as inducer 1 and inducer 2 found in the TLC separation of the FPLC preparation. Both components had pelD-inducing activity (Fig. 5C).
Purification and Identification of Inducer 1. This material recovered from TLC was refractionated by TLC on cellulose with the same solvent system. A single ninhydrin-reactive band corresponding to the pelD-inducing activity was obtained upon repeated TLC.
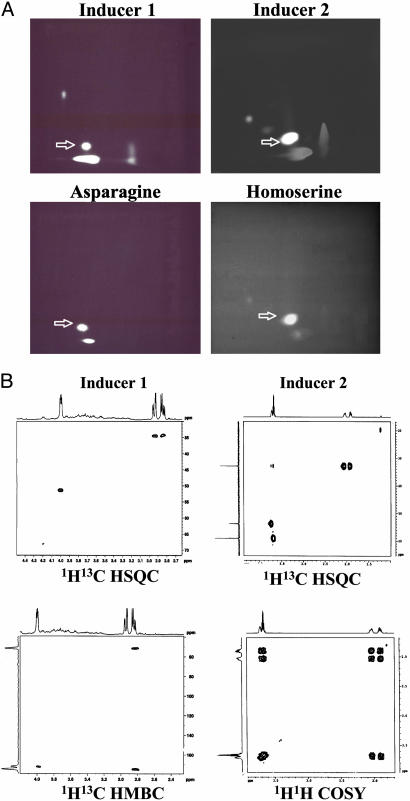
The purified fraction was found to be asparagine by NMR analysis, based on the comparison of its 1H and 13C shifts with those of the authentic asparagine (Table 1). This conclusion was confirmed by 1H-13C-correlated 2D NMR experiments (Fig. 6B Left). Dansylated pelD-inducer 1 migrated to the same position as authentic dansylated asparagine when subjected to 2D TLC (Fig. 6 A Left); chromatography of a mixture of dansyl-asparagine and dansyl-inducer 1 gave a single fluorescent spot (Rf = 0.1 in the second dimension) (data not shown). Confirming these results, the biological activity of pelD-inducer 1 corresponded to that of asparagine when equivalent amounts, based on amino group content, were assayed (Table 2). To confirm that asparagine was the biologically active material in this fraction, a sample of inducer 1 was treated with asparaginase. The enzyme treatment resulted in the loss of most (80%) of the pelD-inducing activity (Table 2).
Table 1. Chemical shift (ppm) of the signals from the 1H and 13C NMR spectra.
|
1H/13C
|
||||||
|---|---|---|---|---|---|---|
| αC |
αCH | βCH2 | γC |
γNH2 | γCH2 | |
| pe/D inducer 1 10% H2O in 2H2O and authentic asparagine in water | ||||||
| pe/D inducer 1 | 4.05 | 2.87, 2.95 | 7.60, 6.89 | |||
| 173.3 | 51.3 | 34.5 | 174.4 | |||
| Asparagine | 3.91 | 2.75, 2.85 | 7.53, 6.81 | |||
| pe/D inducer 2 in 2H2O | ||||||
| 1H | 3.71 | 1.97 | 3.67 | |||
| 13C | 175.4 | 53.8 | 32.9 | 59.1 | ||
Fig. 6.
Identification of pelD inducers. (A) Dansylation analysis of pelD inducer 1, authentic asparagine, inducer 2, and authentic homoserine. Purified inducers 1 and 2, asparagine, and homoserine were dansylated as described in the text. (B Left) 1H-13C HSQC and heteronuclear multiple bond correlation spectra of pelD inducer 1 in 2H2O at 600 MHz showing crosspeaks from –CH and –CH2, between –CH and –COOH, and between –CH2 and –CONH2.(B Right) 1H-1H COSY and HSQC spectra of the pelD inducer 2 in 2H2O at 600 MHz showing crosspeaks between the protons of –βCH2 and –αCH, as well as –γCH2 (Lower), and between the carbon atoms and protons in –αCH, –βCH2, and –γCH2 (Upper).
Table 2. Comparison of the GUS induction activity of pe/D inducer 1 with the authentic asparagine and the effect of asparaginase treatment on the biological activity of inducer 1.
| Inducer | GUS activity* |
|---|---|
| pe/D inducer 1† | 9,320 |
| l-asparagine | |
| 0.22 mM | 3,581 |
| 0.44 mM | 9,290 |
| 0.88 mM | 23,031 |
| Inducer 1 before asparaginase treatment | 23,639 |
| Inducer 1 after asparaginase treatment | 6,272 |
Arbitrary fluorescence units.
Concentration of inducer 1 was 0.44 mM asparagine equivalents as determined by ninhydrin reaction (20).
Purification and Identification of Inducer 2. When the inducer 2 fraction recovered from TLC was subjected to gel filtration on Biogel P-2 in water, the fraction containing a relatively large amount of ninhydrin-reactive material, but little UV absorbance, showed the pelD-inducing activity (Fig. 5D).
Because a consistent feature of inducer 2 is ninhydrin reactivity, the purified inducer 2 was analyzed by dansylation and 2D TLC. Comparison of dansyl-inducer 2 with dansyl-homoserine showed that the two compounds had identical mobility in the solvent systems used (Fig. 6A Right). When authentic homoserine was subjected to 1D TLC on cellulose, it had the same Rf as inducer 2 (data not shown). 1H and 13C NMR spectroscopy confirmed the identity of inducer 2 as homoserine (Table 1 and Fig. 6B Right). Mass spectrometry of inducer 2 and its dansyl derivative gave molecular ions at m/z of 119.9 and 353.1, respectively, as expected from homoserine and dansyl-homoserine. The collisionally induced dissociation spectrum of dansyl-inducer 2 showed the cleavage pattern expected from dansyl-homoserine (data not shown). The biological activities of pelD-inducer 2 and homoserine were comparable when equivalent amounts, based on amino group content, were assayed (Table 3). That the pelD-inducing activity of the host was due to the presence of asparagine and homoserine was indicated by the dose responses. Assays with combined asparagine and homoserine at levels found in the host tissues showed the same pattern that we observed with the crude inducer preparation. Induction of the GUS reporter increased with increasing amounts of combined amino acids up to 16 mM (total amino acids) with additional inducer eliciting less activity. These small compounds might be bound to other components in the crude preparation, allowing them to be retained by 1-kDa MWCO dialysis tubing during the isolation process.
Table 3. Comparison of the GUS-inducing activity of pe/D inducer 2 and homoserine.
| Inducer | GUS activity* |
|---|---|
| pe/D inducer 2† | |
| 1.05 mM | 2,374 |
| 2.62 mM | 3,550 |
| 5.25 mM | 5,887 |
| Homoserine | |
| 1.05 mM | 2,171 |
| 2.62 mM | 4,262 |
| 5.25 mM | 4,862 |
Arbitrary fluorescence units.
Concentration of inducer 2 is based on the amino acid content of the inducer 2 preparation as determined by quantitation with ninhydrin (20).
Amino acid analysis of the pea stem extract that contained the pelD-inducing activity of the host showed that homoserine and asparagine constitute 79% and 10% of the total free amino acids, respectively; no other amino acid constituted more than 2% of the total (data not shown).
Discussion
Plant–fungus interaction involves a complex series of events, including recognition of a suitable host, germination of conidia, development of appropriate infection structures, and induction or repression of proteins to assist in the infection process (1–3). The least understood aspect of the infection process is the nature of the plant signals that trigger fungal proliferation and development. Many of the identified plant signals are metabolically linked to the fungal enzymes induced to assist the infection process. Genes encoding pectin-degrading enzymes of Colletotrichum lindemuth-ianum (29), Aspergillus spp., Fusarium spp. (30, 31), and Cochliobolus carbonum (32) are induced by pectin or polygalacturonic acid and repressed by glucose. The cutinase gene is induced by cutin and/or its monomers (1, 33). The PDA1 gene encoding pisatin demethylase that detoxifies the pea phytoalexin pisatin is up-regulated by pisatin (34). There are many examples of fungal genes induced almost exclusively in planta. However, the identity of the plant signal involved in such induction remained unknown until the present work. Ustilago maydis requires contact with the host, maize, to complete its sexual life cycle. Recently, it was demonstrated that small molecules from maize tissue could substitute for the intact tissue (35). In the obligate biotrophic fungus, Gigaspora gigantea, and related species, presymbiotic hyphal growth and branching was induced by an active factor present in root exudates of host, but not nonhost, plants (36). Other fungal genes from plant pathogens that are expressed only in planta include genes encoding pathogenesis-related protein factors in Cladosporium fulvum (37), rust genes from Puccinia triticina (38), and genes associated with potato leaf diseases from Phytophthora infestans (39). Of the several genes encoding extracellular pectate lyases in the plant pathogen N. haematococca (15, 16, 30), one, pelA, can be induced by pectin but another, pelD, has been shown to be expressed only in planta (15). However, the nature of the host signal(s) that induces pelD expression was not known. In the present study, we report the isolation and identification of pelD-inducing signals in pea plants as homoserine and asparagine, two major free amino acids found uniquely at high levels in pea seedlings.
In the pea stem extract, asparagine and homoserine are quantitatively the most important free amino acids, in agreement with previous reports (12, 13). In plants, homoserine is found in significant concentrations only in the subfamily Vicieae. Among members of this subfamily that have been analyzed, peas contain homoserine at a uniquely high concentration, up to 7 mg per gram of fresh tissue (12). In the Leguminosae, including pea, asparagine is often the major free amino acid, playing a major role in nitrogen transport; peas can contain up to 2 mg of asparagine per gram of fresh tissue (12). The concentrations of asparagine and homoserine were reported to increase rapidly during germination and remain at high levels in seedlings (12, 13), the exact time when Nectria infection occurs in the field. The dose–response experiments showed that the concentration of the two amino acids required to give maximal pelD-inducing activity was the same as the amino acid content of the pelD inducer; in both cases, higher levels showed less pelD induction, strongly supporting the conclusion that asparagine and homoserine constitute the real pelD inducers in the host. When N. haematococca mycelia invade the host tissue, the high levels of free asparagine and homoserine are readily accessible to the fungus within its host, and thus allow induction of expression of pelD, which has been shown to be a virulence factor (11). In vitro, a few other amino acids (lysine, proline, and threonine) at high concentrations could induce pelD expression, but such levels of these amino acids are not available in vivo. pelD-promoter-driven GUS expression was found to be associated with the infection front, supporting the idea that pelD expression is used to help the invasion process. In view of the uniquely high levels of these amino acids present in the host, it is tempting to suggest that the pathogen evolved this sensing mechanism that help it to invade the host tissue. Whether pelD induction is essential for pathogenesis in alternate hosts is not known. If it is essential, asparagine, known to be made at high concentrations during the first few days of germination (40) for nitrogen transport into growing shoot, might be the main inducer. The molecular events involved in the induction of pelD by these free amino acids remain to be elucidated. Most likely, the molecular events cause pelD induction indirectly via conversion into, or by causing the production of, the direct inducer whose identity is unknown.
Homoserine derivatives, N-acyl-homoserine lactones, were the first compounds discovered to be signals in the bacterial phenomenon known as autoinduction, or quorum sensing, and they are still the most commonly reported quorum sensing signals (41). For many bacterial pathogens, the expression of pathogenity factors depends on quorum sensing. Bacteria delay the production of virulence factors that might activate plant defense systems until there is a bacterial population sufficiently large to resist those defenses. The pea plant has been reported to secrete at least a dozen N-acyl-homoserine lactone signal mimics of unknown structure, possibly to stimulate premature production of bacterial pathogenicity factors (42). N. haematococca may have developed a mechanism to sense the host's tissue environment by using a component of the plant's antibacterial defense system, triggering the expression of pelD to assist the fungal pathogenic process.
Pathogen–plant coevolution based on gene-for-gene interactions has been reported earlier, mainly regarding evolution of avirulence genes in the pathogen and resistance genes in the host (43). The identification of homoserine and asparagine as in vivo inducers of expression of the virulence gene pelD supports the idea of a probable coevolution of pathogens and plants.
Acknowledgments
We thank Dr. Michael Kinter (Cleveland Clinic Foundation, Cleveland) for mass spectrometry, Dr. Charles Cottrell (Ohio State University, Columbus) for NMR analysis, and Dr. Gerhard Munske (Washington State University) for amino acid analysis. This work was supported in part by National Science Foundation Grants IBN-0312183 and IBN-0313968.
Author contributions: P.E.K. designed research; Z.Y., L.M.R., Y.S., and W.G. performed research; Z.Y., W.G., and P.E.K. analyzed data; and Z.Y., L.M.R., and P.E.K. wrote the paper.
Abbreviations: GUS, β-glucuronidase; MWCO, molecular weight cutoff; HSQC, heteronuclear single quantum coherence.
References
- 1.Kolattukudy, P. E., Rogers, L. M., Li, D., Hwang, C. S. & Flaishman, M. A. (1995) Proc. Natl. Acad. Sci. USA 92, 4080–4087. [DOI] [PMC free article] [PubMed] [Google Scholar]
- 2.Kahmann, R. & Basse, C. (2001) Curr. Opin. Microbiol. 4, 374–380. [DOI] [PubMed] [Google Scholar]
- 3.Dean, R. A. (1997) Annu. Rev. Phytopathol. 35, 211–234. [DOI] [PubMed] [Google Scholar]
- 4.Dixon, R. A. & Lamb, C. J. (1990) Annu. Rev. Plant Physiol. Plant Mol. Biol. 41, 339–367. [Google Scholar]
- 5.Hahn, M. & Mendgen, K. (2001) Curr. Opin. Plant Biol. 4, 322–327. [DOI] [PubMed] [Google Scholar]
- 6.Gunawardena, U. & Hawes, M. C. (2002) Mol. Plant–Microbe Interact. 15, 1128–1136. [DOI] [PubMed] [Google Scholar]
- 7.Annis, S. L. & Goodwin, P. H. (1997) Eur. J. Plant Pathol. 103, 1–14. [Google Scholar]
- 8.Basse, C. W., Stumpferl, S. & Kahmann, R. (2000) Mol. Cell. Biol. 20, 321–329. [DOI] [PMC free article] [PubMed] [Google Scholar]
- 9.Basse, C. W., Kolb, S. & Kahmann, R. (2002) Mol. Microbiol. 43, 75–93. [DOI] [PubMed] [Google Scholar]
- 10.Crawford, M. S. & Kolattukudy, P. E. (1987) Arch. Biochem. Biophys. 258, 196–205. [DOI] [PubMed] [Google Scholar]
- 11.Rogers, L. M., Kim, Y. K., Guo, W., González-Candelas, L., Li, D. & Kolattukudy, P. E. (2000) Proc. Natl. Acad. Sci. USA 97, 9813–9818. [DOI] [PMC free article] [PubMed] [Google Scholar]
- 12.Rozan, P., Kuo, Y.-H. & Lambein, F. (2000) J. Agric. Food Chem. 48, 716–723. [DOI] [PubMed] [Google Scholar]
- 13.Rozan, P., Kuo, Y.-H. & Lambein, F. (2001) Amino Acids (Vienna) 20, 319–324. [DOI] [PubMed] [Google Scholar]
- 14.Soliday, C. L., Dickman, M. B. & Kolattukudy, P. E. (1989) J. Bacteriol. 171, 1942–1951. [DOI] [PMC free article] [PubMed] [Google Scholar]
- 15.Guo, W., González-Candelas, L. & Kolattukudy, P. E. (1996) Arch. Biochem. Biophys. 332, 305–312. [DOI] [PubMed] [Google Scholar]
- 16.Guo, W., González-Candelas, L. & Kolattukudy, P. E. (1995) J. Bacteriol. 177, 7070–7077. [DOI] [PMC free article] [PubMed] [Google Scholar]
- 17.Rogers, L. M., Flaishman, M. A. & Kolattukudy, P. E. (1994) Plant Cell 6, 935–945. [DOI] [PMC free article] [PubMed] [Google Scholar]
- 18.Brenner, M., Niederwieser, A. & Pataki, G. (1965) in Thin-Layer Chromatography: A Laboratory Handbook, ed. Stahl, E. (Springer, New York), pp. 391–440.
- 19.Waldi, D. (1965) in Thin-Layer Chromatography: A Laboratory Handbook, ed. Stahl, E. (Springer, New York), p. 496.
- 20.Allen, G. (1981) Sequencing of Proteins and Peptides (Elsevier/North–Holland, New York), pp. 139–141.
- 21.Jefferson, R. A. (1987) Plant Mol. Biol. Rep. 5, 387–405. [Google Scholar]
- 22.Li, J., Wang, J. & Bachas, L. G. (2002) Anal. Chem. 74, 3336–3341. [DOI] [PubMed] [Google Scholar]
- 23.Gros, C. & Labouesse, B. (1969) Eur. J. Biochem. 7, 463–470. [DOI] [PubMed] [Google Scholar]
- 24.Wesenberg, J. C. & Thibert, R. J. (1977) Mikrochim. Acta 1, 469–473. [DOI] [PubMed] [Google Scholar]
- 25.Willker, W., Leibfritz, D., Kerssebaum, R. & Bermel, W. (1993) Magn. Reson. Chem. 31, 287–292. [Google Scholar]
- 26.Maiti, I. B. & Kolattukudy, P. E. (1979) Science 205, 507–508. [DOI] [PubMed] [Google Scholar]
- 27.Mohan, R., Vijayan, P. & Kolattukudy, P. E. (1993) Plant Mol. Biol. 22, 475–490. [DOI] [PubMed] [Google Scholar]
- 28.Schneider, H. (1981) in Staining Procedures, ed. Clark, G. (Williams & Wilkins, Baltimore), 4th Ed., pp. 367–368.
- 29.Hugouvieux, V., Centis, S., Lafitte, C. & Esquerre-Tugaye, M. T. (1997) Appl. Environ. Microbiol. 63, 2287–2292. [DOI] [PMC free article] [PubMed] [Google Scholar]
- 30.González-Candelas, L. & Kolattukudy, P. E. (1992) J. Bacteriol. 174, 6343–6349. [DOI] [PMC free article] [PubMed] [Google Scholar]
- 31.Huertas-González, M. D., Ruiz-Roldán, M. C., García Maceira, F. I., Roncero, M. I. G. & Di Pietro, A. (1999) Curr. Genet. 35, 36–40. [DOI] [PubMed] [Google Scholar]
- 32.Scott-Craig, J. S., Panaccione, D. G., Cervone, F. & Walton, J. D. (1990) Plant Cell 2, 1191–1200. [DOI] [PMC free article] [PubMed] [Google Scholar]
- 33.Kolattukudy, P. E. (2001) Adv. Biochem. Eng. Biotechnol. 71, 3–49. [DOI] [PubMed] [Google Scholar]
- 34.Hirschi, K. & VanEtten, H. (1996) Mol. Plant–Microbe Interact. 9, 483–491. [DOI] [PubMed] [Google Scholar]
- 35.Ruiz-Herrera, J., Leon-Ramirez, C., Cabrera-Ponce, J. L., Martinez-Espinoza, A. D. & Herrera-Estrella, L. (1999) Mol. Gen. Genet. 262, 468–472. [DOI] [PubMed] [Google Scholar]
- 36.Buee, M., Rossignol, M., Jauneau, A., Ranjeva, R. & Becard, G. (2000) Mol. Plant–Microbe Interact. 13, 693–698. [DOI] [PubMed] [Google Scholar]
- 37.Wubben, J. P., Joosten, M. H. & De Wit, P. J. (1994) Mol. Plant–Microbe Interact. 7, 516–524. [DOI] [PubMed] [Google Scholar]
- 38.Thara, V. K., Fellers, J. P. & Zhou, J.-M. (2003) Mol. Plant Pathol. 4, 51–56. [DOI] [PubMed] [Google Scholar]
- 39.Beyer, K., Jiménez, S. J., Randall, T. A., Lam, S., Binder, A., Boller, T. & Collinge, M. A. (2002) Mol. Plant Pathol. 3, 473–485. [DOI] [PubMed] [Google Scholar]
- 40.Sieciechowicz, K. A., Joy, K. W. & Ireland, R. J. (1988) Phytochemistry 27, 663–671. [Google Scholar]
- 41.von Bodman, S. B., Bauer, W. D. & Coplin, D. L. (2003) Annu. Rev. Phytopathol. 41, 455–482. [DOI] [PubMed] [Google Scholar]
- 42.Teplitski, M., Robinson, J. B. & Bauer, W. D. (2000) Mol. Plant–Microbe Interact. 13, 637–648. [DOI] [PubMed] [Google Scholar]
- 43.Stahl, E. A. & Bishop, J. G. (2000) Curr. Opin. Plant Biol. 3, 299–304. [DOI] [PubMed] [Google Scholar]


