Abstract
Objective
To examine current vaccine sentiment on social media by constructing and analyzing semantic networks of vaccine information from highly shared websites of Twitter users in the United States; and to assist public health communication of vaccines.
Background
Vaccine hesitancy continues to contribute to suboptimal vaccination coverage in the United States, posing significant risk of disease outbreaks, yet remains poorly understood.
Methods
We constructed semantic networks of vaccine information from internet articles shared by Twitter users in the United States. We analyzed resulting network topology, compared semantic differences, and identified the most salient concepts within networks expressing positive, negative, and neutral vaccine sentiment.
Results
The semantic network of positive vaccine sentiment demonstrated greater cohesiveness in discourse compared to the larger, less-connected network of negative vaccine sentiment. The positive sentiment network centered around parents and focused on communicating health risks and benefits, highlighting medical concepts such as measles, autism, HPV vaccine, vaccine-autism link, meningococcal disease, and MMR vaccine. In contrast, the negative network centered around children and focused on organizational bodies such as CDC, vaccine industry, doctors, mainstream media, pharmaceutical companies, and United States. The prevalence of negative vaccine sentiment was demonstrated through diverse messaging, framed around skepticism and distrust of government organizations that communicate scientific evidence supporting positive vaccine benefits.
Conclusion
Semantic network analysis of vaccine sentiment in online social media can enhance understanding of the scope and variability of current attitudes and beliefs toward vaccines. Our study synthesizes quantitative and qualitative evidence from an interdisciplinary approach to better understand complex drivers of vaccine hesitancy for public health communication, to improve vaccine confidence and vaccination coverage in the United States.
Keywords: Vaccine hesitancy, vaccine sentiment, semantic network analysis, online social media, Twitter
1. INTRODUCTION
1.1 Vaccine hesitancy
Suboptimal vaccination coverage in the United States continues to pose significant risk of disease outbreaks, in part, due to vaccine hesitancy [1]. Vaccine hesitancy refers to a combination of beliefs, attitudes, and behaviors that influence an individual’s decision to vaccinate despite vaccine availability; these behaviors include refusal, delay, or reluctant acceptance despite having active concerns [2,3]. Strategies to address vaccine refusal have focused on individual reasons for not vaccinating, however, evidence of successful interventions remains limited. A review of vaccine hesitancy interventions expressed weak support for current strategies in mitigating vaccine resistance [4]; interventions targeted toward anti-vaccination groups are likely to be ineffective, unsustainable, and potentially more detrimental compared to no intervention at all [4–6].
Vaccine hesitancy stems from socio-cultural, political, and otherwise non-medical factors that are poorly understood [7]. The underlying causes of vaccine hesitancy should not be attributed to scientific illiteracy alone [8], but rather viewed as a deliberative and structured process that requires contextualized examination at local levels [9,10]. In the case of our study, we focus on semantic and rhetorical qualities of vaccine communication amongst the general public within contexts of differing vaccine sentiment.
1.2 Social network analysis and digital epidemiology
The advent of the Internet and social media has provided new platforms for persuasion and rapid spread of (mis)information, bringing forth new challenges and opportunities to an age-old public health problem. Social Network Analysis (SNA) broadly studies social interactions of contact networks with significant implications for public health [11], such as contributing evidence that belief systems are a primary barrier to vaccination [12]. Novel public health tools such as SNA employ computational frameworks in the context of digital epidemiology [13]. Online social media such as Twitter are novel avenues to acquire real-time data of attitudes, beliefs, and behaviors, particularly for underrepresented demographic groups who disproportionately comprise Twitter users [14]. By leveraging online data, studies can examine the dynamics of massively interacting populations, such as online health sentiment and its potential impact on infectious disease outbreaks [15,16].
1.3 Semantic networks
Semantic networks are graphical representations of knowledge based on meaningful relationships of written text, structured as a network of words cognitively related to one another [17,18], in this study, vaccine information. Within the semantic network, nodes are words that represent concepts found in text. The connections between nodes are referred to as edges which represent relationships between connected concepts. Semantic networks allow extraction of meaningful ideas by identifying emergent clusters of concepts rather than analyzing frequencies of isolated words [19]; in this way, analyzing online social media can enhance understanding of complex health behavior, particularly for vaccine hesitancy.
Similar studies have analyzed websites using search engine results and natural language processing (NLP) [20,21]. Text network analysis traditionally employs semi-automated techniques in which information is extracted and analyzed using both human and computerized methods, dealing with challenges such as coreference resolution, synonym resolution, and ambiguity [22]. To limit these issues, we constructed semantic networks manually and then performed network analysis within our study.
Both proximate and non-proximate determinants of vaccine hesitancy necessitate an interdisciplinary approach [23,24]. Our study presents a novel framework that applies methods of network analysis to semantic networks [25] within the context of vaccine sentiment.
1.4 Study objective
Our objective was to examine current vaccine sentiment on social media by constructing and analyzing semantic networks of vaccine information from highly shared websites of Twitter users in the United States.
1.5 Public health significance
The Strategic Advisory Group of Experts on Immunization (SAGE) Working Group on Vaccine Hesitancy (WG) reported specific research needs to better understand context-specific causes underlying vaccine hesitancy [26]. To help address this gap, we utilized quantitative network methods in analyzing qualitative aspects of vaccine information---an efficient approach to investigating the scope and variability of current attitudes and beliefs toward vaccines. Such findings are pivotal in informing and improving public health communication of vaccine confidence.
2. METHODS
2.1 Data retrieval and document selection
We used ChatterGrabber [27], a web-scraping tool that randomly samples public tweets of Twitter users in the United States. (Details on ChatterGrabber including search term conditions, qualifiers, and exclusions are in Appendix A). Webpage links from collected tweets identified current sources of vaccine information based on the frequency of link shares during the time of data collection. Our analysis focuses on the textual content of relevant webpage articles (also referred to as documents) and not the tweeted text per se. Document types selected for analysis included blog posts, media stories, informational articles, and news reports. We excluded academic publications, court documents, and media formats such as images, PDF files, and videos.
A total of 26,389 tweets were collected between April 16, 2015 and May 29, 2015 from which we obtained 8,416 unique web links. To generalize findings from a representative pool of popular vaccine articles, we screened the top 100 most shared links for relevance from which we randomly sampled 50 for analysis; we excluded articles concerning non-human vaccines.
2.2 Vaccine sentiment coding
Articles were read for content and manually coded as having either positive, negative, or neutral sentiment toward vaccines. Coding was determined by whole-text assessment which included examining the title/headline and the source/domain of articles. In general, differences between sentiment were determined based on consistency of statements that clearly identified group affiliation, such as encouraging vaccination and highlighting benefits (positive sentiment) or discouraging vaccination and highlighting risks (negative sentiment). Articles that were ambiguous or mixed in sentiment were coded as neutral. Three researchers (GJK, SRE, LM) independently coded a subset of 10 articles for sentiment; there was no inter-annotator variability and resulted in consistent sentiment coding.
2.3 Construction of vaccine sentiment networks
Document text networks were merged by sentiment group, thereby aggregating similar documents into a single semantic network, one for each vaccine sentiment (positive, negative, and neutral). We standardized node and edge labels to resolve lexical differences and grammatical dependencies across disparate sources. Details on semantic network annotation, construction, and analysis of vaccine sentiment networks are described in Appendix B.
2.4 Semantic network analysis
Our analysis of the positive, negative, and neutral sentiment networks was focused on the greatest connected component (or subgraph). We applied several measures of network analysis to the generated semantic networks in order to limit biased interpretation of selected network metrics [25] (Appendix B). Descriptive statistics included network size, density, and diameter, where network size is the total number of nodes (i.e., vaccine concepts); density measures the interconnectedness of nodes [28]; and diameter characterizes compactness of the network. We evaluated multiple measures of centrality which describes the importance, influence, or significance of concepts within the semantic network in various ways [29]; specific types include degree centrality, betweenness centrality, closeness centrality, and eigenvector centrality [30].
Community detection algorithms [31] describe cohesive groups in the network [32], and clusters of important vaccine concepts were visualized by the network’s maximum k-core (the maximal connected subgraph in which all nodes have degree of at least k) [33]. We assessed differences in emphasis framing, which is the salience of certain story elements over others [34], for central concepts from networks of differing sentiment. Closeness vitality [49] measures how much the distances between all pairs of nodes change when a particular node is removed. This is an indicator of how much each node contributes to the overall structural cohesion of the network.
NetworkX [35] and iGraph [36] were used in network construction and analysis; visualizations were created in Gephi [37].
3. RESULTS
3.1 Document characteristics
From the sample of webpages (n=50), we coded 23 documents as having positive vaccine sentiment, 21 documents with negative vaccine sentiment, and 6 documents were classified as neutral. Table 1 summarizes document characteristics grouped by vaccine sentiment. Blog posts were the most shared document type overall, followed by news and “alternative news” for positive and negative sentiment articles respectively. Content of positive sentiment documents focused on specific childhood, adolescent, and adult vaccines, whereas negative sentiment documents focused primarily on childhood vaccines and vaccination in general.
Table 1. Summary of sampled documents.
The table summarizes article characteristics by vaccine sentiment group and describes document type, article source, target vaccine population, vaccine type focus, and specific vaccine topics.
| Vaccine sentiment articles (Total n = 50) |
Positive (n = 23) | Negative (n = 21) | Neutral (n = 6) | |||
|---|---|---|---|---|---|---|
|
| ||||||
| Document type | Blog = | 8 (34.8%) | Blog = | 15 (71.4%) | News = | 4 (66.7%) |
| News = | 7 (30.4%) | Alternative News = | 2 (9.5%) | Blog = | 1 (16.7%) | |
| Magazine = | 5 (21.7%) | Magazine = | 2 (9.5%) | Magazine = | 1 (16.7%) | |
| Informational = | 3 (13.0%) | Commercial = | 1 (4.8%) | |||
| News = | 1 (4.8%) | |||||
|
| ||||||
| Article source type | Media = | 9 (39.1%) | Media = | 15 (71.4%) | Government = | 2 (33.3%) |
| Government = | 8 (34.8%) | Industry = | 3 (14.3%) | Media = | 2 (33.3%) | |
| News = | 4 (17.4%) | Personal = | 2 (9.5%) | News = | 2 (33.3%) | |
| Industry = | 1 (4.4%) | Forum = | 1 (4.8%) | |||
| Resource = | 1 (4.4%) | |||||
|
| ||||||
| Target vaccine population | Childhood = | 16 (69.6%) | Childhood = | 15 (71.4%) | Childhood = | 3 (50.0%) |
| Adolescent = | 3 (13.0%) | Adolescent = | 0 | Adolescent = | 2 (33.3%) | |
| Adult = | 1 (4.4%) | Adult = | 0 | Adult = | 1 (16.7%) | |
| Multiple = | 3 (13.0%) | Multiple = | 6 (28.6%) | Multiple = | 0 | |
|
| ||||||
| Vaccine type focus | General = | 8 (34.8%) | General = | 14 (66.7%) | General = | 3 (50%) |
| Specific = | 15 (65.2%) | Specific = | 7 (33.3%) | Specific = | 3 (50%) | |
|
| ||||||
| Specific vaccines | Measles/MMR = | 9 | Shingles = | 1 | Whooping cough = | 2 |
| HPV = | 3 | Polio = | 1 | Influenza = | 1 | |
| Influenza = | 1 | Gardasil = | 1 | |||
| Meningococcal = | 1 | Measles = | 1 | |||
| Rubella = | 1 | Swine flu = | 1 | |||
| Tdap = | 1 | |||||
| Hepatitis B = | 1 | |||||
3.2 Document text networks
Network properties of vaccine documents are summarized in Table 2. Negative sentiment documents (n=21) formed the largest semantic networks with a mean network size of 90.9 concepts (nodes) per document, compared to smaller networks of positive sentiment (n=23) and neutral sentiment documents (n=6) with a mean of 51.3 and 43.8 concepts per document respectively.
Table 2. Summary of measures for article text networks and sentiment group networks.
The table describes network characteristics of extracted web documents; joint semantic networks of positive, negative, and neutral vaccine sentiment; and the corresponding greatest connected component. Measures describe network size, density, and average centrality.
| Vaccine sentiment | Positive | Negative | Neutral |
|---|---|---|---|
|
| |||
| Document text networks | |||
| Number of documents (Total=50) | 23 documents | 21 documents | 6 documents |
| Average number of nodes (per document) | 53.1 nodes | 90.9 nodes | 43.8 nodes |
| Average number of edges (per document) | 49 edges | 90.7 edges | 39.7 edges |
| Average degree (per document) | 1.9 | 1.98 | 1.8 |
|
| |||
| Vaccine sentiment networks | |||
| Average degree | 3.356 | 2.95 | 2.348 |
| Number of connected components | 21 | 49 | 12 |
|
| |||
| Greatest component subgraph | |||
| Nodes / Total network nodes | 585 / 652 nodes | 1140 / 1257 nodes | 171 / 201 nodes |
| Edges / Total network edges | 1042 / 1094 edges | 1783 / 1854 edges | 216 / 236 edges |
| Average degree | 3.562 | 3.128 | 2.526 |
| Diameter | 12 | 13 | 17 |
| Density | 0.0061 | 0.0027 | 0.0149 |
| Number of communities | 21 | 31 | 10 |
| Average path length | 4.492 | 4.77 | 6.78 |
| Average degree centrality | 0.0061 | 0.0027 | 0.0149 |
| Average betweenness centrality | 0.006 | 0.0033 | 0.0342 |
| Average closeness centrality | 0.2292 | 0.2161 | 0.1533 |
| Average node connectivity | 1.3117 | 1.1835 | 1.035 |
| Average clustering coefficient | 0.196 | 0.14 | 0.131 |
3.3 Vaccine sentiment networks
Document text networks were aggregated by vaccine sentiment to form 3 semantic networks representing positive, negative, and neutral sentiment. Network measures are summarized in Table 2. Network visualizations are in Appendix C.
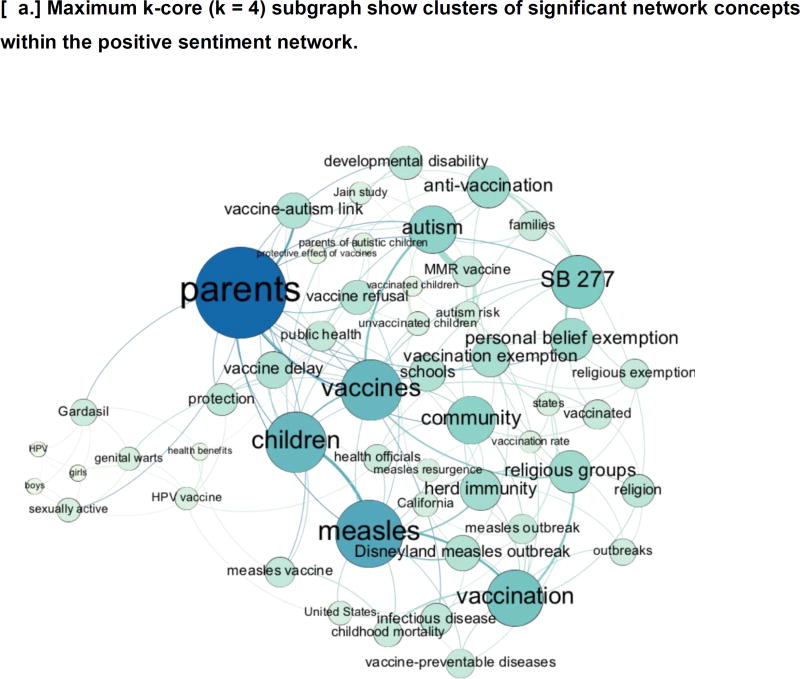
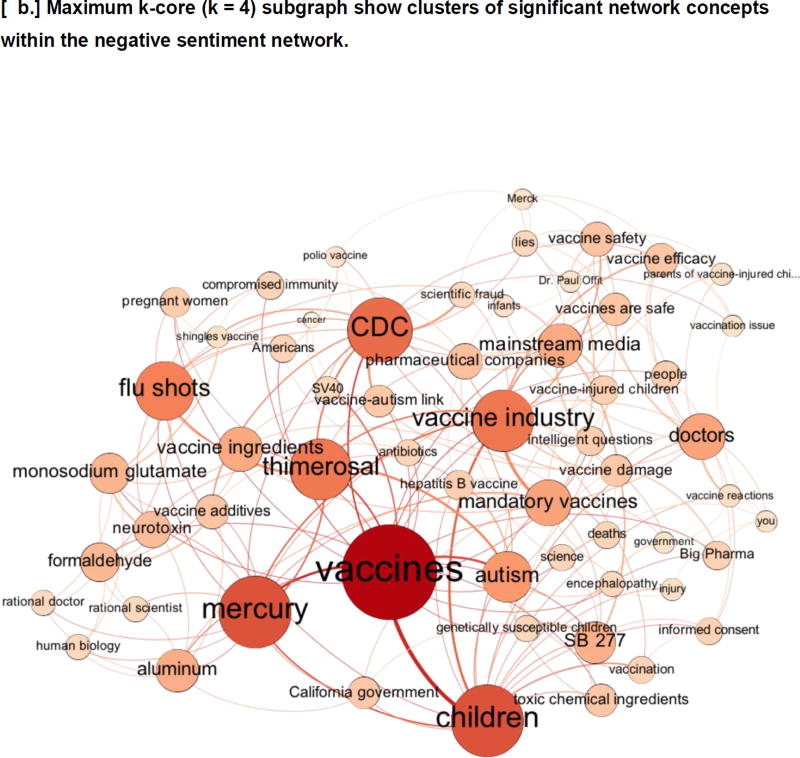
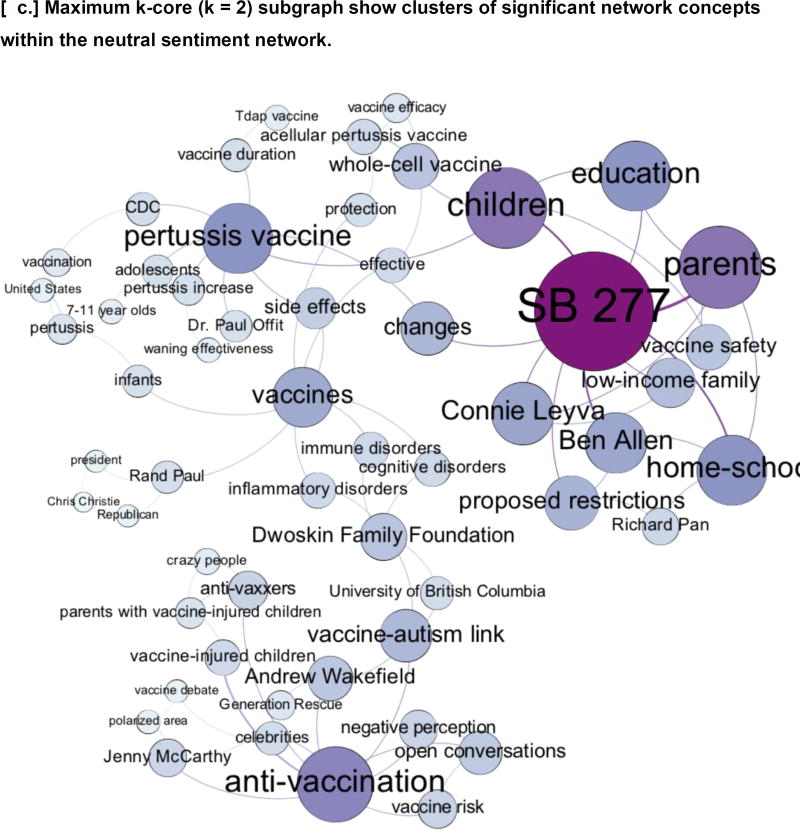
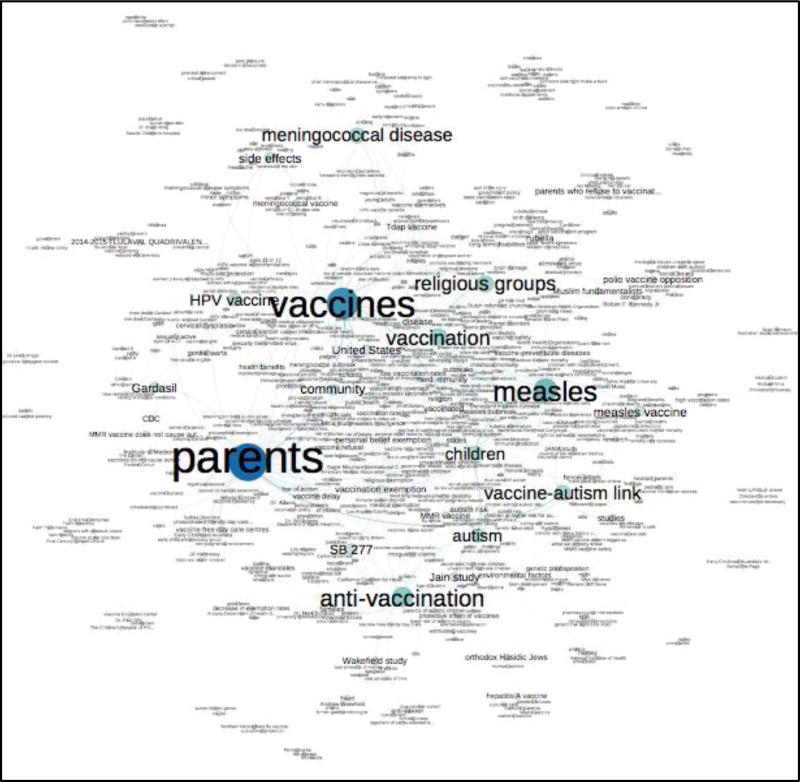
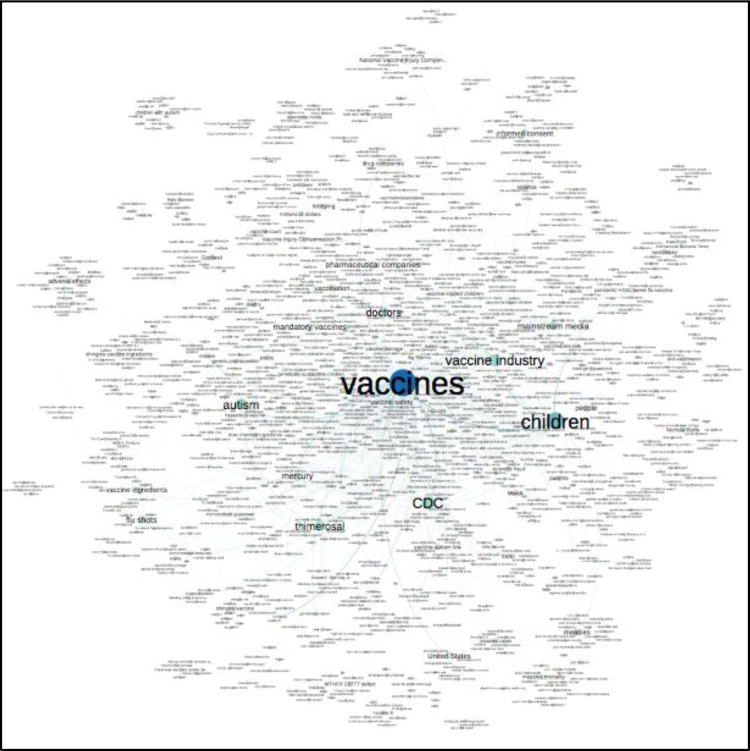
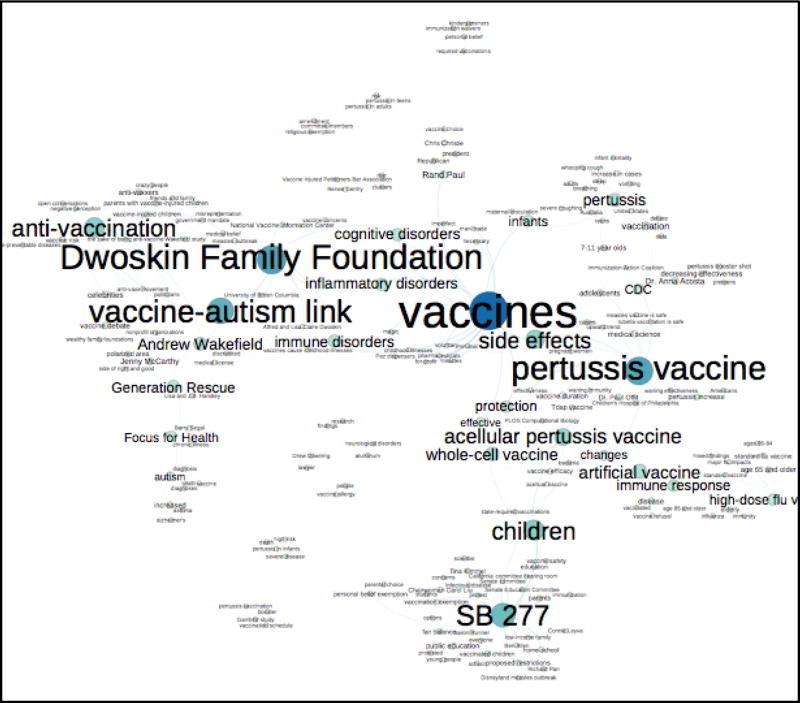
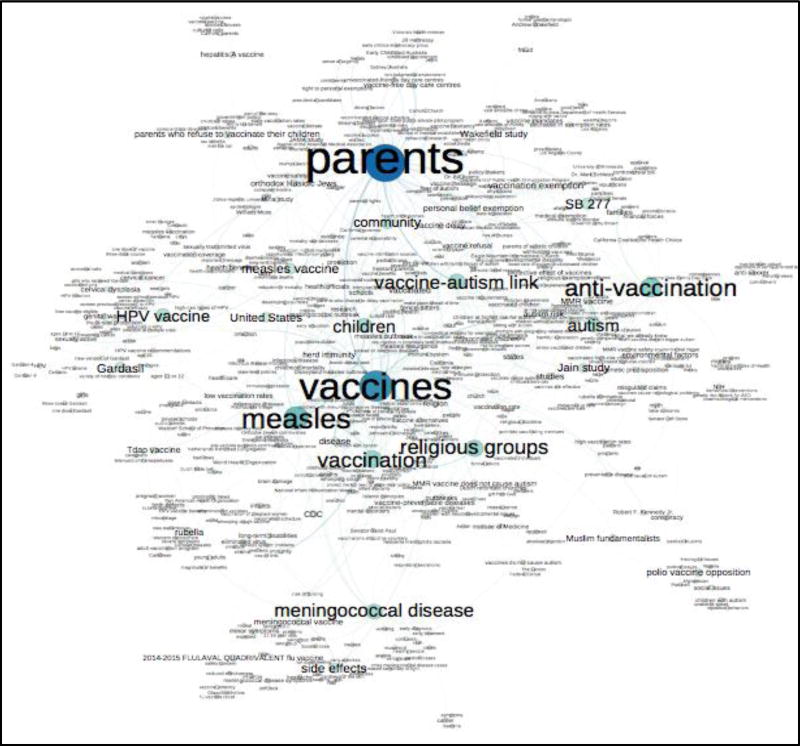
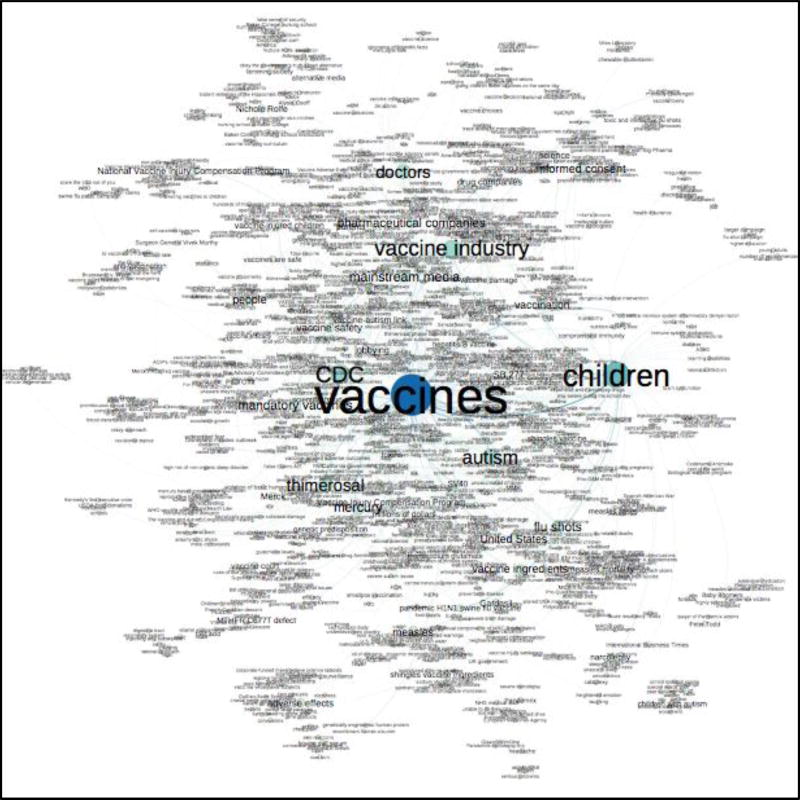
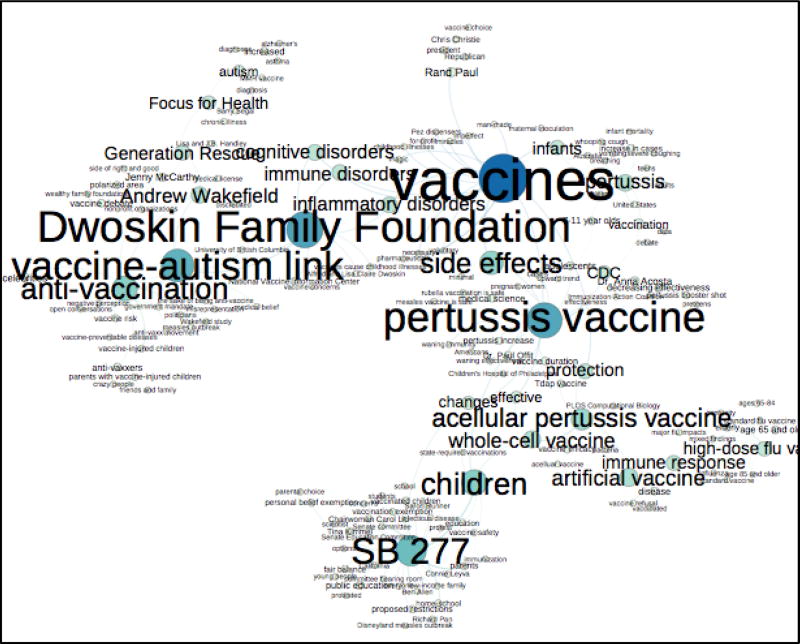
In regards to the greatest component subgraph, size indicates the number of concepts in the network, whereas density describes interconnectedness of the concepts. The greatest component of the negative network was largest in size (1140 concepts) but less dense (0.0027) than the positive network (0.0061) also much smaller in size (585 concepts). Community detection analysis [31] identified 21 distinct communities within the positive network, 31 communities in the negative, and 10 communities in the neutral network. Compared to the original number of merged documents per sentiment network, the number of cohesive communities exceeded the number of original documents within the negative and neutral networks, whereas the positive network formed fewer communities than the original number of documents used in merging. Community findings and density measures for the positive network suggest a more cohesive and interconnected belief system among positive sentiment concepts compared to the larger, less-connected network of negative sentiment. Correspondingly, the average clustering coefficient (i.e., the tendency of nodes to form groups) and average node centrality for degree, betweenness, closeness, and eigenvector centrality were higher for the positive network compared to the negative. Positive and negative networks exhibited structural similarities in regards to diameter (12 and 13, respectively) and average path length (4.5 and 4.8, respectively). Visualizations of maximum k-core subgraphs for each sentiment network highlight clusters of significant concepts in Figure 1.
Figure 1. Maximum k-core subgraphs show clusters of significant vaccine concepts within the semantic networks.
Visualizations of maximum k-cores (i.e., the maximal connected subgraph in which all nodes have degree of at least k) for networks of [a.] positive vaccine sentiment (k = 4), [b.] negative vaccine sentiment (k = 4), and [c.] neutral vaccine sentiment (k = 2) where increasing node and text size represents increasing betweenness centrality.
3.3 Central concepts
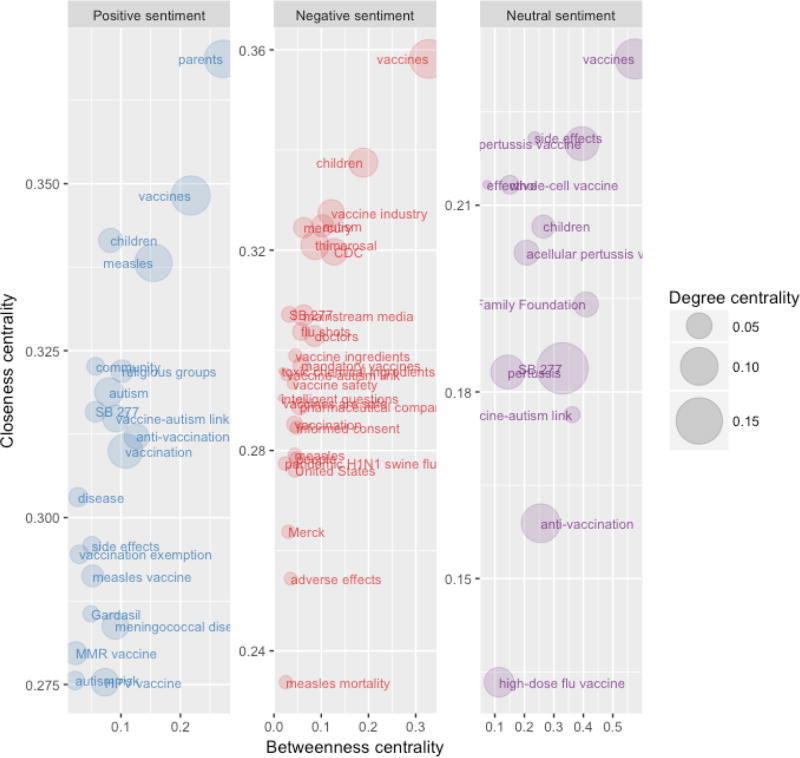
Figure 2 plots significant concepts of each sentiment network by centrality measures for degree, betweenness, and closeness centrality (Appendix D). The most central concepts (greater than 2 standard deviations from the mean) ranked by eigenvector centrality are plotted in Figure 3 and listed in Table 3.
Figure 2. Significant vaccine concepts by measures of degree centrality, betweenness centrality, and closeness centrality.
The figure includes centrality measures for significant concepts from positive, negative, and neutral sentiment networks. Degree centrality (point size), betweenness centrality (x-axis), and closeness centrality (y-axis) are plotted.
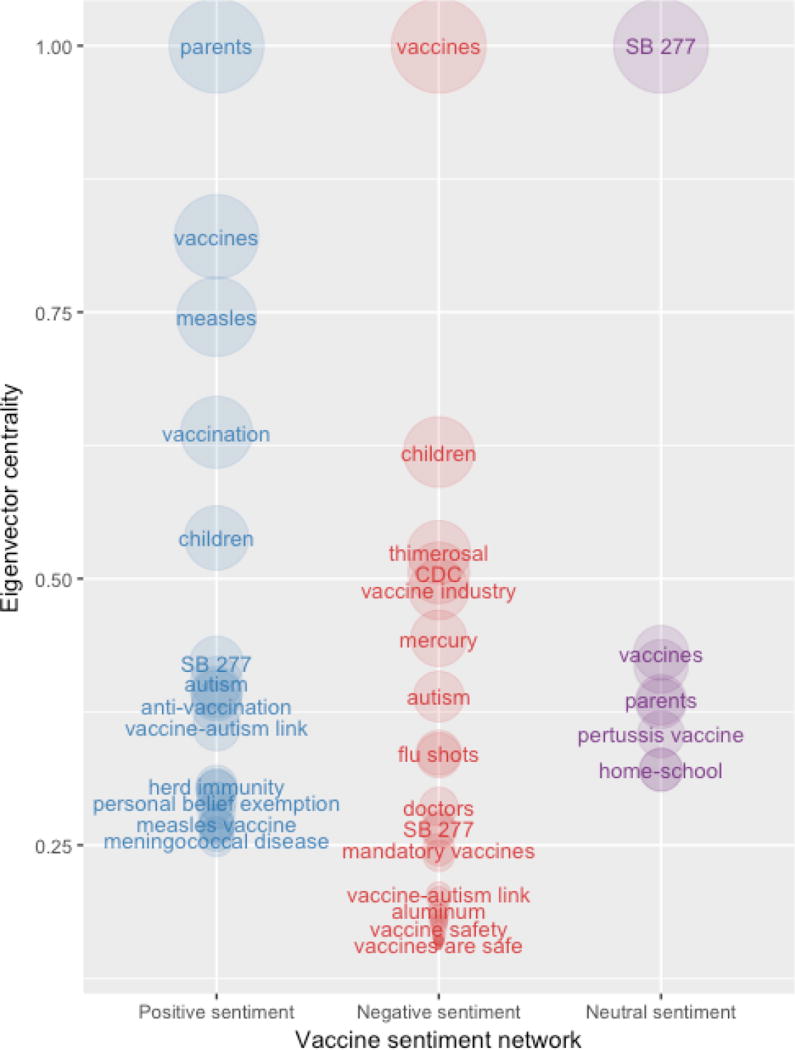
Figure 3. Significant concepts ranked by eigenvector centrality.
The figure plots the most central nodes by eigenvector centrality score for networks of positive, negative, and neutral vaccine sentiment.
Table 3. Top nodes by eigenvector centrality.
The table lists the most central concepts of each sentiment network ranked by eigenvector centrality score (greater than 2 standard deviations from the mean).
| Eigenvector centrality | |||||
|---|---|---|---|---|---|
|
| |||||
| Positive sentiment network | Negative sentiment network | Neutral sentiment network | |||
|
| |||||
| Mean = 0.0626 | Mean = 0.0318 | Mean = 0.0975 | |||
| Std Dev = 0.0936 | Std Dev = 0.06 | Std Dev = 0.11 | |||
|
| |||||
| parents | 1 | vaccines | 1 | SB 277 | 1 |
|
| |||||
| vaccines | 0.8209 | children | 0.6188 | vaccines | 0.4304 |
|
| |||||
| measles | 0.7458 | thimerosal | 0.5248 | anti-vaccination | 0.4177 |
|
| |||||
| vaccination | 0.6373 | CDC | 0.5054 | parents | 0.3863 |
|
| |||||
| children | 0.5382 | vaccine industry | 0.4898 | children | 0.3830 |
|
| |||||
| SB 277 | 0.4207 | mercury | 0.4440 | pertussis vaccine | 0.3540 |
|
| |||||
| autism | 0.4025 | autism | 0.3894 | home-school | 0.3209 |
|
| |||||
| community | 0.3937 | flu shots | 0.3367 | education | 0.3206 |
|
| |||||
| religious groups | 0.3905 | mainstream media | 0.3342 | ||
|
| |||||
| anti-vaccination | 0.3802 | doctors | 0.2862 | ||
|
| |||||
| vaccine-autism link | 0.3608 | SB 277 | 0.2659 | ||
|
| |||||
| herd immunity | 0.3058 | vaccine ingredients | 0.2632 | ||
|
| |||||
| vaccine refusal | 0.3024 | mandatory vaccines | 0.2457 | ||
|
| |||||
| vaccination exemption | 0.3013 | pharmaceutical companies | 0.2400 | ||
|
| |||||
| personal belief exemption | 0.2909 | vaccine-autism link | 0.2041 | ||
|
| |||||
| disease | 0.2829 | toxic chemical ingredients | 0.1999 | ||
|
| |||||
| measles vaccine | 0.2706 | aluminum | 0.1889 | ||
|
| |||||
| schools | 0.2685 | vaccination | 0.1853 | ||
|
| |||||
| HPV vaccine | 0.2674 | monosodium glutamate | 0.1811 | ||
|
| |||||
| vaccine delay | 0.2603 | hepatitis B vaccine | 0.1793 | ||
|
| |||||
| meningococcal disease | 0.2551 | vaccine-injured children | 0.1763 | ||
|
| |||||
| vaccine safety | 0.1721 | ||||
|
| |||||
| evidence | 0.1655 | ||||
|
| |||||
| informed consent | 0.1643 | ||||
|
| |||||
| intelligent questions | 0.1612 | ||||
|
| |||||
| formaldehyde | 0.1609 | ||||
|
| |||||
| pregnant women | 0.1598 | ||||
|
| |||||
| pandemic H1N1 swine flu vaccine | 0.1595 | ||||
|
| |||||
| Big Pharma | 0.1591 | ||||
|
| |||||
| vaccines are safe | 0.1565 | ||||
|
| |||||
| quackery | 0.1552 | ||||
|
| |||||
| vaccine damage | 0.1547 | ||||
|
| |||||
| SV40 | 0.1545 | ||||
|
| |||||
| science | 0.1531 | ||||
Excluding expected nodes such as vaccines and vaccination, the most central concepts for the positive network included parents, measles, children, SB 277, autism, community, religious groups, anti-vaccination, vaccine-autism link, HPV vaccine, meningococcal disease, and MMR vaccine. Significant concepts within the negative sentiment network were children, thimerosal, CDC, vaccine industry, mercury, autism, flu shots, mainstream media, doctors, SB 277, vaccine ingredients, mandatory vaccines, and pharmaceutical companies. And the most central concepts of the neutral network were SB 277, anti-vaccination, parents, children, pertussis vaccine, homeschool, education, pertussis, vaccine-autism link, side effects, Dwoskin Family Foundation, whole-cell vaccine, effective, acellular pertussis vaccine, and high-dose flu vaccine.
3.4 Dynamic visualizations
Dynamic, interactive visualizations and network data files from this study are available online (Appendix E).
4. DISCUSSION
4.1 Semantic network analysis of vaccine sentiment
A long line of research in the psychology of memory and semantic processing has provided evidence for semantic network-like organization of internal representations and spreading activation as a process by which memories are activated and meaning is processed [53, 54, 50, 51]. In this model, when an item in memory is activated, e.g., by a person reading about it or hearing about it, the activation spreads from that node in the person’s internal semantic network to nearby nodes. Spreading activation is also hypothesized as the model for the automatic activation of attitudes [55].
From this perspective, closeness centrality is a useful metric to understand the organization of the vaccination semantic networks (though other centrality measures are quite similar in ranking, as the results show). Closeness centrality is a direct measure of which concepts are likely to be activated repeatedly in each of the semantic networks, even as different concepts are mentioned.
Many central concepts of the positive network were present in the negative network, but not vice versa. For example, while positive and neutral sentiment documents explicitly addressed the concept of anti-vaccination, negative sentiment articles did not. In regards to highly central concepts of the negative network, the positive network lacked any reference to the vaccine industry and mainstream media; CDC and doctors also held lesser significance in the context of positive vaccine sentiment.
Significant concepts within the positive network were related to health and medicine, such as measles, autism, HPV vaccine, vaccine-autism link, meningococcal disease, and MMR vaccine. In contrast, significant concepts of the negative network referred to organizational bodies such as CDC, vaccine industry, doctors, mainstream media, pharmaceutical companies, and United States. A notable contrast was the emergence of parents as the most central concept in the positive network, versus children, the most central node in the negative network.
Documents expressing positive and neutral vaccine sentiment were characterized by dense semantic networks with fewer concepts, compared to the semantic network of negative sentiment which presented a high number of vaccine concepts with low connectivity. Compared to the positive sentiment network, the negative sentiment network has more components, lower edge density, a larger diameter, and larger average path length [Table 2]. Hence, positive sentiment documents indicated greater cohesiveness in vaccine-positive discourse compared to vaccine-negative documents which addressed a broad range of topics as potential contributors to vaccine hesitancy.
4.2 Message framing
Our study revealed sentiment-specific terminology used in framing positive and negative messages within vaccine communication. This included differences in term valence such as required vaccines versus mandated vaccines and side effects versus adverse effects, the selective targeting of parents versus children, and the overall presentation of evidence-based science versus social commentary related to issues of governance for the positive and negative vaccine sentiment networks, respectively.
Overall, the prevalence of negative vaccine sentiment was demonstrated through diverse messaging, framed around institutional distrust and skepticism towards the organizations that deliver scientific evidence of positive vaccine benefits. This is also shown by the list of top nodes for the closeness vitality measure for each network [Table D4], which is an indicator of the concepts which are responsible for providing structural cohesion to the semantic network [49]. Positive and negative vaccine articles largely differed in the framing of trust. Positive articles emphasized trust in vaccination by relying on scientific evidence as trusted authority. Negative articles framed trust issues not around vaccination science itself, but around the institutions that govern or finance matters of personal health. Neutral vaccine articles exemplified various sources of news coverage that expressed a mix of both positive and negative attitudes toward vaccines. Top news stories at the time of data collection included a new study debunking the vaccine-autism link and the passing of California Senate Bill 277 [38], which removed exemptions from school vaccination requirements. News coverage generally expressed positive vaccine sentiment, reporting official statements and statistics. In contrast, news coverage by negative vaccine articles additionally introduced a range of tangential topics, often proposing arguments through rhetorical questions and reframing official statistics.
4.3 Limitations
We assumed that popular vaccination information shared on Twitter is representative of prevalent vaccine sentiment, but may not reflect the broad spectrum of vaccine sentiment in the general population. Coding documents for neutral sentiment was difficult since documents presented a mix of both positive and negative attitudes, and not truly vaccine-neutral. Because health behaviors are founded upon a variety of beliefs and attitudes that change over time, vaccine sentiment categories are difficult to delineate since they do not exist as polarized groups.
While we attempted to resolve issues of meaning and context by manually transcribing implicit statements into explicit statements, reference resolution grew increasingly difficult across different documents. Consequently, there is potential inconsistency from the manual annotation of document text into network data, particularly when dealing with ambiguous language such as slang, hyperbole, and poetic devices. Despite these limitations, employing human interpretation of text greatly enhances qualitative aspects of data and is arguably more accurate than current NLP methods which lack explicit domain-specific knowledge or situational information [22]. Lastly, our analysis did not assess the qualitative relationships of connected concepts. Future studies incorporating edge data can provide detailed insight into the comparison of belief structures of varying vaccine sentiment.
Our study presents only a broad overview of general network measures. Greater depth into specific metrics, such as community detection analysis, can provide useful insight and should be addressed in future studies.
4.4 Implications for public health and vaccine communication
The SAGE WG on Vaccine Hesitancy [26] states that communication is a tool to address vaccine sentiment rather than a determinant of hesitancy. However, poor communication can undermine vaccine acceptance in any setting [39]. Our study lends itself to the development of effective communication strategies for target populations by identifying specific factors that influence vaccine hesitancy---an integral component of every immunization program [39].
Semantic network analysis of vaccine sentiment in online social media can enhance our understanding of the scope and variability of attitudes and beliefs toward vaccination. Our findings emphasize the need to improve the framing and messaging of public health communication, that not only highlights the vaccine benefits, but also addresses specific issues related to vaccine hesitancy and institutional distrust. Enhancing public trust in relevant scientific institutions and engaging in efficient public health communication is critical in improving vaccine confidence and vaccination coverage [40].
4.5 Conclusion
We discussed findings from a novel framework that uses semantic network analysis as an efficient and effective way to analyze vaccine sentiment. This study adds to a growing body of vaccine hesitancy research by investigating emerging topics and the various discourse surrounding current vaccine perspectives. Findings related to significant concepts, the structure of its relations, and semantic qualities can better inform targeted vaccine communication strategies and enhance effectiveness of public health efforts to increase vaccine confidence.
Acknowledgments
Funding: This study is supported by NIH/NIGMS R01GM109718, NSF/NRT 1545362, and NSF IBSS Grant SMA-1520359. The funding sources had no role in study design; collection, analysis, and interpretation of data; writing of the paper; or the decision to submit it for publication.
Appendix A: ChatterGrabber parameters, search terms, and summary of results
ChatterGrabber search terms were selected through an iterative process involving manual selection and testing of data retrieval as detailed in [27].
A1.
Description of ChatterGrabber parameters
| Location | United States |
|---|---|
| Tweet Data | Text, ID, Time Posted, Retweet Count, Favorite Count |
| User Data | Screen Name, Language |
| Media Data | Url, Display Url |
A2.
ChatterGrabber search terms
| Conditions | Qualifiers | Exclusions |
|---|---|---|
| vaccine | autism | bullshit |
| vaccinat | autistic | penn & teller |
| vacine | conspiracy | penn and teller |
| vacinate | gave my | enter the kingdom of heaven |
| MMR | gave me | heroin |
| antivac | oprah | eye of a needle |
| aspergers | thread | |
| poison | molds | |
| jenny mccarthy | record | |
| kristin cavallari | efficacy | |
| conspiracy | shoot up | |
| mercury | needle exchange | |
| aluminum | morphine | |
| truther | knit | |
| bravo | crochet | |
| anti | fracking | |
| manufacturers | insulin | |
| have known | malware | |
| vaccine choice | pincushion | |
| your child | addict | |
| your right | fuel | |
| cancer | needlework | |
| fertility | felt | |
| constitution | caffeine | |
| risks | scaling | |
| dangerous | space |
A3.
Twitter data via ChatterGrabber
| n | |
|---|---|
| Total number of collected tweets | 26389 |
| Number of unique urls | 8416 |
| Number of unique domains | 2372 |
| Number of web articles selected for analysis | 50 |
Appendix B: Network methods
Network annotation and construction
To create document networks, article text was manually transcribed into structured belief statements, or relevant information extracted from natural language text. Similar to methods of information extraction used by the Knowledge Vault project [41], document text was formatted as triples, in which (subject, predicate, object) correspond to (node, edge, node) in the network. For example, the sentence “Vaccines prevent communicable diseases” is represented by (vaccines, prevent, communicable diseases). Three researchers initially annotated a subset of 10 documents to gauge inter-annotator variability in transcribing article documents into network datasets. All co-references were resolved and the original text was adhered to as much as possible. Discordant results were resolved through consensus in order to maintain standard formatting of network data. Final network datasets were synthesized by standardizing terminology, resolving grammatical dependencies and lexical differences in the semantic network.
The resulting standards for network vocabulary were based on term frequency. For example, synonymous nodes labeled “communicable diseases”, “infectious diseases”, and “contagious diseases”, we applied the most commonly used term across same-sentiment documents (in this case “infectious diseases”) to replace labels of all semantically equivalent nodes.
Definitions of network measures
Network size is the total number of nodes or vaccine-related concepts. Density measures the interconnectedness of nodes, calculated as the proportion of existing edges (or relations between concepts) over all possible edges in the network [42]. Diameter characterizes the compactness of the network, measured as the longest path of all shortest paths across all node pairs.
Degree centrality characterizes how connected a node is to other nodes in the network, measured by its number of connections (and normalized by the total number of network connections) [43]. Betweenness centrality measures the frequency of a given node on the shortest paths to all other pairs of connected nodes, representing the probability of a concept to be involved in connecting two other concepts in the semantic network [43,44]. Closeness centrality measures closeness, calculating the sum of the shortest paths between a node to all other nodes in the network [43]. Nodes with smaller path lengths have higher closeness centrality and are interpreted to be more important concepts than nodes with longer paths [45]. Lastly, eigenvector centrality provides a more complex measure of node influence by assigning relative scores to all concepts in the network, based on the number and quality of its relationships; a concept is significant to the extent that it is connected to other significant concepts [46].
Community detection using the Newman-Girvan algorithm detects communities by consecutively removing each edge with the highest edge betweenness from the graph [31]. Edge-betweenness refers to the number of shortest paths from one node to another that traverse through that edge. Cohesive groups in the network are measured by modularity, in which a good partition has more intra-community edges than expected at random; modularity values other than zero represent deviations from randomness [32].
Appendix C: Network visualizations
[C1-C3]: Full semantic networks of vaccine sentiment
Visualizations for full semantic networks of [C1.] positive vaccine sentiment, [C2.] negative vaccine sentiment, and [C3.] neutral vaccine sentiment. Node size represents betweenness centrality.
C1.
Full semantic network of positive vaccine sentiment.
C2.
Full semantic network of negative vaccine sentiment.
C3.
Full semantic network of neutral vaccine sentiment.
[C4-C6]: Greatest component subgraph of vaccine sentiment networks
Visualizations of the greatest component subgraph for networks of [C4.] positive vaccine sentiment, [C5.] negative vaccine sentiment, and [C6.] neutral vaccine sentiment, where increasing node size represents greater betweenness centrality.
C4.
Greatest component subgraph of the positive sentiment network.
C5.
Greatest component subgraph of the negative sentiment network.
C6.
Greatest component subgraph of the neutral sentiment network.
Appendix D: Degree centrality, betweenness centrality, closeness centrality, and eigenvector centrality
[D1-D3]: Significant vaccine concepts by centrality
Centrality characterizes the importance, influence, or power of vaccine-related concepts in the semantic network. The table lists measures for the most central concepts (greater than 2 standard deviations from the network mean) by degree centrality, betweenness centrality, closeness centrality, and eigenvector centrality for [D1.] positive sentiment, [D2.] negative sentiment, and [D3.] neutral sentiment networks.
D1.
Most central nodes and centrality measures for the positive sentiment network.
| Positive vaccine sentiment network | |||||||
|---|---|---|---|---|---|---|---|
|
| |||||||
| Degree centrality | Betweenness centrality | Closeness centrality | Eigenvector centrality | ||||
|
| |||||||
| Mean = 0.0061 | Mean = 0.006 | Mean = 0.2292 | Mean = 0.0626 | ||||
| Std Dev = 0.0107 | Std Dev = 0.0203 | Std Dev = 0.038 | Std Dev = 0.0936 | ||||
|
| |||||||
| vaccines | 0.1079 | parents | 0.2718 | parents | 0.3687 | parents | 1 |
|
| |||||||
| parents | 0.0993 | vaccines | 0.2176 | vaccines | 0.3482 | vaccines | 0.8209 |
|
| |||||||
| measles | 0.0993 | measles | 0.1546 | children | 0.3415 | measles | 0.7458 |
|
| |||||||
| vaccination | 0.0856 | anti-vaccination | 0.1261 | measles | 0.3382 | vaccination | 0.6373 |
|
| |||||||
| autism | 0.0616 | religious groups | 0.1018 | community | 0.3227 | children | 0.5382 |
|
| |||||||
| HPV vaccine | 0.0565 | vaccine-autism link | 0.0917 | religious groups | 0.3219 | SB 277 | 0.4207 |
|
| |||||||
| vaccine-autism link | 0.0531 | meningococcal disease | 0.0905 | autism | 0.3188 | autism | 0.4025 |
|
| |||||||
| meningococcal disease | 0.0531 | children | 0.0825 | SB 277 | 0.3158 | community | 0.3937 |
|
| |||||||
| anti-vaccination | 0.0479 | autism | 0.0799 | vaccine-autism link | 0.3148 | religious groups | 0.3905 |
|
| |||||||
| children | 0.0445 | HPV vaccine | 0.0732 | anti-vaccination | 0.3121 | anti-vaccination | 0.3802 |
|
| |||||||
| MMR vaccine | 0.0411 | community | 0.0574 | vaccination | 0.3100 | vaccine-autism link | 0.3608 |
|
| |||||||
| religious groups | 0.0394 | SB 277 | 0.0571 | herd immunity | 0.3058 | ||
|
| |||||||
| measles vaccine | 0.0377 | measles vaccine | 0.0523 | vaccine refusal | 0.3024 | ||
|
| |||||||
| SB 277 | 0.0342 | side effects | 0.0510 | vaccination exemption | 0.3013 | ||
|
| |||||||
| disease | 0.0308 | Gardasil | 0.0496 | personal belief exemption | 0.2909 | ||
|
| |||||||
| vaccination exemption | 0.0291 | disease | 0.2829 | ||||
|
| |||||||
| autism risk | 0.0291 | measles vaccine | 0.2706 | ||||
|
| |||||||
| schools | 0.2685 | ||||||
|
| |||||||
| HPV vaccine | 0.2674 | ||||||
|
| |||||||
| vaccine delay | 0.2603 | ||||||
|
| |||||||
| meningococcal disease | 0.2551 | ||||||
D2.
Most central nodes and centrality measures for the negative sentiment network.
| Negative vaccine sentiment network | |||||||
|---|---|---|---|---|---|---|---|
|
| |||||||
| Degree centrality | Betweenness centrality | Closeness centrality | Eigenvector centrality | ||||
|
| |||||||
| Mean = 0.0027 | Mean = 0.0033 | Mean = 0.2161 | Mean = 0.0318 | ||||
| Std Dev = 0.0058 | Std Dev = 0.0148 | Std Dev = 0.0365 | Std Dev = 0.06 | ||||
|
| |||||||
| vaccines | 0.1054 | vaccines | 0.3280 | vaccines | 0.3582 | vaccines | 1 |
|
| |||||||
| children | 0.0623 | children | 0.1889 | children | 0.3375 | children | 0.6188 |
|
| |||||||
| thimerosal | 0.0588 | CDC | 0.1274 | vaccine industry | 0.3275 | thimerosal | 0.5248 |
|
| |||||||
| CDC | 0.0527 | vaccine industry | 0.1213 | autism | 0.3249 | CDC | 0.5054 |
|
| |||||||
| vaccine industry | 0.0518 | autism | 0.1028 | mercury | 0.3245 | vaccine industry | 0.4898 |
|
| |||||||
| autism | 0.0386 | thimerosal | 0.0869 | thimerosal | 0.3209 | mercury | 0.4440 |
|
| |||||||
| doctors | 0.0351 | doctors | 0.0863 | CDC | 0.3197 | autism | 0.3894 |
|
| |||||||
| mainstream media | 0.0351 | mercury | 0.0629 | SB 277 | 0.3072 | flu shots | 0.3367 |
|
| |||||||
| mercury | 0.0334 | mainstream media | 0.0624 | mainstream media | 0.3070 | mainstream media | 0.3342 |
|
| |||||||
| flu shots | 0.0263 | mandatory vaccines | 0.0583 | flu shots | 0.3037 | doctors | 0.2862 |
|
| |||||||
| pharmaceutical companies | 0.0263 | flu shots | 0.0576 | doctors | 0.3028 | SB 277 | 0.2659 |
|
| |||||||
| mandatory vaccines | 0.0255 | pharmaceutical companies | 0.0552 | vaccine ingredients | 0.2990 | vaccine ingredients | 0.2632 |
|
| |||||||
| vaccination | 0.0237 | informed consent | 0.0485 | mandatory vaccines | 0.2969 | mandatory vaccines | 0.2457 |
|
| |||||||
| SB 277 | 0.0228 | people | 0.0474 | toxic chemical ingredients | 0.2958 | pharmaceutical companies | 0.2400 |
|
| |||||||
| United States | 0.0202 | vaccine ingredients | 0.0453 | vaccine-autism link | 0.2952 | vaccine-autism link | 0.2041 |
|
| |||||||
| measles | 0.0193 | United States | 0.0449 | vaccine safety | 0.2933 | toxic chemical ingredients | 0.1999 |
|
| |||||||
| vaccine ingredients | 0.0184 | measles | 0.0444 | intelligent questions | 0.2905 | aluminum | 0.1889 |
|
| |||||||
| informed consent | 0.0184 | vaccination | 0.0438 | vaccines are safe | 0.2895 | vaccination | 0.1853 |
|
| |||||||
| people | 0.0184 | vaccine safety | 0.0399 | monosodium glutamate | 0.1811 | ||
|
| |||||||
| pandemic H1N1 swine flu vaccine | 0.0184 | adverse effects | 0.0354 | hepatitis B vaccine | 0.1793 | ||
|
| |||||||
| Merck | 0.0184 | vaccine-injured children | 0.1763 | ||||
|
| |||||||
| measles mortality | 0.0184 | vaccine safety | 0.1721 | ||||
|
| |||||||
| evidence | 0.1655 | ||||||
|
| |||||||
| informed consent | 0.1643 | ||||||
|
| |||||||
| intelligent questions | 0.1612 | ||||||
|
| |||||||
| formaldehyde | 0.1609 | ||||||
|
| |||||||
| pregnant women | 0.1598 | ||||||
|
| |||||||
| pandemic H1N1 swine flu vaccine | 0.1595 | ||||||
|
| |||||||
| Big Pharma | 0.1591 | ||||||
|
| |||||||
| vaccines are safe | 0.1565 | ||||||
|
| |||||||
| quackery | 0.1552 | ||||||
|
| |||||||
| vaccine damage | 0.1547 | ||||||
|
| |||||||
| SV40 | 0.1545 | ||||||
|
| |||||||
| science | 0.1531 | ||||||
D3.
Most central nodes and centrality measures for the neutral vaccine network.
| Neutral vaccine sentiment network | |||||||
|---|---|---|---|---|---|---|---|
|
| |||||||
| Degree centrality | Betweenness centrality | Closeness centrality | Eigenvector centrality | ||||
|
| |||||||
| Mean = 0.0149 | Mean = 0.0342 | Mean = 0.1533 | Mean = 0.0975 | ||||
| Std Dev = 0.0204 | Std Dev = 0.0839 | Std Dev = 0.0296 | Std Dev = 0.11 | ||||
|
| |||||||
| SB 277 | 0.1824 | vaccines | 0.5749 | vaccines | 0.2335 | SB 277 | 1 |
|
| |||||||
| vaccines | 0.1118 | Dwoskin Family Foundation | 0.4092 | side effects | 0.2208 | vaccines | 0.4304 |
|
| |||||||
| anti-vaccination | 0.1059 | pertussis vaccine | 0.3947 | pertussis vaccine | 0.2199 | anti-vaccination | 0.4177 |
|
| |||||||
| pertussis vaccine | 0.0824 | vaccine-autism link | 0.3620 | whole-cell vaccine | 0.2133 | parents | 0.3863 |
|
| |||||||
| pertussis | 0.0824 | SB 277 | 0.3294 | effective | 0.2133 | children | 0.3830 |
|
| |||||||
| high-dose flu vaccine | 0.0647 | children | 0.2643 | pertussis vaccine | 0.3540 | ||
|
| |||||||
| anti-vaccination | 0.2554 | home-school | 0.3209 | ||||
|
| |||||||
| side effects | 0.2347 | education | 0.3206 | ||||
|
| |||||||
| acellular pertussis vaccine | 0.2077 | ||||||
D4.
Top ranked nodes by closeness vitality for the three networks
| Closeness vitality | |||||
|---|---|---|---|---|---|
|
| |||||
| Negative sentiment network | Neutral sentiment network | Positive sentiment network | |||
|
| |||||
| Mean = 19148.407 | Mean = 7029.871 | Mean = 8449.754 | |||
| Std Dev = 24052.786 | Std Dev = 16597.291 | Std Dev = 9778.734 | |||
|
| |||||
| thimerosal | 239154 | vaccines | 127564 | meningococcal disease | 79948 |
|
| |||||
| MTHFR C677T defect | 222220 | Dwoskin Family Foundation | 109972 | vaccination | 77396 |
|
| |||||
| millions of dollars | 210944 | vaccine-autism link | 100468 | polio vaccine opposition | 74438 |
|
| |||||
| children with autism | 201122 | SB 277 | 49768 | Wakefield study | 64018 |
|
| |||||
| measles mortality | 179468 | acellular pertussis vaccine | 48048 | HPV vaccine | 63748 |
|
| |||||
| vaccine court | 172456 | artificial vaccine | 43430 | vaccines | 61934 |
|
| |||||
| National Vaccine Injury Compensation Program | 168948 | anti-vaccination | 41638 | autism | 61016 |
|
| |||||
| anti-vaccination | 145200 | Generation Rescue | 37594 | orthodox Hasidic Jews | 55846 |
|
| |||||
| measles | 141736 | immune response | 34424 | measles | 47038 |
|
| |||||
| adverse effects | 141140 | Focus for Health | 32640 | hepatitis A vaccine | 44804 |
Appendix E: Data files
Data files and dynamic web-based interactive visualizations of semantic networks can be accessed online at: http://staff.vbi.vt.edu/swarup/vaccine_sentiment/.
Footnotes
Publisher's Disclaimer: This is a PDF file of an unedited manuscript that has been accepted for publication. As a service to our customers we are providing this early version of the manuscript. The manuscript will undergo copyediting, typesetting, and review of the resulting proof before it is published in its final citable form. Please note that during the production process errors may be discovered which could affect the content, and all legal disclaimers that apply to the journal pertain.
Conflicts of Interest: None
References
- 1.Zipprich J, Winter K, Hacker J, Xia D, Watt J, Harriman K, et al. Measles outbreak--California, December 2014-February 2015. MMWR Morb Mortal Wkly Rep. 2015;64:153–4. [PMC free article] [PubMed] [Google Scholar]
- 2.Peretti-Watel P, Patrick P-W, Ward JK, Schulz WS, Pierre V, Larson HJ. Vaccine Hesitancy: Clarifying a Theoretical Framework for an Ambiguous Notion. PLoS Curr. 2015 doi: 10.1371/currents.outbreaks.6844c80ff9f5b273f34c91f71b7fc289. [DOI] [PMC free article] [PubMed] [Google Scholar]
- 3.Kang GJ, Culp RK, Abbas KM. Facilitators and barriers of parental attitudes and beliefs toward school-located influenza vaccination in the United States: Systematic review. Vaccine. 2017 doi: 10.1016/j.vaccine.2017.03.014. [DOI] [PMC free article] [PubMed] [Google Scholar]
- 4.Dubé E, Gagnon D, MacDonald NE SAGE Working Group on Vaccine Hesitancy. Strategies intended to address vaccine hesitancy: Review of published reviews. Vaccine. 2015;33:4191–203. doi: 10.1016/j.vaccine.2015.04.041. [DOI] [PubMed] [Google Scholar]
- 5.Betsch C, Böhm R. Detrimental effects of introducing partial compulsory vaccination: experimental evidence. Eur J Public Health. 2015 doi: 10.1093/eurpub/ckv154. [DOI] [PubMed] [Google Scholar]
- 6.Betsch C, Bohm R, Chapman GB. Using Behavioral Insights to Increase Vaccination Policy Effectiveness. Policy Insights from the Behavioral and Brain Sciences. 2015;2:61–73. [Google Scholar]
- 7.Larson HJ, Cooper LZ, Eskola J, Katz SL, Ratzan S. Addressing the vaccine confidence gap. Lancet. 2011;378:526–35. doi: 10.1016/S0140-6736(11)60678-8. [DOI] [PubMed] [Google Scholar]
- 8.Jarrett C, Wilson R, O’Leary M, Eckersberger E, Larson HJ SAGE Working Group on Vaccine Hesitancy. Strategies for addressing vaccine hesitancy - A systematic review. Vaccine. 2015;33:4180–90. doi: 10.1016/j.vaccine.2015.04.040. [DOI] [PubMed] [Google Scholar]
- 9.Hausman B. Vaccination and the Public in the 21st Century. 2016 [Google Scholar]
- 10.Lawrence HY, Hausman BL, Dannenberg CJ. Reframing Medicine’s Publics: The Local as a Public of Vaccine Refusal. J Med Humanit. 2014;35:111–29. doi: 10.1007/s10912-014-9278-4. [DOI] [PubMed] [Google Scholar]
- 11.Luke DA, Harris JK. Network analysis in public health: history, methods, and applications. Annu Rev Public Health. 2007;28:69–93. doi: 10.1146/annurev.publhealth.28.021406.144132. [DOI] [PubMed] [Google Scholar]
- 12.Salathé M, Bonhoeffer S. The effect of opinion clustering on disease outbreaks. J R Soc Interface. 2008;5:1505–8. doi: 10.1098/rsif.2008.0271. [DOI] [PMC free article] [PubMed] [Google Scholar]
- 13.Salathe M, Bengtsson L, Bodnar TJ, Brewer DD, Brownstein JS, Buckee C, et al. Digital epidemiology. PLoS Comput Biol. 2012;8:e1002616. doi: 10.1371/journal.pcbi.1002616. [DOI] [PMC free article] [PubMed] [Google Scholar]
- 14.Dredze M, Broniatowski DA, Smith MC, Hilyard KM. Understanding Vaccine Refusal. Am J Prev Med. 2016;50:550–2. doi: 10.1016/j.amepre.2015.10.002. [DOI] [PMC free article] [PubMed] [Google Scholar]
- 15.Salathé M, Khandelwal S. Assessing vaccination sentiments with online social media: implications for infectious disease dynamics and control. PLoS Comput Biol. 2011;7:e1002199. doi: 10.1371/journal.pcbi.1002199. [DOI] [PMC free article] [PubMed] [Google Scholar]
- 16.Salathé M, Vu DQ, Khandelwal S, Hunter DR. The dynamics of health behavior sentiments on a large online social network. EPJ Data Sci. 2013;2:4. [Google Scholar]
- 17.Gloor P, Diesner J. Semantic Social Networks. Encyclopedia of Social Network Analysis and Mining. Springer; 2014. pp. 1654–9. [Google Scholar]
- 18.Eklund PW, Haemmerlé O. Conceptual Structures: Knowledge Visualization and Reasoning; 16th International Conference on Conceptual Structures; ICCS. 2008. pp. 7–11. [Google Scholar]
- 19.Doerfel ML. What constitutes semantic network analysis? A comparison of research and methodologies. Connect. 1998 [Google Scholar]
- 20.Ruiz JB, Barnett GA. Exploring the presentation of HPV information online: A semantic network analysis of websites. Vaccine. 2015;33:3354–9. doi: 10.1016/j.vaccine.2015.05.017. [DOI] [PubMed] [Google Scholar]
- 21.Ruiz JB, Bell RA. Understanding vaccination resistance: vaccine search term selection bias and the valence of retrieved information. Vaccine. 2014;32:5776–80. doi: 10.1016/j.vaccine.2014.08.042. [DOI] [PubMed] [Google Scholar]
- 22.Drieger P. Semantic Network Analysis as a Method for Visual Text Analytics. Procedia - Social and Behavioral Sciences. 2013;79:4–17. [Google Scholar]
- 23.Poland CM, Brunson EK. The need for a multi-disciplinary perspective on vaccine hesitancy and acceptance. Vaccine. 2015;33:277–9. doi: 10.1016/j.vaccine.2014.11.022. [DOI] [PubMed] [Google Scholar]
- 24.Larson H, Leask J, Aggett S, Sevdalis N, Thomson A. A Multidisciplinary Research Agenda for Understanding Vaccine-Related Decisions. Vaccines. 2013;1:293–304. doi: 10.3390/vaccines1030293. [DOI] [PMC free article] [PubMed] [Google Scholar]
- 25.Thovex C, Trichet F. Semantic social networks analysis. Soc Netw Anal Min. 2012;3:35–49. [Google Scholar]
- 26. [accessed April 25, 2017];Revised report of the SAGE Working Group on Vaccine Hesitancy. http://www.who.int/immunization/sage/meetings/2014/october/SAGE_working_group_revised_report_vaccine_hesitancy.pdf?ua=1.
- 27.Schlitt JT, Lewis B, Eubank S. ChatterGrabber: A Lightweight Easy to Use Social Media Surveillance Toolkit. Online J Public Health Inform. 2015:7. [Google Scholar]
- 28.Wasserman S, Faust K. Social Network Analysis: Methods and Applications. Cambridge University Press; 1994. [Google Scholar]
- 29.Van Steen M. Graph theory and complex networks. 2010 di.unipi.it. [Google Scholar]
- 30.Freeman LC. Centrality in social networks conceptual clarification. Soc Networks. 1978;1:215–39. [Google Scholar]
- 31.Newman MEJ, Girvan M. Finding and evaluating community structure in networks. Phys Rev E Stat Nonlin Soft Matter Phys. 2004;69:026113. doi: 10.1103/PhysRevE.69.026113. [DOI] [PubMed] [Google Scholar]
- 32.Fortunato S. Community detection in graphs. Phys Rep. 2010;486(2):75–174. [Google Scholar]
- 33.Batagelj V, Zaversnik M. An O(m) Algorithm for Cores Decomposition of Networks. arXiv [csDS] 2003 [Google Scholar]
- 34.Burscher B, Vliegenthart R, de Vreese CH. Frames Beyond Words. Soc Sci Comput Rev. 2016;34:530–45. [Google Scholar]
- 35.Schult DA, Swart P. Exploring network structure, dynamics, and function using NetworkX. 2008 permalink.lanl.gov.
- 36.Csardi G, Nepusz T. The igraph software package for complex network research. InterJournal, Complex Systems. 2006;1695:1–9. [Google Scholar]
- 37.Bastian M, Heymann S, Jacomy M. Gephi: an open source software for exploring and manipulating networks. 2009 aaai.org.
- 38.An act to amend Sections 120325, 120335, 120370, and 120375 of, to add Section 120338 to, and to repeal Section 120365 of, the Health and Safety Code, relating to public health. n.d.
- 39.Goldstein S, MacDonald NE, Guirguis S SAGE Working Group on Vaccine Hesitancy. Health communication and vaccine hesitancy. Vaccine. 2015;33:4212–4. doi: 10.1016/j.vaccine.2015.04.042. [DOI] [PubMed] [Google Scholar]
- 40.Miton H, Mercier H. Cognitive Obstacles to Pro-Vaccination Beliefs. Trends Cogn Sci. 2015;19:633–6. doi: 10.1016/j.tics.2015.08.007. [DOI] [PubMed] [Google Scholar]
- 41.Dong X, Gabrilovich E, Heitz G, Horn W, Lao N, Murphy K, et al. Knowledge Vault: A Web-scale Approach to Probabilistic Knowledge Fusion; Proceedings of the 20th ACM SIGKDD International Conference on Knowledge Discovery and Data Mining; New York, NY, USA: ACM. 2014. pp. 601–10. [Google Scholar]
- 42.Wasserman S, Faust K. Social Network Analysis: Methods and Applications. Cambridge University Press; 1994. [Google Scholar]
- 43.Freeman LC. Centrality in social networks conceptual clarification. Soc Networks. 1978;1:215–39. [Google Scholar]
- 44.Wasserman S, Faust K. Social Network Analysis: Methods and Applications. Cambridge University Press; 1994. [Google Scholar]
- 45.Raad E, Chbeir R. Socio-Graph Representations, Concepts, Data, and Analysis. In: Alhajj PR, Rokne PJ, editors. Encyclopedia of Social Network Analysis and Mining. Springer; New York: 2014. pp. 1936–46. [Google Scholar]
- 46.Heymann S, Gephi . In: Encyclopedia of Social Network Analysis and Mining. Alhajj PR, Rokne PJ, editors. Springer; New York: 2014. pp. 612–25. [Google Scholar]
- 47.Sowa JF. Semantic Networks. Encyclopedia of Cognitive Science. John Wiley & Sons, Ltd; 2006. [Google Scholar]
- 48.Biasio LR, Corsello G, Costantino C, Fara GM, Giammanco G, Signorelli C, et al. Communication about vaccination: A shared responsibility. Hum Vaccin Immunother. 2016;12:2984–7. doi: 10.1080/21645515.2016.1198456. [DOI] [PMC free article] [PubMed] [Google Scholar]
- 49.Koschützki D, Lehmann KA, Peeters L, Richter S, Tenfelde-Podehl D, Zlotowski O. Centrality Indices. In: Brandes U, Erlebach T, editors. Network Analysis. Springer-Verlag; 2005. pp. 16–61. [Google Scholar]
- 50.Anderson JR. A Spreading Activation Theory of Memory. Journal of Verbal Learning and Verbal Behavior. 1983;22:261–95. [Google Scholar]
- 51.Dell GS. A Spreading-Activation Theory of Retrieval in Sentence Production. Psychological Review. 1986;93:283–321. [PubMed] [Google Scholar]
- 52.Liben-Nowell D, Kleinberg J. The Link Prediction Problem for Social Networks. Journal of the American Society for Information Science and Technology. 2007;58:1019–31. [Google Scholar]
- 53.Collins AM, Quillian MR. Retrieval Time from Semantic Memory. Journal of Verbal Learning and Verbal Behavior. 1969;8:240–7. [Google Scholar]
- 54.Collins AM, Loftus EF. A Spreading-Activation Theory of Semantic Processing. Psychological Review. 1975;82:407–28. [Google Scholar]
- 55.Fazio RH, Sanbonmatsu DM, Powell MC, Kardes FR. On the Automatic Activation of Attitudes. Journal of Personality and Social Psychology. 1986;50:229–38. doi: 10.1037//0022-3514.50.2.229. [DOI] [PubMed] [Google Scholar]


