

Summary
Emerging studies have linked the ribosome to more selective control of gene regulation. However, an outstanding question is whether ribosome heterogeneity at the level of core ribosomal proteins (RPs) exists and enables ribosomes to preferentially translate specific mRNAs genome-wide. Here, we measured the absolute abundance of RPs in translating ribosomes and profiled transcripts that are enriched or depleted from select subsets of ribosomes within embryonic stem cells. We find that heterogeneity in RP composition endows ribosomes with differential selectivity for translating subpools of transcripts including those controlling metabolism, cell cycle, and development. As an example, mRNAs enriched in binding to RPL10A/uL1-containing ribosomes are shown to require RPL10A/uL1 for their efficient translation. Within several of these transcripts, this level of regulation is mediated, at least in part, by internal ribosome entry sites. Together, these results reveal a critical functional link between ribosome heterogeneity and the post-transcriptional circuitry of gene expression.
Graphical abstract

Introduction
In the flow of biological information from mRNA to protein, the ribosome has been perceived to decode the genome with machine-like precision; serving as an integral but largely passive participant in the synthesis of proteins across all kingdoms of life. However, emerging studies have revealed unexpected and selective roles for some of the 80 core ribosomal proteins (RPs), belonging to eukaryotic ribosomes in cell homeostasis and organismal development (Shi and Barna, 2015). For example, a core RP of the ribosomal large subunit, RPL38/eL38, is required for the accurate formation of the mammalian body plan and RPL38/eL38 hypomorphic mice show numerous homeotic transformations (Kondrashov et al., 2011). The ability of RPL38/eL38 to promote selective translational control of Homeobox (Hox) mRNAs is mediated through Internal Ribosome Entry Site (IRES) elements present in their 5′ untranslated regions (5′UTRs), revealing a specialized function for this RP in translational control and tissue patterning (Xue et al., 2015). Moreover, a growing number of human disorders, collectively known as ribosomopathies, are associated with mutations in ribosome components and have highly specific pathologies affecting selective organs or cell types (Narla and Ebert, 2010). This includes Diamond-Blackfan anemia (DBA), in which mutations in certain RPs lead to bone marrow failure due to a defect in differentiation of hematopoietic stem cells along the erythroid lineage, as well as distinct spectrums of congenital birth defects (Boria et al., 2010). Mutations of other RPs have been linked to additional stem cell-specific defects (loss of body hair associated with mutations in RPL21/eL21 (Zhou et al., 2011) and several human cancers, including T-cell acute lymphoblastic leukemia (T-ALL) (characterized by mutations in RPL5/uL18 and RPL10/uL16 within early T cell progenitors (De Keersmaecker et al., 2013)). Changes in RP transcript levels have also been observed among different cell and tissue types (Guimaraes and Zavolan, 2016; Kondrashov et al., 2011), suggesting that ribosomes may vary in composition. In fact, it is the tissues with high expression levels of Rpl38/eL38 transcripts that present with phenotypes in the haploinsufficient Rpl38/eL38 mouse model (Kondrashov et al., 2011). Together, these studies lent support to the hypothesis that ‘specialized ribosomes’ harboring unique functional activities may shape key events in gene regulation, stem cell biology, and organismal development (Dinman, 2015; Xue and Barna, 2012).
Despite the emerging studies of more selective control of gene regulation by the ribosome, there is a lack of experimental data to precisely quantify the absolute abundance of RPs within translationally active ribosomes. Most importantly, direct evidence for ribosome heterogeneity at the level of core RPs and its functional impact on gene regulation genome-wide is lacking. In this study, we applied a quantitative mass spectrometry (MS) approach to measure the absolute abundance of subsets of core RPs and identified heterogeneous compositions of translationally active ribosomes within mouse embryonic stem cells (mESCs). By endogenously tagging and translationally profiling a selective subset of heterogeneous ribosomes, we find that ribosomes containing RPS25/eS25 or RPL10A/uL1 preferentially translate certain subpools of transcripts, including mRNAs encoding key components in metabolism, the cell cycle process, and development. Importantly, we further characterize RPL10A/uL1-containing ribosomes as an example. We find that the subset of mRNAs found preferentially bound by RPL10A/uL1-containing ribosomes is more sensitized to RPL10A/uL1 levels for their efficient translation. For at least several of these mRNAs, this specificity and unique translational regulation by RPL10A/uL1 is mediated by IRES elements embedded in the transcripts' 5′UTRs, revealing the importance of cis-regulatory elements in this mode of selective mRNA translation. Together, these findings reveal a biologically meaningful link between ribosome heterogeneity and specificity in translational control of the mammalian genome.
Results
Translationally Competent Heterogeneous Ribosomes Exist in a Single Cell Type
We chose to characterize ribosome composition within mESCs, which represent a pluripotent and largely homogenous cell population, serving as a ground state to study ribosome heterogeneity. To determine the exact stoichiometry of RPs in mESCs ribosomes, we employed absolute protein quantification using selected reaction monitoring (SRM)-based proteomics (Picotti and Aebersold, 2012). Briefly, SRM utilizes a known amount of heavy isotope-labeled peptide spiked in the sample as a standard for absolute quantification. After trypsin digestion, the light peptides digested from endogenous proteins together with heavy peptide standards are analyzed on a triple quadrupole mass spectrometer, during which the peptides are fragmented to generate transition ions whose intensity are quantified by the detector. Absolute peptide amount can therefore be quantified from the ratio of the transition fragment peak integrals of the corresponding light and heavy peptides (Figure 1A) (Lange et al., 2008; Picotti and Aebersold, 2012).
Figure 1. Absolute quantification of RP stoichiometry reveals heterogeneous populations of actively translating ribosomes within mESCs.

(A) Schematic of the absolute quantification of RP abundance by Selected Reaction Monitoring (SRM). LC-ESI: liquid chromatography-electrospray ionization. (B) Stoichiometry of RPs quantified by SRM in polysomes isolated from sucrose gradient fractionation. The mean and standard deviation (SD) of quantifications from five biological replicates are shown. **: p<0.05 (t-test) and stoichiometry<0.8 (an arbitrary cutoff, marked as a dotted line). *: p<0.05 (t-test) and stoichiometry<1. (C) Left: formaldehyde cross-linking of RPs and rRNAs to avoid the possibility of any RP loss during the polysome fractionation. Right: Western Blot showing the amount of EIF3B, EIF3D, EIF3H, as well as RPS5/uS7 and RPL31/eL31 in purified polysome samples with and without formaldehyde cross-linking. EIF3B, EIF3D and EIF3H belonging to the eIF3 initiation complex are much more tightly associated with the translating ribosomes upon formaldehyde cross-linking. RPS5/uS7 and RPL31/eL31 are controls for loading. (D) Stoichiometry of RPs quantified by SRM in polysomes with formaldehyde cross-linking. The mean and SD of quantifications from three biological replicates are shown. **: p<0.05 (t-test) and stoichiometry<0.8 (an arbitrary cutoff, marked as a dotted line). (B) and (D): One to three peptides per protein were quantified, and the median value of the peptides for the same protein was used to represent its abundance. The stoichiometry of each RP was determined by normalizing its absolute quantification value to the average of RPL6/eL6 and RPL7A/eL8 for large subunit proteins or the average of RPS2/uS5 and RPS8/eS8 for small subunit proteins, which are shown as dotted bars. The quantification for large subunit proteins is shown in light orange and small subunit proteins is shown in light green. (E) Substoichiometric RPs are color-coded with blue, shown on a structural model of the human ribosome with all other RPs in light grey (Anger et al., 2013) (PDB files 4V6X). The 28S, 5S and 5.8S rRNAs are shown in light orange, and 18S rRNA is shown in light green. An enlarged view of the mRNA exit tunnel is shown on the right panel, with rRNAs removed for simplicity. See also Figure S1, Movie S1M and Table S1.
Since RPs are generally small proteins (median of ∼150 amino acids) with relatively few proteotypic peptides, it proved challenging to identify surrogate peptides optimal for the absolute quantification of all RPs. Moreover, considering the high cost associated with the synthesis of heavy peptide standards, we prioritized a subset of RPs to be quantified. Our SRM quantification included RPs that are known to exert more specialized functions (RPL38/eL38, RPL40/eL40, RPS25/eS25, RACK1/RACK1) (Kondrashov et al., 2011; Landry et al., 2009; Lee et al., 2013; Majzoub et al., 2014), RPs implicated in DBA (RPL11/uL5, RPS7/eS7, RPS26/eS26) (Boria et al., 2010), and others (RPL4/uL4, RPL6/eL6, RPL7A/eL8, RPL10A/uL1, RPL13/eL13, RPL28/eL28, RPS2/uS5, RPS8/eS8) that yielded unique peptides with specific and robust signals in a triple quadrupole MS (Table S1). In a serial dilution experiment, good agreement between the observed and expected signal ratios of the light and heavy peptides ensured that the quantitative measurements by SRM are within the linear dynamic range (Figure S1A). At least two peptides were used as surrogate for each of the 11 RPs quantified (Table S1). For 4 additional RPs, where only one surrogate peptide could be optimized for SRM, we performed siRNA knockdown assays for these RPs and subsequent SRM quantitative measurements as a further validation of the uniqueness and specificity of the peptide and SRM transitions (Figure S1B and S1C).
To study the composition of translationally active ribosomes, we isolated ribosomes from polysomes, clusters of ribosomes bound along an mRNA molecule in the act of translation, by sucrose gradient fractionation. Of our panel of RPs quantified, five large subunit proteins (RPL6/eL6, RPL7A/eL8, RPL4/uL4, RPL13/eL13 and RPL28/eL28) as well as four small subunit proteins (RPS2/uS5, RPS8/eS8, RPS26/eS26 and RACK1/RACK1) exhibited very similar quantities (Figure 1B), thereby representing core RPs that are likely to be invariably present in every translating ribosome within mESCs. Strikingly, however, four RPs (RPL10A/uL1, RPL38/eL38, RPS7/eS7 and RPS25/eS25) are significantly substoichiometric in polysomes (p<0.05 and stoichiometry≈0.6-0.7) from five biological replicates (Figure 1B), indicating a ∼30-40% depletion of these RPs. To ensure that sample preparation did not indirectly contribute to a decrease in RP abundance evident in ribosomes from polysome fractions, we employed formaldehyde treatment to cross-link RPs to rRNA prior to cell lysis (Figure 1C). We confirmed that the cross-linking procedure was efficient. For instance, we observe that the association of eukaryote translation initiation factor 3 (eIF3) components, such as EIF3B, EIF3D and EIF3H, with translating ribosomes was significantly stabilized upon formaldehyde cross-linking (Figure 1C), consistent with previously published studies (Valášek et al., 2007). Importantly, all of our initial RPs found to be of lower abundance measured by SRM similarly remained substoichiometric in polysomes (p<0.05) following cross-linking (Figure 1D). Together, the absolute quantification of RPs by SRM reveals heterogeneity in ribosome composition within a single cell type (Figure 1E).
To further survey for RP heterogeneity with a wider scope beyond the 15 RPs quantified by SRM, we performed relative quantification of 76 out of 80 RPs by MS using the tandem mass tag (TMT) technology (Thompson et al., 2003). Unlike absolute quantification by SRM, the relative quantification by TMT requires a reference point for comparative analysis, and we therefore compared the abundance of RPs within polysomes to the free ribosomal subunits, 40S for the small subunit proteins or 60S for the large subunit proteins (Figure 2A and 2B). Although the vast majority of RPs exhibit nearly the same abundance, we observed a total of seven RPs that were either higher (RPL10/uL16, RPL38/eL38, RPL40/eL40, RPS26/eS26) or lower (RPL10A/uL1, RPS7/eS7, RPS25/eS25) in abundance within polysome fractions compared to free subunits (N=7, p<0.05) (Figure 2C and 2D)(Table S2). The identification of RPL10A/uL1, RPS7/eS7 and RPS25/eS25 being substoichiometric in polysomes by both SRM and TMT provides orthogonal evidence that a fraction of translationally competent ribosomes lack one or more of these RPs. Furthermore, although the relative level of RPL38/eL38 is lower in the 60S compared to polysomes by relative quantification using TMT (Figure 2D), it is clearly substoichiometric in polysomes as revealed by the absolute quantification using SRM (Figure 1B and 1D). Since within a single cell type, a reference point is needed for relative protein quantification by TMT, further RP heterogeneity (in addition to that evident between free ribosomal subunits and ribosomes in polysomes) as evidenced for RPL38/eL38 may be present within polysome fractions that can only be determined by SRM. In addition, recent studies have suggested that most 80S monosomes are also active in translation (Heyer and Moore, 2016), and RP abundance may also be further different between the 80S monosome and polysome fractions (Slavov et al., 2015). Together, our studies reveal heterogeneity in translationally competent ribosomes within a single cell type as well as further differences in RP composition between the free subunits and translationally active ribosomes.
Figure 2. The relative quantification of RPs reveals differences in RP abundance between the free subunits and translationally active ribosomes.
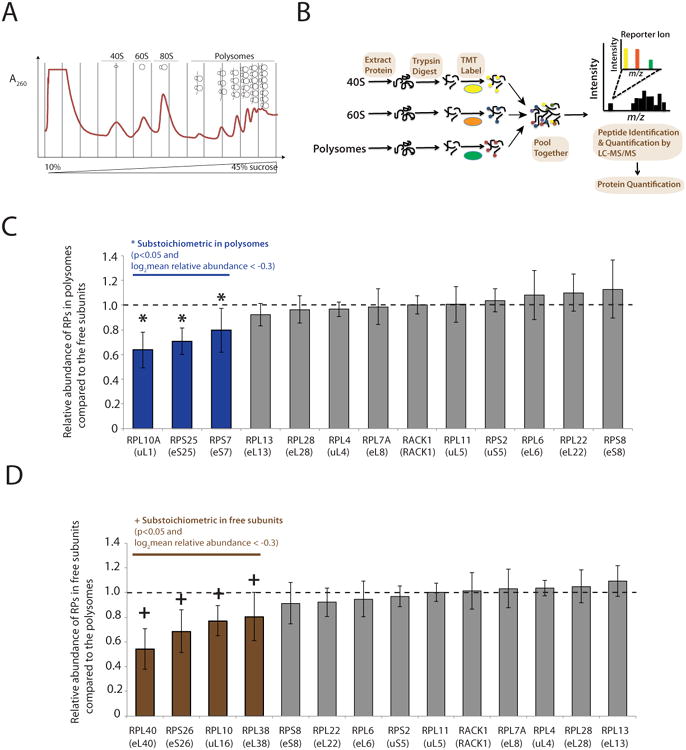
(A) Separating cytoplasmic ribosomes into distinct functional classes through a 10-45% sucrose gradient fractionation. (B) Schematic of the workflow for quantifying ribosome composition by quantitative mass spectrometry using tandem mass tag (TMT). Purified ribosomes from 40S, 60S, and polysomes were digested into peptides, labeled with a distinct TMT, mixed equally, and subjected to MS/MS analysis for multiplex quantification. (C) Shown are the relative abundance of RPs in polysomes compared to their levels in the 40S or 60S free subunits. The mean and standard deviation (SD) from seven biological replicates are shown. *: Three RPs (blue) are substoichiometric in polysomes: p<0.05 (t-test) and at least 20% lower relative abundance in polysomes (log2mean relative abundance < -0.3). Several representative RPs exhibiting nearly the same abundance are also displayed in grey. (D) Shown are the relative abundance of RPs in the 40S or 60S free subunits compared to their levels in the polysomes. The mean and SD from seven biological replicates are shown. +: Four RPs (brown) are substoichiometric in the free subunits: p<0.05 (t-test) and at least 20% lower relative abundance in the free subunits (log2mean relative abundance < -0.3). Several representative RPs exhibiting nearly the same abundance are also displayed in grey. See also Table S2.
Heterogeneous Ribosomes Preferentially Translate Distinct Subsets of mRNAs Genome-Wide
An immediate question is what, if any, function could be attributed to ribosome heterogeneity with respect to translational control genome-wide. The heterogeneous RPs identified by SRM are positioned on the surface of the ribosome in important functional regions including the mRNA exit tunnel and the L1 stalk (Figure 1E and Movie S1) and thus could make direct contacts with mRNAs (Boehringer et al., 2005; Spahn et al., 2004). We therefore chose RPS25/eS25 and RPL10A/uL1, which flank the mRNA exit tunnel, as examples of substoichiometric RPs to address the potential biological meaning of ribosome heterogeneity for the translational regulation of the mammalian genome. We first employed CRISPR/Cas9-mediated genome editing to endogenously tag these RPs within mESCs (Cong et al., 2013; Jinek et al., 2012; Mali et al., 2013) generating two mESC lines harboring either a Rps25/eS25-3xFLAG allele or a 3xFLAG-Rpl10a/uL1 allele. Of note, although affinity purification of RPL10A/uL1-tagged ribosomes has been previously reported (Ekstrand et al., 2014; Heiman et al., 2008), this was in the context of transgenic constructs and is therefore distinct from the endogenously tagged Rpl10a/uL1 allele generated here. To test whether the FLAG-tagged RPs are incorporated into functional ribosomes similarly to endogenous RPs, we performed Western Blot analysis of sucrose gradient fractions. This revealed a normal incorporation and distribution of FLAG tagged RPs into ribosomal subunits and translationally active polysomes similar to the corresponding endogenous RPs (Figure S2). We next adapted the ribosome profiling method to quantify and compare the mRNAs that are actively engaged or depleted from RPS25/eS25 or RPL10A/uL1 containing ribosomes. Ribosome profiling employs deep sequencing of ‘ribosome footprints’-- mRNA fragments protected from RNase digestion by virtue of ribosome binding--for a quantitative analysis of mRNA translation at single codon precision (Ingolia et al., 2009). To identify mRNAs bound by ribosomes containing RPS25/eS25-3xFLAG or 3xFLAG-RPL10A/uL1, we included a FLAG-immunoprecipitation (IP) step in our ribosome profiling protocol (workflow in Figure 3A), and mRNA fragments protected by each type of ribosome were termed ‘RPS25/eS25-Ribo-Seq’ and ‘RPL10A/uL1-Ribo-Seq’ respectively. In parallel, we deep sequenced mRNA fragments protected by total ribosomes in mESCs using conventional ribosome profiling. For each type of Ribo-Seq library, we generated two biological replicates, which were highly consistent with each other (Pearson's r ≈0.99).
Figure 3. Ribosomes with specific RP compositions selectively translate distinct subpools of mRNAs.

(A) Schematic of immunoprecipitation (IP) and subsequent ribosome profiling of endogenously tagged RPS25/eS25- (left) or RPL10A/uL1- (right) containing ribosomes. Ribosome profiling (Ribo-Seq) of total ribosomes was performed in parallel as a control. (B) Upper: Comparison of RPS25/eS25-Ribo-Seq to the total Ribo-Seq. The densities of ribosome footprints on each protein-coding gene are calculated as Reads Per Kilobase per Million mapped reads (RPKM). The average RPKM of two biological replicates are shown. Lower: Compared to the total RiboSeq, genes having log2FC>0.75 or log2FC <-0.75 (FC: fold change) with FDR<0.05 in the RPS25/eS25-Ribo-Seq are defined as enriched (red) or depleted (blue) respectively. The numbers of genes in each category (enriched, no difference, depleted) were shown in the parentheses. (C) Comparison of RPL10A/uL1-Ribo-Seq to the total Ribo-Seq as in (B). (D) Comparison of RPL22/eL22-Ribo-Seq to the total Ribo-Seq as in (B). (E) Significantly enriched GO (Gene Ontology) categories (padj<0.05) among transcripts that are depleted or enriched in RPS25/eS25-Ribo-Seq (left) or RPL10A/uL1-Ribo-Seq (right). Enriched GO categories (padj<0.05) analyzed using the Manteia tool (Tassy and Pourquié, 2014) are rank-ordered by the number of associated genes, and the top five GO categories are shown. The number of associated genes in each GO category is shown in parentheses. See also Figure S2, Figure S3, Table S3 and Table S4.
The overall distributions of ribosome footprints on the 5′UTR (untranslated region), CDS (coding DNA sequence) and 3′UTR of all protein-coding genes are ∼9%, 90% and 1% respectively and are very similar for all libraries (Figure S3A). We then focused our analysis on the coding region and counted the total number of ribosome footprints on the CDS of each gene. Interestingly, compared to the total Ribo-Seq, there are sets of transcripts reproducibly having higher or lower numbers of ribosome footprints in RPS25/eS25-Ribo-Seq or RPL10A/uL1-Ribo-Seq (Figure 3B and Figure 3C). We call these sets of transcripts ‘RPS25/eS25-Ribo-Seq enriched' (109 genes), ‘RPS25/eS25-Ribo-Seq depleted’ (55 genes), ‘RPL10A/uL1-Ribo-Seq enriched’ (215 genes) and ‘RPL10A/uL1-Ribo-Seq depleted’ (182 genes), respectively (Table S3 and S4). These transcripts are statistically significant (FDR<0.05) and meet a threshold of fold change (FC) (log2FC>0.75 or <-0.75) when compared to the total Ribo-Seq (Figure 3B and Figure 3C bottom). The fold change of enrichment or depletion of transcripts in the RPS25/eS25-Ribo-Seq and RPL10A/uL1-Ribo-Seq over the background is a rather stringent cutoff and significant indication of selectivity in translation by ribosomes harboring or missing RPS25/eS25 and RPL10A/uL1. This is particularly noteworthy as the majority of ribosomes contain RPL10A/uL1 and RPS25/eS25 in the total Ribo-Seq background as quantified by SRM (Figure 1B) and supported by the fact that RPS25/eS25-Ribo-Seq and RPL10A/uL1-Ribo-Seq are largely correlated (Figure S3B). As a control, we performed similar experiments with an endogenously HA-tagged RPL22/eL22 mESC line, derived from the Rpl22HA RiboTag transgenic mouse (Sanz et al., 2009) as RPL22/eL22, unlike RPS25/eS25 and RPL10A/uL, shows no difference in its relative abundance by TMT analysis (Figure 2C and 2D). In contrast to the pattern of enriched and depleted transcripts evident in the RPL10A/uL1 and RPS25/eS25 Ribo-Seq, almost no transcripts were found to be enriched or depleted in RPL22/eL22-Ribo-Seq compared to the total Ribo-Seq (Figure 3D). Furthermore, the enriched or depleted sets of transcripts identified by RPS25/eS25-Ribo-Seq and RPL10A/uL1-Ribo-Seq generally do not exhibit preferential enrichment or depletion in RPL22/eL22-Ribo-Seq (Figure S3C and 3D).
Interestingly, the enriched or depleted sets of transcripts identified by RPS25/eS25-RiboSeq and RPL10A/uL1-Ribo-Seq are largely non-overlapping (Figure S3E), and belong to different Gene Ontology (GO) categories (Figure 3E). The RPL10A/uL1-Ribo-Seq enriched transcripts are significantly represented by interacting genes (p<0.01) clustering into several functional groups, including those important for the extracellular matrix (ECM) organization and glycosphingolipid metabolic process (Figure 4A). Many key regulators of cell metabolism and system development emerge from the analysis and even more intriguingly, transcripts functioning in opposing processes tend to exhibit opposite patterns of enrichment or depletion. For example, genes promoting growth including insulin-like growth factor 2 (Igf2), pleiotrophin (Ptn), early growth response 1 (Egr1), as well as genes implicated in cancer metastasis such as protein kinase N3 (Pkn3) are enriched in RPL10A/uL1-Ribo-Seq. In contrast, transcripts functioning in the stress response and cell death including X-box binding protein 1 (Xbp1), heat shock protein 1 (Hspb1), polo-like kinase 3 (Plk3), promyelocytic leukemia (Pml), BCL2-associated agonist of cell death (Bad), BCL2-related ovarian killer (Bok) and Fas death domain-associated protein (Daxx) are depleted in the RPL10A/uL1-Ribo-Seq (Figure 4A).
Figure 4. Coordinated translational regulation of genes with related biological functions by specialized ribosomes.
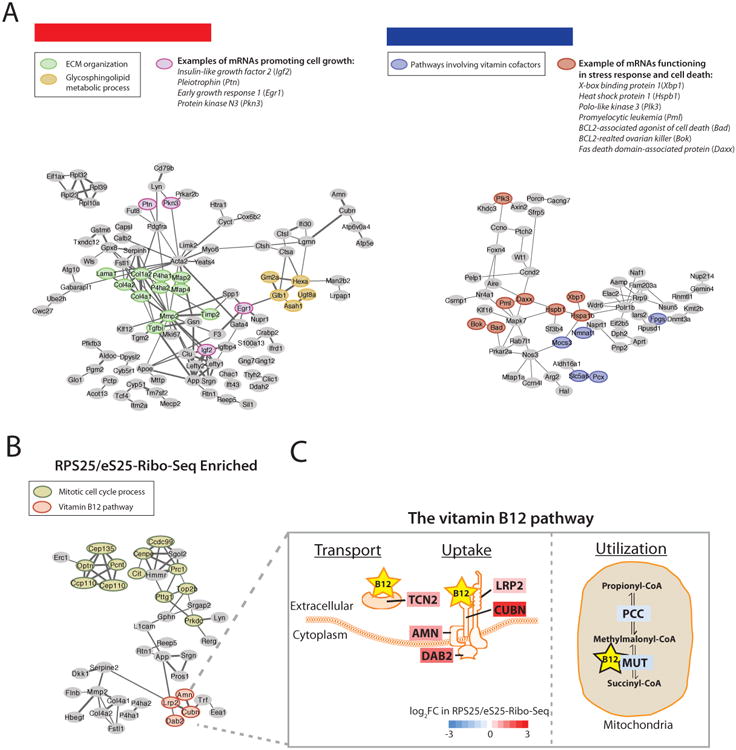
(A) Network-based cluster analysis of RPL10A/uL1-Ribo-Seq enriched or depleted genes and their associated functional classes. (Left): Nodes highlighted represent genes acting in extracellular matrix (ECM) organization (an enriched GO category), glycosphingolipid metabolic process (an enriched GO category), and promoting cell growth or implicated in cancer metastasis. (Right): Nodes highlighted represent genes acting in pathways involving vitamin cofactors (an enriched GO category), and stress response or cell death. (B, C) Coordinated translation by ribosomes demarcated by RPS25/eS25. (B) Network-based cluster analysis of RPS25/eS25-Ribo-Seq enriched genes and associated functional classes. Nodes highlighted represent genes acting in mitotic cell cycle process (an enriched GO category) and vitamin B12 pathway (an enriched GO category). (C) Almost every component involved in the transport, uptake and utilization of vitamin B12 is selectively translated by specific ribosomes demarcated by RPS25/eS25. Each component is color-coded by the log2FC in RPS25/eS25-Ribo-Seq. The vitamin B12 transporter (transcobalamin 2 (Tcn2)) and absorption complex of vitamin B12 at the cell surface (amnionless (Amn), cubilin (Cubn), low density lipoprotein receptor-related protein 2 (Lrp2) and disabled 2 (Dab2)) are all enriched in the RPS25/eS25-Ribo-Seq, highlighted in red. In contrast, the B12-dependent enzyme methylmalonyl-Coenzyme A mutase (Mut), as well as the enzyme propionyl-Coenzyme A carboxylase (PCC) acting in the immediate upstream pathway in mitochondria are depleted in the RPS25/eS25-Ribo-Seq, highlighted in blue.
In contrast to RPL10A/uL1-Ribo-Seq, the RPS25/eS25-Ribo-Seq enriched transcripts function in other cellular pathways, such as the cell cycle and many RPS25/eS25-Ribo-Seq depleted genes, on the other hand, are involved in various aspects of mitochondria functions (Figure 3E and Figure 4B). A remarkable example is the vitamin B12 pathway, where every single component of this pathway is selectively translated by specific ribosomes demarcated by RPS25/eS25, revealing a highly coordinated program of preferential binding of mRNAs by one type of ribosome (Figure 4B and 4C). In summary, our Ribo-seq analysis shows that selective subpools of ribosomes preferentially translate distinct mRNA groups enriched for specific pathways. This extends our SRM results and directly pinpoints the contributions of ribosome heterogeneity to the translational specificity of subclasses of mRNAs.
Specialized Translational Control of Functionally Distinct mRNAs by a Demarcating Heterogeneous RP
To understand why certain mRNAs are found enriched with specific types of ribosomes, we next asked whether the RP demarcating heterogeneous ribosomes might itself play a direct role in the translation of selective subsets of mRNAs identified by Ribo-Seq. To this end, we selected RPL10A/uL1 as a paradigm example and transiently reduced total RPL10A/uL1 protein levels in mESCs by ∼30% using siRNA (Figure S4A and S4B). Depletion of Rpl10a/uL1 by this amount does not alter overall polysome profiles, as quantified by the area under total polysomes compared to the monosomes (Figure S4C). We then assayed the translation of mRNAs randomly chosen from the RPL10A/uL1-Ribo-Seq enriched, neutral and depleted sets of mRNAs. Interestingly, we observed a significant shift from heavy to lighter fractions for mRNAs enriched in the RPL10A/uL1-Ribo-Seq, indicating a decrease in their translation efficiencies (Figure 5A). Importantly, mRNAs that were in the neutral or depleted categories were not affected by RPL10A/uL1 knockdown. To further assess the translation efficiencies of mRNAs upon Rpl10a/uL1 knockdown at genome-wide scale, we performed RNA-Seq of purified mRNAs from combined medium and heavy polysome fractions containing the most actively translating ribosomes (≥4 ribosomes along a mRNA molecule), and from all other fractions containing the free ribonucleoproteins (RNPs), 40S/60S ribosomal free subunits, 80S/monosomes as well as light polysomes (2-3 ribosomes per mRNA molecule) (Figure 5B). The median lengths of the transcripts and CDS are similar among the RPL10A/uL1-Ribo-Seq enriched, depleted and neutral genes (Figure S5A), and thereby their association with heavy polysomes to lighter fractions can be compared. We then calculated the amount of mRNAs in the combined medium and heavy polysome fractions compared to all other fractions as an indication of their translation activities. Importantly, RPL10A/uL1-Ribo-Seq enriched transcripts (shown in red) overall exhibit lowered translation activities upon Rpl10a/uL1 knock down compared to the neutral (shown in grey) (p=0.0055) or RPL10A/uL1-Ribo-Seq depleted set of transcripts (shown in blue) (p=0.0043), revealed by the overall leftward shift in the cumulative distribution curve (Figure 5B). On the other hand, RPS25/eS25-Ribo-Seq enriched transcripts do not exhibit lowered translation activities upon Rpl10a/uL1 knockdown (Figure S5B). This selective sensitivity to RPL10A/uL1 levels for mRNAs preferentially translated by RPL10A/uL1-containing ribosomes suggests a functional link between the preferential enrichment of certain mRNAs to specific ribosomes and their translational control.
Figure 5. The mRNAs preferentially translated by RPL10A/uL1-containing ribosomes are overall more sensitized to RPL10A/uL1 expression levels.

(A) Several mRNAs comprising randomly chosen examples from the RPL10A/uL1-Ribo-Seq enriched, neutral and depleted sets of mRNAs were assayed for their relative distributions in sucrose gradient fractionations by RT-qPCR. The shift from the most actively translating polysomes (medium and heavy polysomes in fraction III) to lighter fractions upon Rpl10a/uL1 knockdown by siRNA was observed in the RPL10A/uL1-Ribo-Seq enriched mRNAs (upper), but not in the neutral or RPL10A/uL1-Ribo-Seq depleted (bottom) set of mRNAs. The mean and standard deviation (SD) from three biological replicates are shown. *: p<0.05 (t-test), NS: not significant (t-test). (B) Left: RNAs subject to RNA-Seq analysis were purified from sucrose gradient combining the medium and heavy polysome fractions (≥4 ribosomes along a mRNA molecule), and from all other fractions containing the free RNPs, 40S/60S ribosomal free subunits, 80S/monosome as well as light polysomes (2-3 ribosomes on a mRNA molecule). The amount of mRNAs in the combined medium and heavy polysome fractions was compared to all other fractions as an analogy of their translation activities. Right: Shown are cumulative distributions of mRNAs translation activities, upon Rpl10a/uL1 siRNA knockdown normalized to the control siRNA. Two biological replicates were performed and the averaged results were shown. RPL10A/uL1-Ribo-Seq enriched transcripts (red) overall have lowered translation activities upon knockdown of Rpl10a/uL1, in compared to the neutral (grey) (p=0.0055, Wilcoxon rank-sum test) or RPL10A/uL1-Ribo-Seq depleted set of transcripts (blue) (p=0.0043, Wilcoxon rank-sum test), revealed by the leftward shift in the cumulative distribution curve. See also Figure S4 and Figure S5.
RPL10A/uL1 can Regulate mRNA Translation through IRES Elements
We next asked whether the regulation of RPL10A/uL1-Ribo-Seq enriched mRNAs by RPL10A/uL1 could be possibly mediated by certain cis-regulons embedded in the target mRNAs. RPL10A/uL1 is positioned at the base of L1 stalk near the mRNA exit tunnel (Figure 1E and Movie S1). Examining the recent high resolution cryo-electron microscopy (cryo-EM) structure of the eukaryotic ribosome bound to the Cricket Paralysis Virus (CrPV) intergenic region (IGR) IRES revealed that RPL10A/uL1 can make direct contact with this IRES element (Fernández et al., 2014) (Figure 6A). IRES elements are often structured RNA regulatory cis-elements within the 5′UTR that can recruit ribosomes to initiate translation in a cap-independent manner, which is important for the synthesis of many viral as well as cellular proteins (Filbin and Kieft, 2009). To investigate whether the physical interaction between RPL10A/uL1 and CrPV IGR IRES is functionally important, we depleted RpL10Ab/uL1 in Drosophila Schneider 2 (S2) cells, an insect cell line that is naturally susceptible to infection by CrPV. While depletion of RpL10Ab/uL1 had no affect on the cell viability or division (Figure 6B and Figure S6A), it significantly diminished CrPV replication in S2 cells (Figure 6B). Importantly, RpL10Ab/uL1 knockdown reduced CrPV IGR IRES activity (Figure 6C) (Figure S6B), with no detectable effect on cap-dependent translation (Figure 6C). On the other hand, reduction of RpL29/eL29--another ribosomal large subunit protein that does not contact the CrPV IRES element nor is in close to the mRNA exit (Figure 6A), has no effect on CrPV IGR IRES activity (Figure 6C) (Figure S6A). These results show the functional importance of the physical interaction of RPL10A/uL1 with the CrPV RNA for IRES-dependent translation. To test whether RPL10A/uL1 has a similar function for other virus IRESs, we further tested Hepatitis C virus (HCV) and encephalomyocarditis virus (EMCV) IRES activity in mESCs and C3H10T1/2 mouse mesenchymal stem cells. Interestingly, HCV IRES activity was specifically sensitive compared to EMCV IRES or a cap-dependent translation for Rpl10a/uL1 but not Rpl29/eL29 knockdown (Figure 6D) (Figure S6), suggesting a specific requirement of RPL10A/uL1 in the translation of certain viral IRES elements, which can directly engage the 80S ribosome independently of some or all initiation factors (Kieft, 2008).
Figure 6. RPL10A/uL1 can Regulate mRNA Translation through IRES Elements.

(A) RPL10A/uL1 (blue) but not RPL29/eL29 (green) can make direct contact with the IRES element (purple) in Cricket Paralysis Virus (CrPV). The model is adapted from a recent structural study (Fernández et al., 2014). The ribo somal large subunit (60S) is at top and small subunit (40S) at bottom. The 28S, 5S and 5.8S rRNAs are shown in light orange and 18S rRNA in light green. (B) Left: Drosophila S2 cells were transfected with double stranded RNA (dsRNA) targeting RpL10Ab/uL1 or GFP as a control. Cell numbers were counted 24 hrs after dsRNA transfection. Right: 24 hrs after dsRNA transfection, S2 cells were infected with CrPV. Cells were collect at 0 hr and 6 hrs after CrPV infection, and the viral load was determined by RT-qPCR. The mean and standard deviation (SD) from three biological replicates are shown. **: p<0.01 (t-test), NS: not significant (t-test). (C) Left: shown are relative CrPV intergenic region (IGR) IRES activities upon RpL29/eL29 or RpL10Ab/uL1 knockdown, compared to the GFP knockdown as a control in Drosophila S2 cells. Right: shown are activities of cap-dependent translation reporter bearing the HBB (human hemoglobin beta) 5′UTR upon RpL29/eL29 or RpL10Ab/uL1 knockdown, compared to the GFP knockdown as a control in Drosophila S2 cells. Firefly luciferase (Fluc) reporter activity was normalized to Fluc mRNA and transfection efficiency using co-transfected Renilla luciferase (Rluc) normalized to Rluc mRNA. The mean and standard deviation (SD) from four biological replicates are shown. *: p<0.05 (t-test), NS: not significant (t-test). (D) Left: shown are relative encephalomyocarditis virus (EMCV) and Hepatitis C virus (HCV) IRES activities upon RpL29/eL29 or RpL10Ab/uL1 knockdown, compared to control siRNA in C3H10T1/2 cells-- a mouse mesenchymal stem cell line where IRESes generally exhibit higher activities than mESCs. Right: shown are activities of cap-dependent translation reporter bearing either HBB (human hemoglobin beta) or Actb (beta-actin) 5′UTR upon RpL29/eL29 or RpL10Ab/uL1 knockdown, compared to control siRNA in C3H10T1/2 cells. The mean and standard deviation (SD) from three biological replicates are shown. *: p<0.05 (t-test), NS: not significant (t-test). (E) In mESCs, Igf2, App and Chmp2a mRNAs were assayed for their relative distributions in sucrose gradient fractionation, by RTqPCR. The shift from most actively translating polysomes (medium and heavy polysomes in fraction III) to lighter fractions upon Rpl10a/uL1 knockdown by siRNA indicating decreased translation initiation of these mRNAs. The mean and standard deviation (SD) from three biological replicates are shown. *: p<0.05 (t-test). (F) Shown are relative IRES activities of Igf2, App and Chmp2a 5′UTR upon RpL29/eL29 or RpL10Ab/uL1 knockdown, compared to control siRNA in C3H10T1/2 cells. The mean and standard deviation (SD) from three biological replicates are shown. *: p<0.05 (t-test), NS: not significant (t-test). See also Figure S6.
Having established a role in viral IRES-dependent translation, we next asked whether RPL10A/uL1 could exert a similar function on cellular IRES elements, and in particular, whether any known cellular IRES-containing mRNAs may be present in our RPL10A/uL1-Ribo-Seq enriched dataset. A careful search of the literature revealed that several RPL10A/uL1-Ribo-Seq enriched transcripts (insulin-like growth factor 2 (Igf2), amyloid beta (A4) precursor protein (App) and charged multivesicular body protein 2A (Chmp2a)) are known to contain IRES elements identified from previously published studies (Beaudoin et al., 2008; Dai et al., 2011; Weingarten-Gabbay et al., 2016) (Figure S6B). The translation of Igf2, App and Chmp2a are all dependent on Rpl10a/uL1, as we observed a shift from heavy to lighter fractions in the sucrose gradient for these mRNAs upon Rpl10a/uL1 knockdown (Figure 6E). Importantly, all three IRES-containing transcripts showed significantly reduced IRES-dependent translational activity upon knockdown of Rpl10a/uL1 expression, but not Rpl29/eL29 (Figure 6F) (Figure S6C). In sum, these results suggest the specificity for RPL10A/uL1-containing ribosomes may, at least in part, be at the level of specific regulons in the 5′UTRs of preferentially enriched transcripts such as IRES elements.
Discussion
Together, our studies have identified and quantified subsets of ribosomes that are heterogeneous at the level of core RPs, within the translationally active ribosomes of a single primary cell type. Interestingly, our studies indicate that RPs found mutated in ribosomopathies like DBA (e.g. RPS7/eS7 and RPS26/eS26) are substoichiometric and may demarcate ribosomes with specialized functions which could underlie the unexpected cell- and tissue-specific congenital birth defects and clinical manifestations of this disease (McCann and Baserga, 2013). We further show that small and selective groups of transcripts that are key regulators of various aspects of cell biology such as control of cell metabolism, proliferation and survival are preferentially and differentially translated by specific types of ribosomes. Our study of ribosome heterogeneity within mESCs therefore serves as a foundation to future research. For example, a recent study has revealed tissue-specific programs of translational control during mammalian embryonic development (Fujii et al., 2017). An important immediate question is to determine whether a selective translational landscape of specific types of ribosomes bearing or missing certain RPs exists during the course of cellular differentiation and between different cell and tissue types where the degree of ribosome heterogeneity could be even more extensive. Furthermore, although the RPS25/eS25-Ribo-Seq and RPL10A/uL1-Ribo-Seq gene sets are largely non-overlapping, there are a small number of genes that are shared (Figure S3C). It will also be interesting to investigate other potential distinguishing features between ribosomes containing or lacking RPS25/eS25 and RPL10A/uL1, including determining whether a ribosome could simultaneously lack multiple RPs. Furthermore, given the rather specific requirement of RPL10A/uL1 in preferentially translating a subset of transcripts and the previous observations that RPL10A/uL1 is largely dispensable for ribosomal assembly and function in bacteria (Dabbs et al., 1981; Subramanian and Dabbs, 1980) and yeast (McIntosh et al., 2011; Pöll et al., 2009), it will be also interesting to explore the evolutionary landscapes of ribosome heterogeneity and the potential co-evolution of selectively translated transcripts. One important cis-regulatory element identified in our findings that appears to guide translational control by specific types of ribosomes is the IRES element. It remains to be determined whether a key mechanism by which heterogeneous ribosomes interface with select subsets of transcripts is mainly through IRES elements present within their 5′UTRs. Interestingly, our findings suggest that not all RPL10A/uL1 Ribo-Seq enriched mRNAs may contain IRES elements (data not shown) and it therefore remains to be addressed how additional yet unknown cis-regulatory elements could confer ribosome-mediated control of gene expression. Moreover, while RPL10A/uL1 directly interacts with certain viral RNA elements such as the CrPV IRES, it remains to be determined whether a direct physical interaction occurs in the context of cellular IRES elements identified in our study or additional intermediary RNA binding proteins may be required. In summary, the identification of heterogeneous ribosomes and their ability to preferentially translate subpools of mRNAs genome-wide reveals an important additional layer of regulation to gene expression.
STAR Methods
Contact for Reagent and Resource Sharing
Further information and requests for resources and reagents should be directed to and will be fulfilled by the Lead Contact, Maria Barna (mbarna@stanford.edu).
Method Details
Cell Culture
Low-passage E14 mouse embryonic stem cells (mESCs) were grown in knockout DMEM (Invitrogen, 10829-018) with 15% ESC grade FBS (EMD Millipore, ES-009-B), 1× L-glutamine (EMD Millipore, TMS-002-C), 1× ES-grade Penicillin/streptomycin (EMD Millipore, TMS-AB2-C), 1× non-essential amino acid (EMD Millipore, TMS-001-C), 0.1% 2-mercaptoethanol, 1× Leukemia Inhibitory Factor (LIF, EMD Millipore, ESG1107) in 37 °C, 5% CO2 incubator. One hour prior to harvest, ∼60-70% confluency cells were incubated with fresh mESC media. Mouse C3H10T1/2 cells were grown in the growth media (10% FBS (Hyclone, SH30071.03), Penn/ Strep (Gibco, 15140-122), DMEM (Gibco, 11965-118)) in 37 °C, 5% CO2 incubator. Drosophila Schneider 2 (S2) cells were grown in growth media containing 10% heat inactivated FBS (Hyclone, SH30071.03), Penn/Strep (Gibco, 15140-122), and Schneider's Drosophila medium (Gibco, 21720024)) at room temperature in ambient CO2.
Formaldehyde cross-linking
Formaldehyde cross-linking was performed following the procedures described before (Ricci et al., 2013). Details are described as below: two minutes prior to harvest, 100 μg/ml cycloheximide (Sigma, C7698) was added to the medium and cells were rinsed once with Phosphate buffered saline (PBS) containing 100 μg/ml cycloheximide. The cell pellet was re-suspended in PBS containing 100 μg/ml cycloheximide and 0.1% formaldehyde with gentle mixing at room temperature (RT) for 10 minutes. Subsequently, one-tenth volume of quenching buffer (2.5 M glycine, 25 mM Tris base) was added to quench the formaldehyde and terminate the cross-linking reaction. Cells were then pelleted and lysed for polysome fractionation. After protein extraction from the polysome fractions, samples were boiled for 10 minutes to reverse the cross-links.
Polysome Fractionation and Protein Extraction
Cell pellets were lysed in the lysis buffer (20 mM Tris pH 7.5, 150 mM NaCl, 15 mM MgCl2, 100 μg/ml cycloheximide, 1 mM DTT, 0.5% Triton X-100, 0.1 mg/ml heparin, 8% glycerol, 20 U/ml TURBO™ DNase (Ambion, AM2238), 200 U/mL SUPERase• In™ RNase Inhibitor (Ambion, AM2696), 1× Combined Protease and Phosphatase Inhibitor (Thermo, 78443)) and incubated for 30 minutes at 4°C with occasional vortexing. The lysate was clarified by sequential centrifugation for 5 minutes at 1,800 × g and 10,000 × g at 4°C to remove nuclei and mitochondria. Cleared cell lysate was then loaded onto a 10-45% sucrose gradient and centrifuged at 40,000 rpm for 2.5 hours at 4°C. Gradients were fractioned using a Brandel gradient fractionator with continuous A260 measurement. We collected fractions corresponding to the polysomes containing multiple ribosomes bound along an mRNA molecule in the act of translation. Proteins were purified using the ProteinExtract® protein precipitation kit (Calbiochem®, 539180) following the manufacturer's manual.
Absolute Protein Quantification by Selected Reaction Monitoring/SRM
A screen was first performed using a trypsin digested purified ribosome sample to select for proteotypic peptides as surrogate for certain RPs. Briefly, the selected RPs are subjected to in silico digestion with trypsin and all possible peptides that are unique to the RP are monitored on a TSQ Vantage triple quadrupole mass spectrometer (Thermo Fisher Scientific). For each RP to be quantified, several peptides with high signal intensities are selected as surrogates for the RP. An absolutely-quantified heavy-labeled synthetic version of each peptide was custom ordered from JPT (Berlin, Germany, SpikeTides TQL peptides). For each surrogate peptide, a preliminary transition (precursor/fragment ion pairs) list was created from the top 5 to 6 transitions suggested by the Skyline software (MacCoss Lab, University of Washington) (MacLean et al., 2010). A solution of the light and heavy-labeled peptides was used to evaluate the preliminary transition list in an unscheduled mode. The data was imported back into Skyline and the top 4 to 6 transitions for each peptide were selected based on signal intensity. This refined list was then evaluated again in an unscheduled mode; the data of unscheduled runs were assessed in Skyline to determine retention times for each peptide in setting up the final scheduled method using collision energy (CE) values calculated by the software. To prepare the samples for SRM, purified proteins from sucrose gradient were denatured in 8 M urea for 1 hour at room temperature, then diluted to 2 M urea, reduced with 10 mM tris(2-carboxyethyl)phosphine (TCEP) (Soltec Ventures) for 30 minutes at 37 °C, and alkylated with 15 mM iodoacetamide (Sigma) for 30 minutes in the dark at room temperature. Next, a known amount of absolutely-quantified heavy peptide standards was spiked in. The sample was diluted to 1 M urea, and 1 μl of 0.5 μg/μl sequencing-grade trypsin (Promega, catalog #V5113) was added at a ratio of 1:10 (trypsin:protein). The sample was incubated at 37°C for 14-16 hours for complete trypsin digestion, confirmed by the vanishing of partial digested peptides. Peptides were desalted on Oasis HLB μElution Plates (Waters), lyophilized, and then solubilized in 7 μL of 98%/2%/0.1% water/acetonitrile/formic acid buffer (v:v:v). A 5 μL injection of the solution was made onto a 2 cm × 100 μm capillary trap column (New Objective, Woburn, MA) packed with Magic C18 AQ (5 μm, 200 Å pore size) packing material coupled to a 21 cm × 75 μm capillary column (packed with Magic C18 AQ material, with 100 Å pore size) in a vented column arrangement (Yi et al., 2003). Samples were eluted from the column with an Eksigent NanoLC 2D system (Eksigent Technologies, Dublin, CA) using a linear gradient from 92% water/formic acid (0.1%) and 8% acetonitrile/formic acid (0.1%) to 60% water/formic acid (0.1%) and 40% acetonitrile/formic acid (0.1%) over 60 minutes at a flow rate of 500 nL/minutes. The analysis was conducted on a TSQ Vantage triple quadrupole mass spectrometer with the following parameters: collision gas at 1.2 mTorr, chrom filter width at 10.0 seconds, a spray voltage of 1850 volts, capillary temperature at 300°C, and a total cycle time of 2.000 seconds with Q1 peak width at 0.5 FWHM and Q3 at 0.7 FWHM. The transitions for the light (endogenous) and heavy (absolutely-quantified SpikeTide) peptides were measured using scheduled SRM (the list of peptides and transitions measured is provided in Table S1) and analyzed using Skyline software package (MacLean et al., 2010). Absolute peptide quantifications were determined by taking the ratio of the transition fragment peak integrals of the corresponding light and heavy peptides, multiplied by the known amount of the added standard. One to three peptides per protein were quantified, and the median value of the peptides for the same protein was used to represent its abundance. Finally, the stoichiometry of each RP was determined by normalizing its absolute quantification value to the average of RPS2/uS5 and RPS8/eS8 for small subunit proteins or the average of RPL6/eL6 and RPL7A/eL8 for large subunit proteins. The significance of sub-stoichiometry of each quantified RP was evaluated with Student's t-test.
Relative Protein Quantification by Tandem Mass Tag/TMT labeling
Purified proteins from sucrose gradient were denatured with 5 mM DTT and 2 M urea for 1 hour 65 °C, then alkylated with 15 mM iodoacetamide (Sigma) for 30 minutes in the dark at room temperature. Proteins were digested with sequencing grade modified trypsin (Promega V5111) with a ratio of 1: 50 (trypsin: protein) at 37 °C for 5 hours. Digested peptides were desalted using the OMIX C18 pipette tips column (Agilent A57003100) following manufacturer's manual. Each sample was labeled with a distinct TMT (TMTsixplex™, Thermo) following manufacturer's manual, mixed equally and desalted again through the OMIX C18 pipette tips column. The solution was then dried with a Speed Vac, reconstituted with 0.1% formic acid and subject to the high performance liquid chromatography (HPLC)-MS/MS analysis. Peptides was injected into the HPLC and analyzed through MS/MS on an Orbitrap Elite Mass Spectrometer (Thermo Scientific). The results were analyzed using the Proteome Discoverer 1.4 (Thermo Scientific) employing the Mascot search engine (Perkins et al., 1999). Relative abundance of each RPs was calculated by their levels in the polysomes compared to the 40S or 60S free subunits, with the median relative abundance of all RPs set to 1. The significance of sub-stoichiometry of each quantified RP was evaluated with Student's t-test.
Ribosome Profiling/Ribo-Seq
Cells were treated with 100 μg/ml cycloheximide in mESC media for 1 minute prior to harvest. The media was then aspirated and cells were scraped from the plate in cold PBS with 100 μg/ml cycloheximide. After centrifugation, the cell pellet was re-suspended in cold lysis buffer (20 mM Tris pH 7.5, 150 mM NaCl, 15 mM MgCl2, 100 μg/ml cycloheximide, 1 mM DTT, 0.5% Triton X-100, 0.1 mg/ml heparin, 8% glycerol, 20 U/ml TURBO™ DNase, 1× Combined Protease and Phosphatase Inhibitor) and incubated for 30 minutes at 4°C with occasional vortexing. The lysate was clarified by sequential centrifugation for 5 minutes at 1,800 × g and 10,000 × g at 4°C to remove the nuclei and mitochondria. 250 μl of lysate (with RNA concentration of ∼ 1 μg/μl) was then treated with RNase A/T1 mix (0.5 mg RNase A (Ambion, AM2272) and 1,000 U RNase T1 (Life Technologies, 2280)) for 30 minutes at room temperature to digest mRNAs not protected by the ribosome. The digestion was stopped by adding 4.5 μl of SUPERase-In™ RNase Inhibitor (20 U/μl, Ambion, AM2696). Lysate was then loaded onto a 1 M sucrose cushion. Ribosomes were pelleted by centrifugation at 70,000 rpm for 4 hour at 4°C. After a brief wash, the pellets were re-suspended in TRIzol® for RNA extraction. Two biological replicates were performed for each type of Ribo-Seq and all Ribo-Seq libraries were prepared as described before (Ingolia et al., 2012). Details are described as below. First, ribosome protected fragments extracted from TRIzol® were run on a 15% TBE-Urea polyacrylamide gel and size selected between 28-nt and 34-nt as marked by RNA oligonucleotides oNTI199 and oNTI265 (Table S5). Gel slices were crushed with a razor blade and incubated overnight at room temperature in 400 μL of RNA extraction buffer (300 mM NaOAc pH 5.5, 1 mM EDTA, 0.25% SDS). RNA was then extracted with acid-phenol:chloform and precipitated with isopropanol. RNA were then 3′ dephosphorylated with 1 μL of T4 Polynucleotide Kinase (PNK) (NEB, M0201S) in 50 μL of total volume for 1 hour at 37°C. This was followed by acid-phenol:chloform extraction and isopropanol precipitation. 3′ dephosphorylated RNAs were then incubated with 1.5 μL of 0.5 μg/μL Universal miRNA Cloning Linker (NEB, S1315S) and 1 μL T4 RNA Ligase 2, truncated (NEB, M0242S) in 20 μL of total volume for 2.5 hours at room temperature. Samples were then purified by acid-phenol:chloform extraction and isopropanol precipitation. 3′ ligated ribosome protected fragments were subsequently size selected on 10% TBE-Urea polyacrylamide gels and purified. For subsequent reverse transcription, purified 3′ ligated products were incubated with 2 μL of 1.25 μM RT primer (Table S5) and denatured for 2 minutes at 80°C. Reverse transcription was performed with SuperScript III (Invitrogen, 18080-044) in a 20 μL of total volume (30 min, 48°C). RNA was then hydrolyzed by adding 2.2 μL of 1M NaOH and incubated for 20 minutes at 98°C. cDNAs were purified by isopropanol precipitation. RT products were size selected on 10% TBE Urea polyacrylamide gels. Gel slices were crushed with a razor blade and incubated overnight at room temperature in 400 μL of DNA extraction buffer (300 mM NaCl, 10 mM Tris-HCl pH 8, 1 mM EDTA, 0.1% SDS). DNA was precipitated with isopropanol overnight at −80°C. DNA was then circularized with CircLigase (Illumina, CL4115K) in a 20 μL volume at 60°C for 12 hours. To deplete rRNAs, circularized DNA sample was incubated with 4 μL of biotinylated oligonucleotide pool (reverse complements to pieces of rRNA sequences, 10 μM for each oligo, see Table S5) in 40 μL with 0.5×SSC (75 mM NaCl, 7.5 mM sodium citrate). Samples were denatured at 100°C for 90 sec and slowly cooled to 37°C (0.1°C/sec), followed by incubation at 37°C for 15 min. For each sample, 100 μL of MyOne Streptavidin C1 DynaBeads (Invitrogen, 65001) was washed, re-suspended in 40 μL of 2× bind/wash buffer (2M NaCl, 1mM EDTA, 5mM Tris (pH 7.5), and 0.2% Triton X-100) and mixed with the sample. The sample was then incubate at 37°C for 15 minutes with mixing (1,000 rpm). Supernatants were collected and precipitated by adding 2 μL of Glycogen (Ambion, AM9510), 6 μL of 5 M NaCl and 150 μL of isopropanol. Purified cDNA were dissolved in 10 μL of ultrapure water. 1 μL of cDNA was used as template for PCR amplification with Phusion High-Fidelity DNA Polymerase (Thermo Fisher, F530S) for 10-11 amplification cycles, with primers listed in Table S5. PCR product was purified from 8% TBE polyacrylamide gels. The quality and concentration of DNA were measured with the Agilent 2100 Bioanalyzer (High-Sensitivity DNA) by the Stanford Protein and Nucleic Acid Facility. Finally, libraries were sequenced on the Illumina NextSeq 500 sequencer (1×75 nt) by the Stanford Functional Genomics Facility.
Generating ES Cell Lines with Tagged RPs
Two mouse ES cell lines harboring either a Rps25/eS25-3xFLAG allele or a 3xFLAG-Rpl10a/uL1 allele at their respective endogenous locus were generated via CRISPR/Cas9-mediated genome engineering (Ran et al., 2013). Guide RNAs (gRNAs) were designed for cleavage near the stop codon of Rps25/eS25 or the start codon of Rpl10a/uL1 using the CRISPR design tool (http://crispr.mit.edu/). Individual gRNAs were subcloned into the pX330-U6-Chimeric_BB-CBh-hSpCas9 plasmid (Addgene plasmid # 42230). mESCs were transfected with 800 ng of pX330-gRNA plasmid and 1.76 ug of Single-Stranded Oligo Donor (ssODN) in 24-well plates with 0.5 × 10⁶ cells per well using Lipofectamine 2000 following manufacturer's instructions. The sequences of gRNAs and ssODN are listed in Table S5. 24 hours after transfection, the cells were seeded at low density on 10 cm plates. 5-6 days after plating, single colonies were picked and replica plated onto two 96-well plates. After 5-6 days, PCR genotyping was performed to identify the isogenic cell lines that are heterozygous for the tagged RPs (Rps25/eS25-3xFLAG/+ or 3xFLAG-Rpl10a/uL1 /+). The primers for genotyping are listed in Table S5. The desired clones were expanded and used for the Ribo-Seq experiments.
Immunoprecipitation of ribosomes containing tagged RPs
After treating with RNase A/T1 to digest mRNAs not protected by the ribosome, ribosomes containing RPS25/eS25-3xFLAG or 3xFLAG-RPL10A/uL1 were enriched by IP using anti-FLAG® M2 magnetic beads (Sigma, M8823) on a head-over-tail rotator at 4 °C for 2 hours. Beads were washed 3 times for 5 minutes in washing buffer (20 mM Tris pH 7.5, 200 mM NaCl, 15 mM MgCl2, 100 μg/ml cycloheximide, 0.5% Triton X-100). After the final wash, the liquid was aspirated, and immunoprecipitated ribosomes were eluted in TRIzol® (Invitrogen, 15596) for RNA extraction and Ribo-Seq. RPL22/eL22-3xHA ribosomes were immunoprecipitated by incubating the re-suspended sucrose cushion pellet with anti-HA antibody (Abcam 9110) on a head-over-tail rotator at 4 °C for 4 hours, and then incubated with Dynabeads® Protein A (ThermoFischer Scientific, 10001D) on a head-over-tail rotator at 4 °C for 2 hours. Beads were washed 5 minutes for 3 times in washing buffer (20 mM Tris pH 7.5, 200 mM NaCl, 15 mM MgCl2, 100 μg/ml cycloheximide, 0.5% Triton X-100). After the final wash, liquid was aspirated and immunoprecipitated ribosomes were eluted in TRIzol® (Invitrogen, 15596) for RNA extraction and Ribo-Seq.
Analysis of the Ribo-Seq Results
Sequencing reads were parsed by cutadapt (Martin, 2011) to remove the 3′ adapter sequence, and reads with good sequencing qualities (Phred quality score>33) were kept. A layered alignment employing Bowtie 2 (Langmead and Salzberg, 2012) was performed to first discard reads mapping to rRNA, tRNA, or snRNA sequences. Non-rRNA/tRNA/snRNA reads were then aligned against the canonical isoform of UCSC known gene transcripts (mm10) (Hsu et al., 2006). Mapped footprints were assigned to specific positions based on the A sites. The position of A site in relative to the 5′ end of each read is calculated as follows: 29-30 nt: +15; 31-33 nt: +16 and 34-35 nt: +17. For each gene, the total number of ribosome footprints mapping to the CDS excluding the first 15 or last 5 codons were counted. The density of ribosome footprints was calculated as Reads Per Kilobase per Million mapped reads (RPKM). Genes having ≥5 RPKM were kept for further analysis. To determine the transcripts significantly enriched/depleted in the RPS25/eS25-Ribo-Seq or RPL10A/uL1-Ribo-Seq, we applied the edgeR package (Robinson et al., 2010) to calculate the fold change (FC) and corresponding statistical significance (FDR).
Gene Function and Interaction Network Analysis
Protein interaction networks were retrieved from STRING v10 database (Szklarczyk et al., 2014) and imported into Cytoscape for visualization (Shannon et al., 2003). Each node represents a gene and each edge shows protein-protein association with the width proportional to the association score. Genes with related functions were clustered together and disconnected nodes were removed from the plot for simplicity. The enrichment of Gene Ontology terms was analyzed using Manteia (Tassy and Pourquié, 2014).
Ribosomal Protein Gene Knockdown
Gene knockdown was achieved by transfecting mESCs or C3H10T1/2 cells with small double-stranded interfering RNAs (siRNA) with Lipofectamine 2000 (Invitrogen, 11668). siRNAs used for targeting were as follows: for Rpl10a/uL1: SASI_Mm01_00200342 (Sigma), Rps7/eS7: SASI_Mm01_00064058 (Sigma), Rpl7a/eL8: SASI_Mm01_00080391 (Sigma), Rpl38/eL38: SASI_Mm02_00291981 (Sigma), Rpl40/eL40: SASI_Rn01_00110153 (Sigma) and Rpl29/eL29: EMU182691 (Sigma). MISSION siRNA Universal Negative Control 2 (Sigma, SIC002) was used as a control. Gene knockdown in Drosophila S2 cells were achieved by transfection of 1 μg double stranded RNA per well of the 12-well plate using Effectene (Qiagen, 301425). Double stranded RNAs were in vitro transcribed with MEGAscript (Ambion, AM1333) and template CDSs were amplified by PCR from S2 cell cDNA. All PCR primers are listed in Table S5.
Western Blot
Protein samples were loaded onto 4–20% SDS–PAGE gel. After running, proteins were transferred by semi-dry transfer system using Trans-Blot Turbo (Bio-Rad) following manufacture's protocol. The PVDF membranes were blocked in 5% nonfat dry milk in PBST for 1 hour, and incubated overnight at 4 °C with the primary antibody, then washed three times for 5 minutes in PBST, incubated with appropriate secondary antibodies conjugated to horseradish peroxidase (anti-Mouse and anti-Rabbit from GE Healthcare) for 1 hour, and then washed three times for 5 minutes in PBST. The western blot signals were developed using Clarity Western ECL Substrate (Bio-Rad, 1705060) and imaged with ChemiDoc MP (Bio-Rad).
RT-qPCR Analysis of Polysome Associated mRNAs
After polysome fractionation, RNA was extracted using Acid-Phenol:Chloroform, pH 4.5 (with IAA, 125:24:1) (Ambion, AM9722). We collected RNA from fractions corresponding to the free RNPs and 40S (Fraction I), 60S/80S and light polysomes (Fraction II), and medium and heavy polysomes (Fraction III) that contain ≥4 ribosomes bound along an mRNA molecule. 500 ng of RNA from each fraction was reverse-transcribed to cDNA using iScript™ Reverse Transcription Supermix kit (Bio-Rad, #1708841). qPCR was performed using the SsoAdvanced™ Universal SYBR® Green Supermix (Bio-Rad, #1725274). RNA levels were quantified using the standard curve method by CFX manager (Bio-Rad), summed across all fractions analyzed and presented as percentage of this total. All RT-qPCR primers are listed in Table S5.
Polysome Profiling and Analysis
Polysome profiling was performed by comparing the control siRNA and Rpl10a/uL1 knockdown, with each having two biological replicates. After polysome fractionation, RNA was extracted using Acid-Phenol:Chloroform, pH 4.5 (with IAA, 125:24:1) (Ambion, AM9722). We collected RNA from combined light fractions containing the free RNPs, 40S/60S ribosomal free subunits, 80S/monosome as well as light polysomes (2-3 ribosomes on a mRNA molecule), and combined heavy polysome fractions containing the most actively translating ribosomes (≥4 ribosomes along a mRNA molecule). The RNA-Seq libraries were then prepared using the KAPA Stranded RNA-Seq Kit with RiboErase (HMR) (Kapa Biosystems, Roche Cat#07962282001) by the Stanford Functional Genomics Facility and sequenced on a NextSeq sequencer (Illumina) with 2 × 75 bp read length. The paired-end reads were aligned to the mouse genome using the STAR RNA-Seq aligner (Dobin et al., 2013), and the total number of reads uniquely mapped to each gene were counted. To estimate the translation efficiency of each mRNA, we calculated the amount of mRNA in the combined medium and heavy polysome fractions compared to all other fractions. In brief, applying the framework of the generalized linear model (GLM) in the edgeR statistical package (Robinson et al., 2010), a linear regression was performed to the normalized read counts, as a function of polysome fraction variables (‘combined medium and heavy polysome fractions’ or ‘all other fractions’). Here the coefficient of polysome fraction variables (‘combined medium and heavy polysome fractions’ over ‘all other fractions’) is a measurement of translation activities. The translation activities upon Rpl10a/uL1 knockdown were compared to the control siRNA and plotted as cumulative distribution curves.
5′UTR Cloning and Reporter Plasmids
The 5′UTRs of Igf2, App and Chmp2a were amplified from mouse cDNA and cloned into the pRF bi-cistronic reporter plasmid (Yoon et al., 2006) between the EcoRI and NcoI restriction sites. All PCR primers are listed in Table S5.
Luciferase Reporter Assay
C3H10T1/2 cells were transfected with 800 ng of pRF reporter plasmid and 50 pmol siRNA in 12-well plates with 0.1 × 10⁶ cells per well using Lipofectamine 2000 (Invitrogen) following the manufacturer's instructions. mESCs were transfected with 800 ng of pRF reporter plasmid with 50 pmol siRNA in 24-well plates with 0.5 × 10⁶ cells per well using Lipofectamine 2000 following manufacturer's instructions. Cells were harvested at 24 hours post-transfection for luciferase assays. IRES activity is expressed as a ratio between Fluc and Rluc activity and normalized to that of the empty vector (pRF) or the ΔPK1 control for CrPV IGR IRES. Relative IRES activity upon RP knockdown was normalized to the control siRNA for each construct. For the S2 cell assays, 24 hours after double stranded RNA transfection, cells were transfected with 1 μg of bicistronic RNA. Bicistronic RNAs were in vitro transcribed with the mMESSAGE mMACHINE kit (Ambion, AM1345) using BamH1 digested bicistronic plasmid as the template, and the RNAs were polyadenylated using Poly(A) Polymerase Tailing Kit (Epicentre, PAP5104H). S2 cells were transfected with 1μg of RNAs in 12-well plates seeded with 3 × 10⁶ cells per well in growth media (10% FBS (Sigma, F-3018), Penn/Strep (Gibco, 15140), Schneider Media (Gibco, 21720)) using Lipofectamine 2000 following the manufacturer's instructions. 6 hours after RNA transfection, cells were harvested, washed in PBS, and assayed for luciferase activity (Wang and Jan, 2014).
Virus replication assay in S2 cell
24 hours after double stranded RNA transfection, S2 cells were counted by Trypan blue (Gibco, 15250061) and infected with CrPV on the 24-well plate seeded with 1.5 × 10⁶ cells at an Multiplicity of infection (MOI) of 0.1 in 100 μl of PBS. Cells were harvested at 0 and 6 hour time points and washed twice with PBS. RNAs were collected in TRIzol®, and viral RNA load was measured by RT-qPCR and normalized by a Drosophila housekeeping gene Act42A. All RT-qPCR primers are listed in Table S5.
Positioning RPs on the Structural Model of Ribosome
The structural models of the human ribosome (PDB files 4V6X) and Kluyveromyces lactis ribosome in complex with CrPV-IRES (PDB files 4V91 and 4V92) were downloaded from the Protein Data Bank (PDB) website and edited using PyMOL (Schrodinger LLC, 2010).
Data availability
Sequencing data are deposited in the Gene Expression Omnibus under accession number GSE73357.
Supplementary Material
Table S1 (Related to Figure 1). List of peptides and transitions for SRM quantification
Table S2 (Related to Figure 2). Relative abundance of RPs in polysomes compared to the free subunits, quantified by relative quantification using TMT
Table S3 (Related to Figure 3). RPS25/eS25-Ribo-Seq enriched/depleted gene list
Table S4 (Related to Figure 3). RPL10A/uL1-Ribo-Seq enriched/depleted gene list
Table S5 (Related to the STAR methods). Primers used in this study.
Movie S1. A 360° rotational view of mammalian ribosome with sub-stoichiometric RPs highlighted in blue. Related to Figure 1.
The ribosomal large subunit (60S) is at top and small subunit (40S) at bottom, shown on a structural model of the human ribosome with all other RPs in light grey (Anger et al., 2013) (PDB files 4V6X). The 28S, 5S and 5.8S rRNAs are shown in light orange and 18S rRNA in light green.
Highlights.
Translating ribosomes are heterogeneous at the level of core ribosomal proteins
Heterogeneous ribosomes preferentially translate distinct subpools of mRNAs
RPL10A-Ribo-Seq enriched mRNAs require RPL10A for their efficient translation
IRES elements contribute to the unique translational regulation by RPL10A
Acknowledgments
We thank the Barna lab members for constructive suggestions and thoughtful critiques of the work. We thank R. Mann from the Beachy lab, L. Jiang and S. Chen from the Snyder lab, L. Zhang from the Elias lab and M. MacCoss at the University of Washington in Seattle for helpful advice with Mass Spectrometry. We thank N. Yang from the Wernig lab for the help with generating transgenic cell lines. We thank C. Lu from the Fuller lab for the help with S2 cell culture. The CrPV and the CrPV IGR IRES reporter plasmids were kind gifts from E. Jan (The University of British Columbia). This work was supported by the New York Stem Cell Foundation (M.B.), NIH Director's New Innovator Award, 7DP2OD00850902 (M.B.), Alfred P. Sloan Research Fellowship (M.B), Mallinckrodt Foundation Award (M.B.), Pew Scholars Award (M.B.), NIH R21HD086730 (M.B), National Institutes of Health RO1-DK101743 (to M.N.T), RO1-DK106241 (to M.N.T.), P50-GM107615 (to M.N.T.), and Stanford BioX Seed Grant funding (to M.N.T.). Z.S. is a Gordon and Betty Moore Foundation Fellow supported by the Life Science Research Foundation. K.F. is supported by the Uehara Memorial Foundation and Human Frontier Science Program Fellowship. N.R.G. is supported by a National Science Foundation Graduate Research Fellowship. M.B. is a New York Stem Cell Foundation Robertson Investigator.
Footnotes
Author Contributions: M.B. and Z.S. conceived the project, M.B., Z.S. and K.F. designed the experiments, Z.S., K.F., K.K. and N.G. conducted the experiments, Z.S. and H.R. analyzed the SRM results, M.T. supervised the SRM experiments. M.B. and Z.S wrote the paper, with input from all of the authors.
Publisher's Disclaimer: This is a PDF file of an unedited manuscript that has been accepted for publication. As a service to our customers we are providing this early version of the manuscript. The manuscript will undergo copyediting, typesetting, and review of the resulting proof before it is published in its final citable form. Please note that during the production process errors may be discovered which could affect the content, and all legal disclaimers that apply to the journal pertain.
References
- Anger AM, Armache JP, Berninghausen O, Habeck M, Subklewe M, Wilson DN, Beckmann R. Structures of the human and Drosophila 80S ribosome. Nature. 2013;497:80–85. doi: 10.1038/nature12104. [DOI] [PubMed] [Google Scholar]
- Beaudoin ME, Poirel VJ, Krushel LA. Regulating amyloid precursor protein synthesis through an internal ribosomal entry site. Nucleic Acids Res. 2008;36:6835–6847. doi: 10.1093/nar/gkn792. [DOI] [PMC free article] [PubMed] [Google Scholar]
- Boehringer D, Thermann R, Ostareck-Lederer A, Lewis JD, Stark H. Structure of the hepatitis C virus IRES bound to the human 80S ribosome: remodeling of the HCV IRES. Structure. 2005;13:1695–1706. doi: 10.1016/j.str.2005.08.008. [DOI] [PubMed] [Google Scholar]
- Boria I, Garelli E, Gazda HT, Aspesi A, Quarello P, Pavesi E, Ferrante D, Meerpohl JJ, Kartal M, Da Costa L, et al. The ribosomal basis of diamond-blackfan anemia: Mutation and database update. Hum Mutat. 2010;31:1269–1279. doi: 10.1002/humu.21383. [DOI] [PMC free article] [PubMed] [Google Scholar]
- Carter MS, Sarnow P. Distinct mRNAs that encode La autoantigen are differentially expressed and contain internal ribosome entry sites. J Biol Chem. 2000;275:28301–28307. doi: 10.1074/jbc.M004657200. [DOI] [PubMed] [Google Scholar]
- Cong L, Ran FA, Cox D, Lin S, Barretto R, Habib N, Hsu PD, Wu X, Jiang W, Marraffini La, et al. Multiplex genome engineering using CRISPR/Cas systems. Science. 2013;339:819–823. doi: 10.1126/science.1231143. [DOI] [PMC free article] [PubMed] [Google Scholar]
- Dabbs ER, Ehrlich R, Hasenbank R, Schroeter BH, Stöffler-Meilicke M, Stöffler G. Mutants of Escherichia coli lacking ribosomal protein L1. J Mol Biol. 1981;149:553–578. doi: 10.1016/0022-2836(81)90347-8. [DOI] [PubMed] [Google Scholar]
- Dai N, Rapley J, Ange M, Yanik FM, Blower MD, Avruch J. mTOR phosphorylates IMP2 to promote IGF2 mRNA translation by internal ribosomal entry. Genes Dev. 2011;25:1159–1172. doi: 10.1101/gad.2042311. [DOI] [PMC free article] [PubMed] [Google Scholar]
- Dinman JD. Pathways to Specialized Ribosomes: The Brussels Lecture. J Mol Biol. 2015 doi: 10.1016/j.jmb.2015.12.021. [DOI] [PMC free article] [PubMed] [Google Scholar]
- Dobin A, Davis CA, Schlesinger F, Drenkow J, Zaleski C, Jha S, Batut P, Chaisson M, Gingeras TR. STAR: Ultrafast universal RNA-seq aligner. Bioinformatics. 2013;29:15–21. doi: 10.1093/bioinformatics/bts635. [DOI] [PMC free article] [PubMed] [Google Scholar]
- Ekstrand MI, Nectow AR, Knight ZA, Latcha KN, Pomeranz LE, Friedman JM. Molecular profiling of neurons based on connectivity. Cell. 2014;157:1230–1242. doi: 10.1016/j.cell.2014.03.059. [DOI] [PMC free article] [PubMed] [Google Scholar]
- Fernández IS, Bai XC, Murshudov G, Scheres SHW, Ramakrishnan V. Initiation of translation by cricket paralysis virus IRES requires its translocation in the ribosome. Cell. 2014;157:823–831. doi: 10.1016/j.cell.2014.04.015. [DOI] [PMC free article] [PubMed] [Google Scholar]
- Filbin ME, Kieft JS. Toward a structural understanding of IRES RNA function. Curr Opin Struct Biol. 2009;19:267–276. doi: 10.1016/j.sbi.2009.03.005. [DOI] [PMC free article] [PubMed] [Google Scholar]
- Fujii K, Shi Z, Zhulyn O, Denans N, Barna M. Pervasive translational regulation of the cell signalling circuitry underlies mammalian development. Nat Commun. 2017;8:14443. doi: 10.1038/ncomms14443. [DOI] [PMC free article] [PubMed] [Google Scholar]
- Guimaraes JC, Zavolan M. Patterns of ribosomal protein expression specify normal and malignant human cells. Genome Biol. 2016;17:236. doi: 10.1186/s13059-016-1104-z. [DOI] [PMC free article] [PubMed] [Google Scholar]
- Heiman M, Schaefer A, Gong S, Peterson JD, Day M, Ramsey KE, Suarez-Farinas M, Schwarz C, Stephan DA, Surmeier DJ, et al. A translational profiling approach for the molecular characterization of CNS cell types. Cell. 2008;135:738–748. doi: 10.1016/j.cell.2008.10.028. [DOI] [PMC free article] [PubMed] [Google Scholar]
- Heyer EE, Moore MJ. Redefining the Translational Status of 80S Monosomes. Cell. 2016;164:757–769. doi: 10.1016/j.cell.2016.01.003. [DOI] [PubMed] [Google Scholar]
- Hooper M, Hardy K, Handyside a, Hunter S, Monk M. HPRT-deficient (LeschNyhan) mouse embryos derived from germline colonization by cultured cells. Nature. 1987;326:292–295. doi: 10.1038/326292a0. [DOI] [PubMed] [Google Scholar]
- Hsu F, Kent JW, Clawson H, Kuhn RM, Diekhans M, Haussler D. The UCSC known genes. Bioinformatics. 2006;22:1036–1046. doi: 10.1093/bioinformatics/btl048. [DOI] [PubMed] [Google Scholar]
- Ingolia NT, Ghaemmaghami S, Newman JRS, Weissman JS. Genome-wide analysis in vivo of translation with nucleotide resolution using ribosome profiling. Science. 2009;324:218–223. doi: 10.1126/science.1168978. [DOI] [PMC free article] [PubMed] [Google Scholar]
- Ingolia NT, Brar GA, Rouskin S, McGeachy AM, Weissman JS. The ribosome profiling strategy for monitoring translation in vivo by deep sequencing of ribosome-protected mRNA fragments. Nat Protoc. 2012;7:1534–1550. doi: 10.1038/nprot.2012.086. [DOI] [PMC free article] [PubMed] [Google Scholar]
- Jinek M, Chylinski K, Fonfara I, Hauer M, Doudna JA, Charpentier E. A Programmable Dual-RNA-Guided DNA Endonuclease in Adaptive Bacterial Immunity. Science. 2012;337:816–821. doi: 10.1126/science.1225829. [DOI] [PMC free article] [PubMed] [Google Scholar]
- De Keersmaecker K, Atak ZK, Li N, Vicente C, Patchett S, Girardi T, Gianfelici V, Geerdens E, Clappier E, Porcu M, et al. Exome sequencing identifies mutation in CNOT3 and ribosomal genes RPL5 and RPL10 in T-cell acute lymphoblastic leukemia. Nat Genet. 2013;45:186–190. doi: 10.1038/ng.2508. [DOI] [PMC free article] [PubMed] [Google Scholar]
- Kieft JS. Viral IRES RNA structures and ribosome interactions. Trends Biochem Sci. 2008;33:274–283. doi: 10.1016/j.tibs.2008.04.007. [DOI] [PMC free article] [PubMed] [Google Scholar]
- Kondrashov N, Pusic A, Stumpf CR, Shimizu K, Hsieh AC, Xue S, Ishijima J, Shiroishi T, Barna M. Ribosome-mediated specificity in Hox mRNA translation and vertebrate tissue patterning. Cell. 2011;145:383–397. doi: 10.1016/j.cell.2011.03.028. [DOI] [PMC free article] [PubMed] [Google Scholar]
- Landry DM, Hertz MI, Thompson SR. RPS25 is essential for translation initiation by the Dicistroviridae and hepatitis C viral IRESs. Genes Dev. 2009;23:2753–2764. doi: 10.1101/gad.1832209. [DOI] [PMC free article] [PubMed] [Google Scholar]
- Lange V, Picotti P, Domon B, Aebersold R. Selected reaction monitoring for quantitative proteomics: A tutorial. Mol Syst Biol. 2008;4:222–235. doi: 10.1038/msb.2008.61. [DOI] [PMC free article] [PubMed] [Google Scholar]
- Langmead B, Salzberg SL. Fast gapped-read alignment with Bowtie 2. Nat Methods. 2012;9:357–359. doi: 10.1038/nmeth.1923. [DOI] [PMC free article] [PubMed] [Google Scholar]
- Lee AS, Burdeinick-Kerr R, Whelan SP. A ribosome-specialized translation initiation pathway is required for cap-dependent translation of vesicular stomatitis virus mRNAs. Proc Natl Acad Sci U S A. 2013;110:324–329. doi: 10.1073/pnas.1216454109. [DOI] [PMC free article] [PubMed] [Google Scholar]
- MacLean B, Tomazela DM, Shulman N, Chambers M, Finney GL, Frewen B, Kern R, Tabb DL, Liebler DC, MacCoss MJ. Skyline: An open source document editor for creating and analyzing targeted proteomics experiments. Bioinformatics. 2010;26:966–968. doi: 10.1093/bioinformatics/btq054. [DOI] [PMC free article] [PubMed] [Google Scholar]
- Majzoub K, Hafirassou ML, Meignin C, Goto A, Marzi S, Fedorova A, Verdier Y, Vinh J, Hoffmann JA, Martin F, et al. RACK1 controls IRES-mediated translation of viruses. Cell. 2014;159:1086–1095. doi: 10.1016/j.cell.2014.10.041. [DOI] [PMC free article] [PubMed] [Google Scholar]
- Mali P, Yang L, Esvelt KM, Aach J, Guell M, DiCarlo JE, Norville JE, Church GM. RNA-guided human genome engineering via Cas9. Science. 2013;339:823–826. doi: 10.1126/science.1232033. [DOI] [PMC free article] [PubMed] [Google Scholar]
- Martin M. Cutadapt removes adapter sequences from high-throughput sequencing reads. EMBnet journal. 2011;17:10. [Google Scholar]
- McCann K, Baserga S. Mysterious ribosomopathies. Science. 2013;341:849–850. doi: 10.1126/science.1244156. [DOI] [PMC free article] [PubMed] [Google Scholar]
- McIntosh KB, Bhattacharya A, Willis IM, Warner JR. Eukaryotic cells producing ribosomes deficient in rpl1 are hypersensitive to defects in the ubiquitin-proteasome system. PLoS One. 2011;6 doi: 10.1371/journal.pone.0023579. [DOI] [PMC free article] [PubMed] [Google Scholar]
- Narla A, Ebert BL. Ribosomopathies: human disorders of ribosome dysfunction. Blood. 2010;115:3196–3205. doi: 10.1182/blood-2009-10-178129. [DOI] [PMC free article] [PubMed] [Google Scholar]
- Perkins DN, Pappin DJ, Creasy DM, Cottrell JS. Probability-based protein identification by searching sequence databases using mass spectrometry data. Electrophoresis. 1999;20:3551–3567. doi: 10.1002/(SICI)1522-2683(19991201)20:18<3551::AID-ELPS3551>3.0.CO;2-2. [DOI] [PubMed] [Google Scholar]
- Picotti P, Aebersold R. Selected reaction monitoring–based proteomics: workflows, potential, pitfalls and future directions. Nat Methods. 2012;9:555–566. doi: 10.1038/nmeth.2015. [DOI] [PubMed] [Google Scholar]
- Pöll G, Braun T, Jakovljevic J, Neueder A, Jakob S, Woolford JL, Tschochner H, Milkereit P. rRNA maturation in yeast cells depleted of large ribosomal subunit proteins. PLoS One. 2009;4 doi: 10.1371/journal.pone.0008249. [DOI] [PMC free article] [PubMed] [Google Scholar]
- Ran FA, Hsu PD, Wright J, Agarwala V, Scott Da, Zhang F. Genome engineering using the CRISPR-Cas9 system. Nat Protoc. 2013;8:2281–2308. doi: 10.1038/nprot.2013.143. [DOI] [PMC free article] [PubMed] [Google Scholar]
- Ricci EP, Kucukural A, Cenik C, Mercier BC, Singh G, Heyer EE, Ashar-Patel A, Peng L, Moore MJ. Staufen1 senses overall transcript secondary structure to regulate translation. Nat Publ Gr. 2013;21:26–35. doi: 10.1038/nsmb.2739. [DOI] [PMC free article] [PubMed] [Google Scholar]
- Robinson MD, McCarthy DJ, Smyth GK. edgeR: a Bioconductor package for differential expression analysis of digital gene expression data. Bioinformatics. 2010;26:139–140. doi: 10.1093/bioinformatics/btp616. [DOI] [PMC free article] [PubMed] [Google Scholar]
- Sanz E, Yang L, Su T, Morris DR, McKnight GS, Amieux PS. Cell-type-specific isolation of ribosome-associated mRNA from complex tissues. Proc Natl Acad Sci U S A. 2009;106:13939–13944. doi: 10.1073/pnas.0907143106. [DOI] [PMC free article] [PubMed] [Google Scholar]
- Schrodinger LLC. The PyMOL Molecular Graphics System. Version 1.3r1 2010 [Google Scholar]
- Shannon P, Markiel A, Ozier O, Baliga NS, Wang JT, Ramage D, Amin N, Schwikowski B, Ideker T. Cytoscape: A software Environment for integrated models of biomolecular interaction networks. Genome Res. 2003;13:2498–2504. doi: 10.1101/gr.1239303. [DOI] [PMC free article] [PubMed] [Google Scholar]
- Shi Z, Barna M. Translating the Genome in Time and Space: Specialized Ribosomes, RNA Regulons, and RNA-Binding Proteins. Annu Rev Cell Dev Biol. 2015;31:100814–125346. doi: 10.1146/annurev-cellbio-100814-125346. annurev – cellbio –. [DOI] [PubMed] [Google Scholar]
- Slavov N, Semrau S, Budnik B, Van A, Slavov N, Semrau S, Airoldi E, Budnik B, Oudenaarden AVan. Differential Stoichiometry among Core Ribosomal Proteins. CellReports. 2015;13:865–873. doi: 10.1016/j.celrep.2015.09.056. [DOI] [PMC free article] [PubMed] [Google Scholar]
- Spahn CMT, Jan E, Mulder A, Grassucci RA, Sarnow P, Frank J. Cryo-EM visualization of a viral internal ribosome entry site bound to human ribosomes: The IRES functions as an RNA-based translation factor. Cell. 2004;118:465–475. doi: 10.1016/j.cell.2004.08.001. [DOI] [PubMed] [Google Scholar]
- Subramanian aR, Dabbs ER. Functional studies on ribosomes lacking protein L1 from mutant Escherichia coli. Eur J Biochem. 1980;112:425–430. doi: 10.1111/j.1432-1033.1980.tb07222.x. [DOI] [PubMed] [Google Scholar]
- Szklarczyk D, Franceschini a, Wyder S, Forslund K, Heller D, Huerta-Cepas J, Simonovic M, Roth a, Santos a, Tsafou KP, et al. STRING v10: protein-protein interaction networks, integrated over the tree of life. Nucleic Acids Res. 2014;43:D447–D452. doi: 10.1093/nar/gku1003. [DOI] [PMC free article] [PubMed] [Google Scholar]
- Tassy O, Pourquié O. Manteia, a predictive data mining system for vertebrate genes and its applications to human genetic diseases. Nucleic Acids Res. 2014;42 doi: 10.1093/nar/gkt807. [DOI] [PMC free article] [PubMed] [Google Scholar]
- Thompson A, Schäfer J, Kuhn K, Kienle S, Schwarz J, Schmidt G, Neumann T, Hamon C. Tandem mass tags: A novel quantification strategy for comparative analysis of complex protein mixtures by MS/MS. Anal Chem. 2003;75:1895–1904. doi: 10.1021/ac0262560. [DOI] [PubMed] [Google Scholar]
- Valášek L, Szamecz B, Hinnebusch AG, Nielsen KH. In Vivo Stabilization of Preinitiation Complexes by Formaldehyde Cross-Linking. Methods Enzymol. 2007;429:163–183. doi: 10.1016/S0076-6879(07)29008-1. [DOI] [PubMed] [Google Scholar]
- Wang QS, Jan E. Switch from cap- to factorless IRES-dependent 0 and +1 frame translation during cellular stress and dicistrovirus infection. PLoS One. 2014;9 doi: 10.1371/journal.pone.0103601. [DOI] [PMC free article] [PubMed] [Google Scholar]
- Weingarten-Gabbay S, Elias-Kirma S, Nir R, Gritsenko AA, Stern-Ginossar N, Yakhini Z, Weinberger A, Segal E. Systematic discovery of cap-independent translation sequences in human and viral genomes. Science. 2016;351:1–24. doi: 10.1126/science.aad4939. [DOI] [PubMed] [Google Scholar]
- Xue S, Barna M. Specialized ribosomes: a new frontier in gene regulation and organismal biology. Nat Rev Mol Cell Biol. 2012;13:355–369. doi: 10.1038/nrm3359. [DOI] [PMC free article] [PubMed] [Google Scholar]
- Xue S, Tian S, Fujii K, Kladwang W, Das R, Barna M. RNA regulons in Hox 5′ UTRs confer ribosome specificity to gene regulation. Nature. 2015;517:33–38. doi: 10.1038/nature14010. [DOI] [PMC free article] [PubMed] [Google Scholar]
- Yi EC, Lee H, Aebersold R, Goodlett DR. A microcapillary trap cartridge-microcapillary high-performance liquid chromatography electrospray ionization emitter device capable of peptide tandem mass spectrometry at the attomole level on an ion trap mass spectrometer with automated routine operatio. Rapid Commun Mass Spectrom. 2003;17:2093–2098. doi: 10.1002/rcm.1150. [DOI] [PubMed] [Google Scholar]
- Yoon A, Peng G, Brandenburger Y, Zollo O, Xu W, Rego E, Ruggero D. Impaired control of IRES-mediated translation in X-linked dyskeratosis congenita. Science. 2006;312:902–906. doi: 10.1126/science.1123835. [DOI] [PubMed] [Google Scholar]
- Zhou C, Zang D, Jin Y, Wu H, Liu Z, Du J, Zhang J. Mutation in ribosomal protein L21 underlies hereditary hypotrichosis simplex. Hum Mutat. 2011;32:710–714. doi: 10.1002/humu.21503. [DOI] [PubMed] [Google Scholar]
Associated Data
This section collects any data citations, data availability statements, or supplementary materials included in this article.
Supplementary Materials
Table S1 (Related to Figure 1). List of peptides and transitions for SRM quantification
Table S2 (Related to Figure 2). Relative abundance of RPs in polysomes compared to the free subunits, quantified by relative quantification using TMT
Table S3 (Related to Figure 3). RPS25/eS25-Ribo-Seq enriched/depleted gene list
Table S4 (Related to Figure 3). RPL10A/uL1-Ribo-Seq enriched/depleted gene list
Table S5 (Related to the STAR methods). Primers used in this study.
Movie S1. A 360° rotational view of mammalian ribosome with sub-stoichiometric RPs highlighted in blue. Related to Figure 1.
The ribosomal large subunit (60S) is at top and small subunit (40S) at bottom, shown on a structural model of the human ribosome with all other RPs in light grey (Anger et al., 2013) (PDB files 4V6X). The 28S, 5S and 5.8S rRNAs are shown in light orange and 18S rRNA in light green.
Data Availability Statement
Sequencing data are deposited in the Gene Expression Omnibus under accession number GSE73357.