Abstract
Vitamin E (α-tocopherol; VitE) is a lipophilic antioxidant required for normal embryonic development in vertebrates, but the long-term effects of embryonic VitE deficiency, and whether they are ameliorated by feeding VitE−adequate diets, remain unknown. We addressed these questions using a zebrafish (Danio rerio) model of developmental VitE deficiency followed by dietary remediation. Adult zebrafish maintained on VitE−deficient (E−) or sufficient (E+) diets were spawned to obtained E− and E+ embryos, respectively, which we evaluated up to 12 days post-fertilization (dpf). The E− group suffered significantly increased morbidity and mortality as well as altered DNA methylation status through 5 dpf when compared to E+ larvae, but upon feeding with a VitE-adequate diet from 5–12 dpf both the E− and E+ groups survived and grew normally; the DNA methylation profile also was similar between groups by 12 dpf. However, 12 dpf E− larvae still had behavioral defects. These observations coincided with sustained VitE deficiency in the E− vs. E+ larvae (p< 0.0001), despite adequate dietary supplementation. We also found in E− vs. E+ larvae continued docosahexaenoic acid (DHA) depletion (p< 0.0001) and significantly increased lipid peroxidation. Further, targeted metabolomics analyses revealed persistent dysregulation of the cellular antioxidant network, the CDP-choline pathway, and glucose metabolism. While anaerobic processes were increased, aerobic metabolism was decreased in the E− vs. E+ larvae, indicating mitochondrial damage. Taken together, these outcomes suggest embryonic VitE deficiency causes lasting behavioral impairments due to persistent lipid peroxidation and metabolic perturbations that are not resolved via later dietary VitE supplementation.
Keywords: α-tocopherol, brain, docosahexaenoic acid, choline, dietary supplementation, mitochondria
Graphical abstract
INTRODUCTION
Vitamin E (α-tocopherol; VitE) is required for healthy fetal development, as its deficiency during pregnancy causes fetal resorption in rodents [1], and human studies associate maternal VitE inadequacy with early miscarriage [2]. Further, our recent work using a zebrafish model of embryonic VitE deficiency indicates VitE is essential for normal neurodevelopment: VitE-deficient (E−) compared to VitE-sufficient (E+) zebrafish embryos have increased mortality, severe morphological abnormalities including cranio-facial deformities [3,4], and also exhibit marked neurobehavioral perturbations [3–5]. Such outcomes likely are mediated via multiple, pleiotropic mechanisms that all arise from VitE’s role as a potent lipophilic antioxidant [6].
Initially, increased lipid peroxidation in E− embryos depletes them of docosahexaenoic acid (DHA, 22:6n-3) [3,7], resulting in the increased recycling/turnover and depletion of DHA-containing phospholipids and lysophospholipids [4], particularly those containing choline (phosphatidylcholine; PCs and lyso-PCs, respectively), including lyso-PC 22:6, the form of DHA preferentially taken up by the brain [8] through the specific transporter, MFSD2A [9,10]. This secondary depletion of choline coincides with cranio-facial deformities analogous to the neural tube defects evident in animal [11] and human [12] reports of maternal choline deficiency that, notably, also occur during neurulation [13] with complete VitE deficiency in genetically-manipulated zebrafish embryos at 15–17 hours post-fertilization (hpf) [14]. Given choline’s established role in cognitive development [15], VitE likely is essential for the fetal brain not only because it protects membrane DHA from excessive peroxidation, but also because it facilitates adequate perinatal choline status.
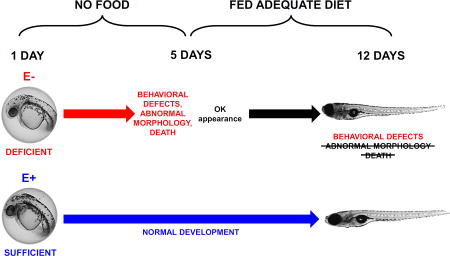
Furthermore, the increased lipid peroxidation in E− embryos perturbs their cellular antioxidant network, which ultimately disrupts aerobic energy metabolism, causing a significant decrease in whole-body (and, presumably, brain) glucose levels, and thus adversely impacts neurobehavioral outcomes by depriving the embryonic brain of sufficient energy to grow and function [3,5]. These consequences are avoided with proactive VitE repletion because an α-tocopherol emulsion administered into the yolk of 0 hpf E− embryos entirely prevents mortality and morbidity outcomes [5]. However, remediation of VitE deficiency-induced (i.e. secondary) nutrient deficiencies only partially rescues E− embryos, as observed following glucose supplementation into the yolk at one day of age (24 hpf; after established VitE deficiency but prior to glucose depletion) [3]. Together, this data suggests the effects of developmental VitE deficiency may be prevented, but not necessarily reversed. We hypothesized, therefore, that deleterious outcomes of embryonic VitE deficiency cannot be ameliorated fully though later supplementation with VitE and other depleted nutrients (e.g. DHA and choline), and that long-term cognitive defects will persist in E− compared with E+ embryos despite dietary intervention. To test this hypothesis, we selected normal appearing E− or E+ embryos, then fed them a complete diet for 7 days and analyzed them for behavioral, biochemical, and morphological changes.
MATERIALS AND METHODS
Materials and reagents
The following reagents were used for metabolomics analyses: methanol and ultra-pure water (LC-MS grade, EMD Millipore, Gibbstown, NJ); zirconium oxide beads (Next Advance; Averill Park, NY); formic acid, acetic acid (Optima LC/MS grade; Fisher Chemical, Pittsburgh, PA); Deuterium (d) labeled internal standards DHA-d5, ARA-d8, EPA-d5, LA-d4, ALA-d14, 9(S)-HODE-d4, and 5-HETE-d8 (Cayman Chemical, Ann Arbor, MI) and butylated hydroxytoluene (BHT, TCI America; Portland, OR) were used for quantification of total and free fatty acids, and oxidized lipid derivatives, respectively.
Zebrafish husbandry and diets
The Institutional Animal Care and Use Committee of Oregon State University approved this protocol (ACUP Number: 4706). Tropical 5D strain (5D) zebrafish (Danio rerio) were housed in the Sinnhuber Aquatic Research Laboratory. Adults were kept at standard laboratory conditions of 28°C on a 14-h light/10-h dark photoperiod in fish water (FW) consisting of reverse osmosis water supplemented with a commercially available salt (Instant Ocean®) to create a salinity of 600 microsiemens [13]. Sodium bicarbonate was added as needed to adjust the pH to 7.4. At 55 days post-fertilization (dpf), zebrafish were randomly allocated to one of two diet groups, α-tocopherol deficient (E−) or α-tocopherol sufficient (E+), and fed one of the defined diets for the duration of the study [16]. The defined diets, which contained only fatty acids with 18 or fewer carbons and two or three double bonds, were prepared with the vitamin C source as StayC (500 mg/kg, Argent Chemical Laboratories Inc., Redmond, WA) and without (E−) or with added α-tocopherol (E+, 500 mg RRR-α-tocopheryl acetate/kg diet, ADM, Decatur, IL), as described previously [14,16]. Diets were stored at −20°C until fed to the adult zebrafish.
E− and E+ embryos were obtained from adult fish fed either the E− or E+ diet, respectively, for a minimum of 80 days up to 9 months. Larvae were harvested through natural group spawning, collected, staged [13], and kept in standard embryo media (EM; as described [17] using 0.137 M NaCl, 5.4 mM KCl, 0.25 mM Na2HPO4, 0.44 mM KH2PO4, 1.3 mM CaCl2, 1.0 mM MgSO4 and 4.2 mM NaHCO3; pH 7.2–7.4) for up to 12 days. Media was changed and freshly replenished once daily. Note that embryos are not fed prior to 5 days post-fertilization (dpf), as each is a complete unit containing only those nutrients present in the yolk when eggs are laid, which the embryo fully utilizes by approximately 5–6 dpf (larval stage). Beginning at 5 dpf, larvae were hand-fed once daily for 7 days a commercial, nutritionally complete zebrafish food (GEMMA Micro 75 ZF, Skreeting; Fontaine les Vervins, France). The food is manufactured with fish meal and fish oils (sources of long-chain polyunsaturated ω-3 fatty acids), α-tocopheryl acetate (minimum 400 IU/kg diet) and vitamin C (minimum 1000 mg/kg diet). Proximate analysis of the diet composition provided by the company was Proteins (59%), Oil (14%), Ash (14%), Fiber (0.2%), and Phosphorous (1.3%). For all experiments described below, the E+ larvae are considered the control condition; lab 5D larvae from adult zebrafish maintained on GEMMA Micro 300 ZF (Skreeting; Fontaine les Vervins, France) also were used as an additional control to monitor larval quality (data not shown). Larvae used for biochemical analysis, described below, were euthanized by cold exposure (placed on ice for ≥30 minutes) then snap-frozen in liquid nitrogen prior to sampling. Levels of α-tocopherol in embryos and larvae were quantified as described [3].
Diet fatty acid composition and quantification
The total fatty acid compositions of the defined adult E− and E+ diets as well as the commercial GEMMA Micro 75 ZF diet were analyzed and quantified via saponification followed by GC-MS using established protocols [18].
Evaluation of phenotypic and developmental progress
Morbidity and mortality outcomes were assessed as described previously [3], using the zebrafish acquisition and analysis program (ZAAP). ZAAP is a custom program designed to inventory, acquire, and manage zebrafish data, and was used to collect 22 developmental endpoints, as either present or absent (i.e. binary responses were recorded, described below [19]). At 4 and 12 dpf, larval morphology (body axis, eye, snout, jaw, otic vesicle, notochord, heart, brain, somite, fin, yolk-sac, trunk, circulation, pigment, and swim bladder) was evaluated and recorded and behavioral endpoints (motility, tactile response) were thoroughly evaluated. If the embryo was dead at either 4 or 12 dpf, the non-mortality endpoints were not included in the evaluations. All images were taken using a Keyence BZ-700X microscope with a 2X objective lens under standard bright-field conditions.
Locomotor response assay
Locomotor activity was measured in a total of n=80 morphologically normal larvae per diet group (3 replicate trials) using Viewpoint Zebrabox [19]. Briefly, at 12 dpf, six-well plates containing the larvae (5 larvae per well) were placed in a Viewpoint ZebraBox (software version 3.0, Viewpoint Life Sciences, Lyon, France). Embryo locomotor activity was assessed using the “tracking” setting during alternating periods of light and dark, a modification of [20]. Locomotor activity in response to the light/dark transition was tracked during 3-minute periods of alternating light and dark for a total of 24 min. The integration time was set to 6 seconds to increase statistical power. A high definition camera (30 frames/second) tracked the total movement (swim distance, millimeters) in response to the multiple light-dark transitions.
Larval avoidance assay
The larvae were imaged with a custom-built imaging system made as described previously by [21]. In brief, the system includes a 15-megapixel Canon EOS Rebel T1i digital camera and an Acer Aspire 5517 laptop with a 15.6-inch screen to provide visual stimuli to the larvae. Larval behavior was examined in ‘five-lane’ plates, with 5 larvae per lane (25 larvae per plate: 10 E−, 10 E+, and 5 lab control; 4 plates per trial for 3 separate trials). The five-lane plate is made using a Nunc 1-well rectangular plate (Fisher 12-565-493), 50 ml of 0.8% agarose in water, and a CNC-milled plastic mold. Each lane is 18 mm wide, 70 mm long and 3.5 mm deep and has 60° sloping edges to avoid shadows and blind spots along the perimeter of the swimming area. The lanes have ample space to examine larval avoidance of aversive visual stimuli. Larvae were first imaged for 15 minutes without visual stimuli and then for 15 minutes in the presence of a moving red bar, which is 1.3 cm wide and moves up and down at a speed of 17 mm/second in the upper half of the lanes. Images were acquired every 6 seconds for a 30-minute period and were analyzed in ImageJ. ImageJ macro (version 25k), downloaded by request from [22], was used to automatically separate the color channels, subtract the background, apply a threshold, identify larvae based on particle size, and repeats these steps for subsequent images in a series. The macro generates a list of X,Y coordinates indicating the location and orientation of the larvae over time, which are used to calculate (Excel, Microsoft): a) the percentage of time that the larvae are located in the lower half of the lane, away from the visual stimuli, b) the swim speed, c) the percentage of time that the larvae rest, which is defined as the percentage of time the larvae move less than 1 mm in a 6 second interval, d) the average distance between larvae, e) the percentage of time that larvae are together, which is defined as less than 5 mm apart from the nearest neighbor, and f) the percentage of time that larvae are located along the edge of the lane, which is defined as the outer 3 mm perimeter of the swimming area. Parameters a, b, c, and f were used for behavioral analyses in the present study.
Extraction and LC-MS/MS for metabolomic analysis
At 12 dpf, E− and E+ morphologically normal larvae (n= 10 per replicate, n= 4 replicates per group) were transferred to 1.5 mL Eppendorf tubes, covered with EM, and euthanized via cold-exposure (see above). EM was carefully removed to prevent loss of larvae and samples were stored at −80 °C overnight. To extract larvae for metabolomics analyses, solvent (300 µL 80:20 v/v methanol:water) was added, then sample extracts were homogenized with 0.5 mm zirconium oxide beads using a counter-top bullet blender for 6 min. Following 15 min. incubation on ice, the extracts were centrifuged at 4 °C at 15,000×g for 13 min. Aliquots (200 µL) of the upper layer were transferred individually to new tubes and stored at −80 °C until analysis via LC-MS/MS. To ensure the stability and repeatability of the LC–MS system, quality control (QC) samples (n= 4), generated by pooling 10 µL aliquots from each larval extract, were analyzed with the larval samples.
Chromatography was performed with a Shimadzu Nexera system (Shimadzu; Columbia, MD, USA) coupled to a high-resolution hybrid quadrupole-time-of-flight mass spectrometer (TripleTOF® 5600; SCIEX; Framingham, MA, USA), as described previously [3].
Sample preparation, extraction and LC-MS/MS analyses of total or free DHA, EPA, ARA, ALA, and LA fatty acids and oxidized lipids
Extraction for total docosahexaenoic acid (DHA), eicosapentaenoic acid (EPA), arachidonic acid (ARA), alpha linolenic acid (ALA), and linoleic acid (LA) were performed as described [3,7] with the following modifications: samples were obtained at 12 dpf (n=5 larvae per replicate, 5 replicates per group) homogenized in a solution of 1.0 mL water and 2.0 mL 1% ascorbic acid in ethanol (w/v), then saponified with the addition of 300 µL saturated KOH; following cooling, the pH was adjusted to 2.5 with 12N HCl, then 2.0 mL heptane and 10 µL internal [DHA-d5 (1.0 µg/mL), EPA-d5 (1.0 µg/mL), ARA-d8 (2.0 µg/mL), ALA-d14 (1.0 µg/mL) and LA-d4 (2.0 µg/mL)] were added. Samples were mixed, the supernatant (organic layer) was removed and dried under nitrogen gas, resuspended in 100 µL 80:20 v/v methanol:water with 50 µg/mL BHT and 0.5% v/v acetic acid. Samples were stored at −80 °C until analysis by LC-MS/MS (see below).
Extracts for quantitative free fatty acid and hydroxy-DHA analyses were prepared as described for metabolomics samples, with the following modifications: extraction solvent (290 µL, 80:20 v/v methanol:water) included 50 µg/mL BHT and for quantification was combined with 10 µL per sample of internal standards of DHA-d5 (1.0 µg/mL), EPA-d5 (1.0 µg/mL), ARA-d8 (2.0 µg/mL), ALA-d14 (1.0 µg/mL), LA-d4 (2.0 µg/mL), 5-HETE-d8 (1.0 µg/mL) and 9(S)-HODE-d4 (1.0 µg/mL).
QC samples were prepared as described for metabolomic analysis. Amounts were quantitated by relative comparison to internal standards, see below.
Chromatographic separations were carried out on 4.6 × 250 mm J’sphere ODS-H80 (4 µm, YMC Co, Kyoto, Japan) for negative ion analysis. TOF-MS and TOF-MS/MS were operated with same parameters as for metabolomics, described previously [3].
Global DNA methylation and hydroxy-methylation quantification
DNA isolation was performed using a Zymo ZF-Duet DNA/RNA MiniPrep Kit (Zymo Research; Irvine, CA). Embryo (1–5 dpf) and larval (12 dpf) samples (n=8–16 per sample depending on age; 4 replicate samples per group) were collected into 1.5 mL lock-top tubes; excess EM was removed and 425 microL lysate buffer (from kit) was added. Samples were homogenized using a bullet blender, as described for metabolomics sample preparation above. Global DNA methylation (5-methylcystosine quantification, 5-mC) and hydroxy-methylation (5-hmC) were assessed using MethylFlash Global DNA Methylation (5-mC) ELISA Easy Kit (Colorimetric) and MethylFlash Global DNA Hydroxymethylation (5-hmC) ELISA Easy Kit (Colorimetric), respectively, from EpiGentek USA (Farmingdale, NY) Experiments were repeated in duplicate.
Statistical analyses
Statistical analyses for morphological and locomotor endpoints were performed using code developed in R (R Developmental Core Team 2014, http://www.R-project.org), as reported [3].
Avoidance assay data were exported to Microsoft Excel, individual parameters averaged (means with SEM) for baseline and stimulus periods for each diet condition, and then transferred to GraphPad Prism 6.0 software (GraphPad, La Jolla, CA) for subsequent analyses using 2-way ANOVA with Tukey’s post-test for multiple comparisons (p< 0.05).
Targeted metabolomics data processing was performed as described previously [3] using PeakView software (SCIEX). The Holm-Sidak method for multiple comparisons was used to compare normalized metabolite intensity values (responses) between the two diet groups for metabolites (n ≤ 12 metabolites per pathway/category analyses) involved in separate metabolic pathways/categories (Supplementary Table 1) with significance set at p< 0.05. All statistical analyses were performed using GraphPad Prism 6.0 software (GraphPad, La Jolla, CA).
Quantification of total and free fatty acids, and oxidized lipids was performed using MutliQuant Software version 3.0.2 (SCIEX), as performed previously [3]. Statistical analyses were performed as for metabolomics data (above).
Quantification of global DNA methylation and hydroxymethylation was determined per respective kit instructions. Additional statistical analyses (e.g. 2-way ANOVA with Sidak’s post-test for multiple comparisons with significance set at p< 0.05) were performed using GraphPad Prism 6.0 software (GraphPad, La Jolla, CA).
RESULTS
Larvae development and behavior
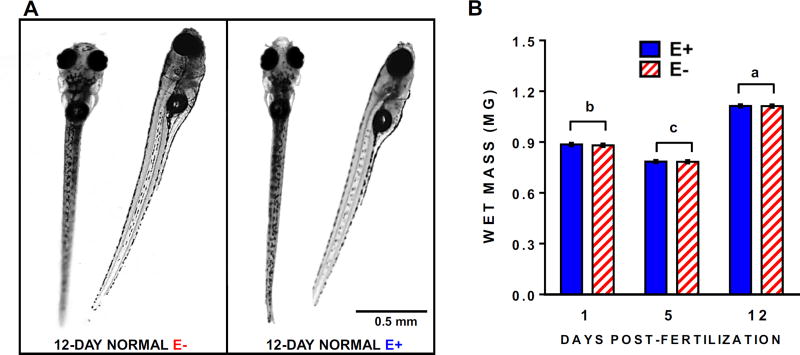
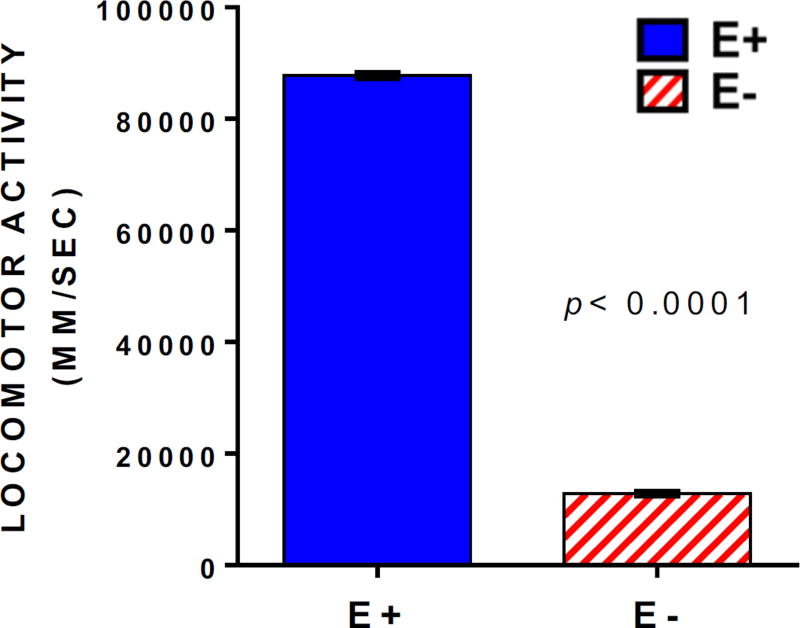
E− embryos suffer increased morbidity and mortality over the first 5 days post-fertilization (dpf) relative to E+ embryos [3]; however, a small subset remains morphologically normal. We selected 5 dpf (larval stage) E− and E+ larvae without evident physical deformities to be hand-fed once daily for 7 days a commercial, nutritionally complete zebrafish food. Larvae in both groups appeared to develop normally and grew similarly (Figure 1). They displayed similar daily swimming and feeding activity; however, high-throughput behavioral screening at 12 dpf showed that the E− larvae sustained neurodevelopmental perturbations, as they were 85% less responsive to light-dark transition stimuli in a locomotor response assay (Figure 2).
Figure 1.
E− and E+ larvae maintained on standard zebrafish diets from 5–12 days post-fertilization grow and develop normally. (A) Morphologically normal 12-day-old E− and E+ larvae used in the present study. (B) Wet weight of morphologically normal E− and E+ larvae (n= 10 per group). Shown are means ± SEM; 2-way ANOVA with unique letters indicating significantly different values (p< 0.05) with Tukey’s post-test for multiple comparisons.
Figure 2.
Locomotor behavior is impaired in E− compared with E+ larvae despite consuming an adequate diet. The 12-day-old larvae were analyzed in 6-well plates (n= 80 per group; 3 replicate trials). Embryos with morphological defects were not included in data analysis. Locomotor activities following a series of light stimuli (a stimulus every 6 for 24 min) were measured as distance moved (mm) over time (seconds). Bar chart comparisons of respective time-course data (area under the curve ± SEM); E− (red diagonal bar) larvae were 85% less responsive to light than were E+ (blue solid bar) larvae (significance was determined using a Kolmogorov–Smirnov test with significance set at p< 0.01).
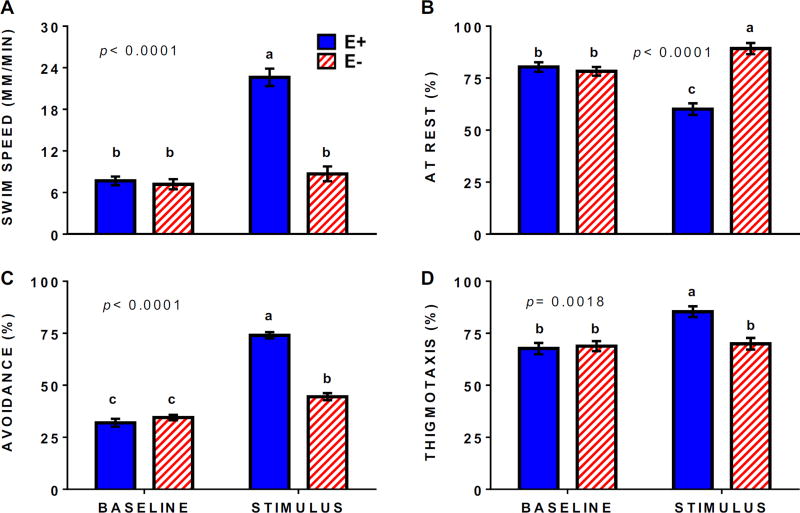
While the locomotor response assay is a robust screening tool, it does not differentiate between neurological impairments in cognitive function (i.e. inability to interpret and respond appropriately to a stimulus) from physiological defects in perception (i.e. inability to sense or observe a stimulus). To investigate cognitive endpoints, we used an active avoidance assay [21] to evaluate characteristics of larval behavior in response to an aversive stimulus (visual presentation of a moving red bar). Swimming parameters (e.g. speed, location, overall activity/movement) were similar between E− and E+ larvae during baseline conditions, indicating no motor impairments in the E− group (Figure 3A). By contrast, during the stimulus only the E+ larvae demonstrated obvious aversive behavior by swimming faster (Figure 3A), increasing overall swimming (Figure 3B), and moving away from the red bar (Figure 3C), as well as demonstrating thigmotaxis (preference for lane edges; Figure 3D), an expected behavior and validated index of anxiety in zebrafish larvae [23]. The E− larvae failed to demonstrate a typical avoidance response and instead showed decreased overall movement in response to the moving bar with a greater percentage of the larvae remaining “at rest” compared to baseline conditions (Figure 3B), although, apparently, the E− larvae could adequately perceive the moving bar because they increased avoidance swimming significantly compared to baseline (Figure 3C).
Figure 3.
Perturbed responses of E− larvae to an avoidance assay are indicative of compromised neurodevelopment. Behaviors were quantified using a high-throughput response assay in which larvae (n= 40 per group; 3 replicate trials) were exposed to a blank background (baseline) and to a red moving bar (stimulus) in a PowerPoint presentation, as performed by [21]. (A) Average swim speed (mm/min). (B) Resting state (% of time that larvae move less than 1 mm/6 sec interval). (C) Avoidance of visual stimuli (larvae are in the bottom of the lane, away from the moving bar stimulus). (D) Edge preference or thigmotaxis (larvae are less than 3 mm from the lane perimeter). Shown are means ± SEM; 2-way ANOVA with Tukey’s post-test for multiple comparisons; unique letters indicate significant differences (p< 0.05).
Evaluation of VitE repletion
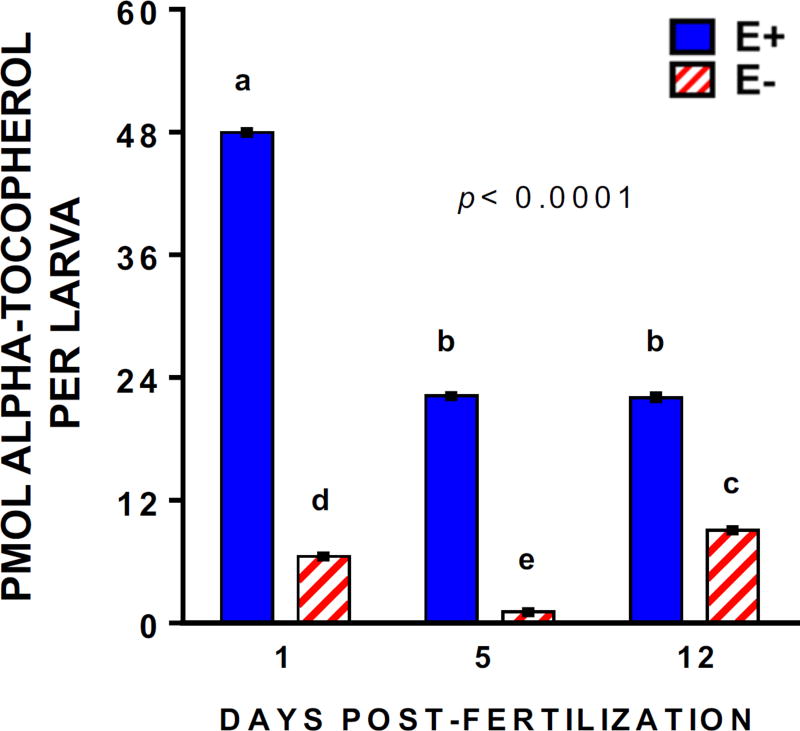
The behavioral abnormalities in the E− larvae were unexpected given their apparent normal phenotype and their week-long adequate dietary intake (413 ± 4 mg α-tocopherol per kg diet). Although measured VitE concentrations in E− larvae at 12 dpf were increased significantly from those measured at 5 dpf; however, they were approximately 2.5 times lower in E− compared to E+ larvae. VitE levels were unchanged from 5 to 12 dpf in the E+ group, indicating the commercial food contained adequate VitE to maintain sufficiency in E+ larvae (Figure 4).
Figure 4.
E− larvae remain VitE−deficient despite consuming an adequate diet for 7-days. Quantification as described [3] of α-tocopherol in E− compared to E+ larvae (n=5 larvae per sample; 5 replicates per group) from a representative clutch. Shown are means ± SEM; p-values are for 2-way ANOVA of VitE x Age interactions, with Tukey’s post-test for multiple comparisons, p<0.05 for bars bearing unique letters).
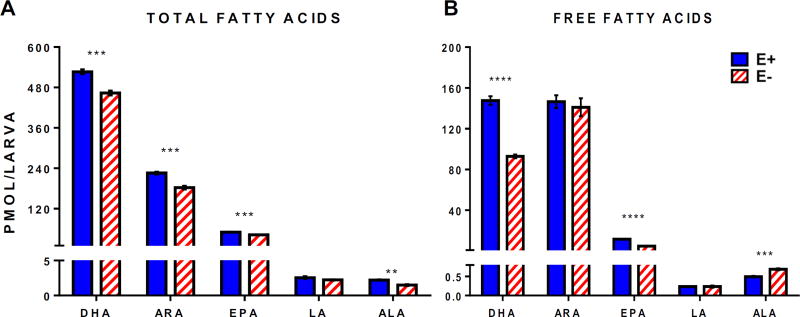
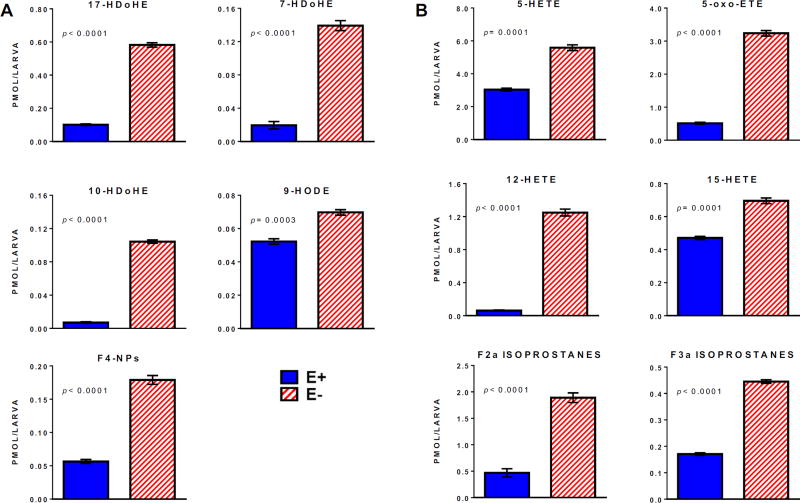
We hypothesized that this sustained VitE deficiency in the E− larvae were due to the abundant amounts of long-chain polyunsaturated fatty acids present in the commercial diet (DHA: 1169 ± 2; EPA: 592 ± 2; ARA: 73 ± 0.4 µg/g food). In E− compared with E+ larvae measured concentrations of total (saponified) and free (unesterified) DHA, as well as other n-3 and n-6 LC-PUFAs, were significantly lower (Figure 5). These respective decreases likely resulted from increased lipid peroxidation in the E− larvae, based on their increases in oxidized n-3 (HDoHE, HODE) and n-6 (HETE, oxo-ETE) fatty acid concentrations (Figure 6). Notably, the F4-series neuroprostanes (F4-NPs, Figure 6A), which are non-enzymatic DHA peroxidation products specific to nervous tissue [24], were increased more than 3-fold. (Note: the approach used does not permit unequivocal identification of the specific F4-NP isomer(s), we did confirm that the metabolite mass, retention time, and ms/ms fragmentation pattern matched those of the 4-series F4-NPs, e.g. high-intensity [M+H] precursor ion m/z at 343.227). Additionally, non-enzymatic n-6 ARA-derived F2- and F3-isoprostanes [25] were also higher in E− vs E+ larvae (Figure 6B). Together, the increases in F4-NPs as well as F2- and F3-isoprostanes show increased free radical-induced lipid peroxidation in 12 dpf E− larvae. Previously, oxidized and unoxidized lipids were reported in Medaka and higher F2-isoprostanes were found relative to F3-isoprostanes and F4-neuroprostanes; similar (within a factor of 10) values are reported for muscle as compared with our whole larvae [26].
Figure 5.
E− larvae have decreased DHA and other differences in n-3 and n-6 fatty acids during maintenance on a high-DHA diet. Quantified levels of total and free (unesterified) fatty acids in E− vs. E+ larvae were quantified from LC/MS-TOF area counts normalized using internal standards (n= 5 samples/group, with n= 5 larvae/sample for total lipids; n= 4 samples/group with n= 10 larvae/sample for free fatty acids). Total and free fatty acid measurements both were obtained from the same cohort of larvae. Shown are saponified (A) and extracted only (B) samples, means ± SEM. Statistical significance (p<0.05) was calculated using the Holm-Sidak method for multiple comparisons of normalized intensity values. Paired comparisons p-values are indicated as **<0.01, ***<0.001, **** <0.0001. Abbreviations: ALA (α-linolenic acid); LA (linoleic acid); EPA (eicosapentaenoic acid); ARA (arachidonic acid); DHA (docosahexaenoic acid).
Figure 6.
E− larvae have increased levels of oxidized n-3 and n-6 lipid derivatives. (A) oxidized n-3 lipids, and (B) oxidized n-6 lipids, analyzed as described for Figure 5(B). Abbreviations: 5-, 12-, 15-HETE, 5-, 12-, 15-hydroxy-eicosatetraenoic acids; 5-oxo-ETE, 5-oxo-eicosatetraenoic acid; 17-, 7-, 10-HDoHE, 17-, 7-, 10-hydroxy-docosahexaenoic acids; 9-HODE, 9-hydroxy-docosahexaenoic acid; F4-NPs, shown as 7-series 9-3,5-Dihydroxy-2-2,5-octadien-1-yl cyclopentyl-7-hydroxy-4,8-nonadienoic acid.
Metabolic consequences of continued VitE inadequacy
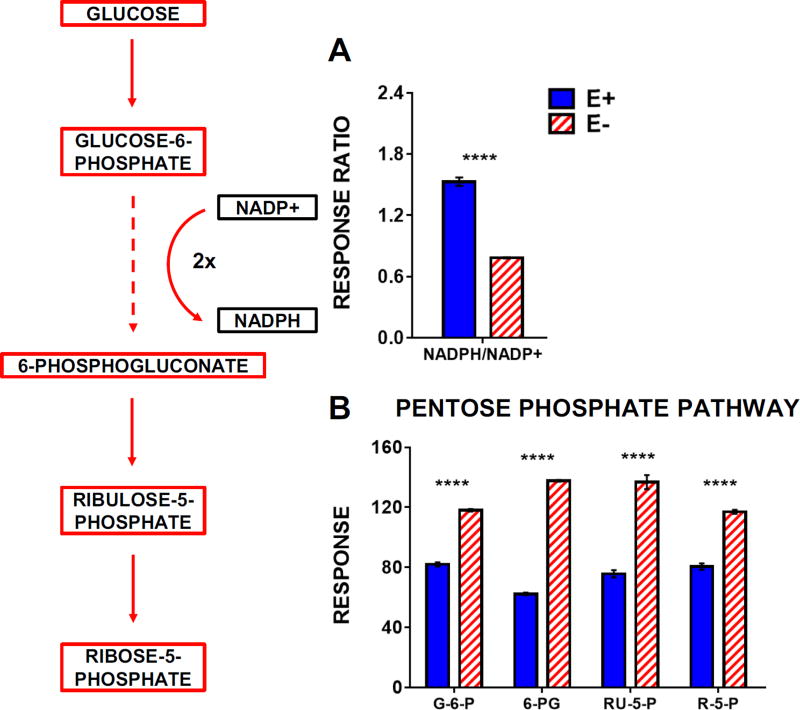
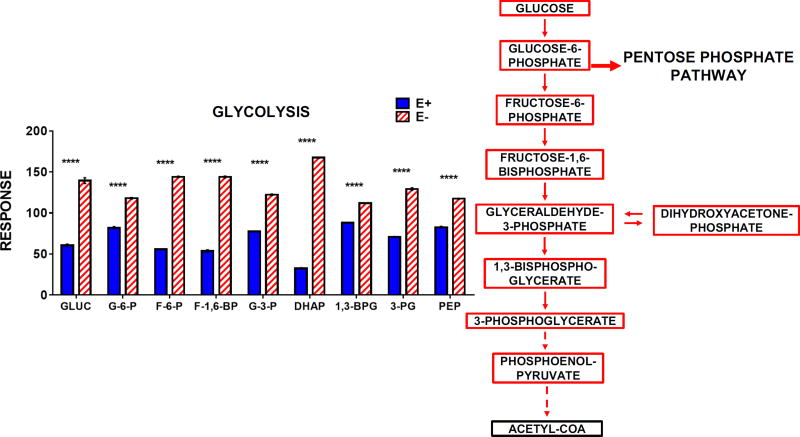
Increased lipid peroxidation in the E− larvae resulted in significant oxidation of the cellular antioxidant network: targeted metabolomics analyses showed E− compared with E+ larvae had lower levels of ascorbic acid and glutathione concomitant with increased levels of each metabolite’s respective oxidized form (Figure 7A-B). Interestingly, both NADPH and NADP+ were elevated in the E− larvae (Figure 7B), but the NADPH/NADP+ ratio was significantly decreased (Figure 8A), indicating enhanced NADPH oxidation (consumption) and a reduced NADPH reserve. We hypothesized that these perturbations in E− larvae would prompt greater metabolic activity via the pentose phosphate pathway (PPP) – a primary endogenous source of NADPH known to be active in the brain [27]. Our metabolomics data revealed that, indeed, glucose and PPP intermediates were significantly increased in the E− larvae (Figure 8B), indicating enhanced metabolic flux through this pathway. Similar elevations in glycolytic intermediates also were observed (Figure 9), mimicking the metabolomic profile of E− embryos at 1 dpf [3], a time at which the embryo still retains ample nutrient-stores in the yolk. These parallels suggest that VitE-deficiency promotes a hypermetabolic response, aimed at ameliorating insults to (and preserving function of) the cellular antioxidant network, when sufficient substrate (glucose) is available.
Figure 7.
E− larvae have sustained metabolic perturbations to the cellular antioxidant network despite consuming adequate diets for 7-days. (A) Antioxidant network scheme showing interaction of antioxidants with lipid radicals and consumption or NAD(P)H. (B) E− and E+ larvae (n= 10/sample; 4 samples/group) relative response data was normalized against QC sample intensities (n= 4) for each individual metabolite. Boxes shown in Red (increased in E− or Blue (increased in E+) represent metabolites that were higher in E− or E+ larvae, respectively. Black boxes indicate relative levels of a given metabolite are not shown in the figure. Statistical significance (p<0.05) was determined using the Holm-Sidak method for multiple comparisons of normalized intensity values. Shown are means ± SEM, p-values are indicated as **** <0.0001.
Abbreviations: LOO ▪, lipid radical; LOOH, oxidized lipid; α-TOC-OH, α-tocopherol; α-TOC-O ▪, α-tocopheroxyl radical; AA−, ascorbic acid; A− ▪ ascorbate radical; DH-A, dehydroascorbate; GSH, glutathione; GSSG, glutathione disulfide; PUFAs, polyunsaturated fatty acids.
Figure 8.
E− larvae contain higher levels of pentose-phosphate pathway intermediates and show increased NADPH utilization when compared to E+ larvae. The outlined metabolic pathway diagram (left) shows the relationship of the metabolites shown in the bar charts in A and B. Solid lines indicate direct reactions and dashed lines denote several reaction steps between metabolites. Boxes shown in Red (increased in E− or Blue (increased in E+) represent metabolites that were higher in E− or E+ larvae, respectively. Black boxes indicate relative levels of a given metabolite are not shown in the figure. Data were analyzed as in Figure 7. Abbreviations: 6-PG, 6-phosphogluconate; RU-5-P, ribulose-5-phosphate; R-5-P, ribose-5-phosphate
Figure 9.
E− larvae contain increased levels of glucose, glycolytic intermediates, and ketogenic amino acid when compared to E+ larvae. The outlined metabolic pathway diagram (left) shows the relationship of the metabolites shown in the bar chart. Solid lines indicate direct reactions and dashed lines denote several reaction steps between metabolites. Boxes shown in Red (increased in E− or Blue (increased in E+) represent metabolites that were higher in E− or E+ larvae, respectively. Black boxes indicate relative levels of a given metabolite are not shown in the figure. Data were analyzed as in Figure 7. Abbreviations: GLUC, glucose; G-6-P glucose-6-phosphate; F-6-P, fructose-6-phosphate; F-1,6-BP, fructose-1,6,-bisphosphate; G-3-P, glyceraldehyde-3-phosphate; DHAP, dihydroxyacetone phosphate; 1,3-BPG, 1,3-bisphosphoglycerate; 3-PG, 3-phosphoglycerate; PEP, phosphoenolpyruvate
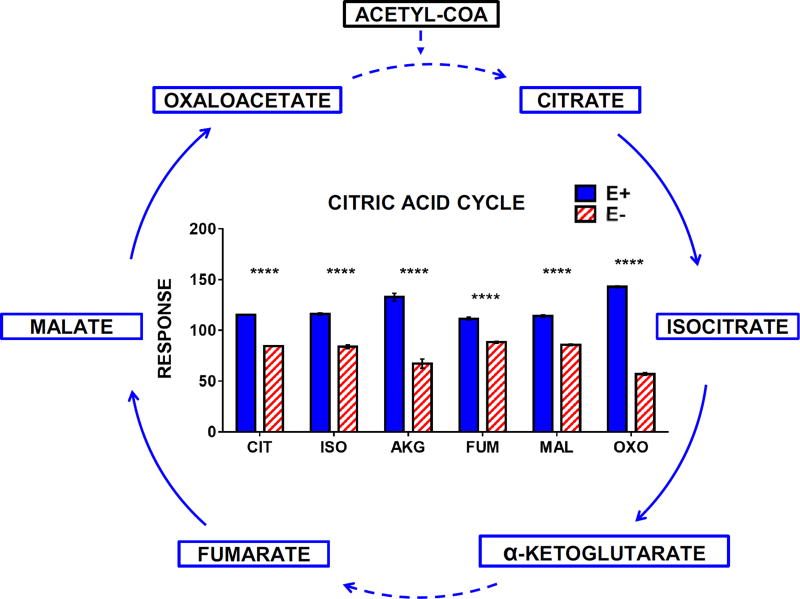
Interestingly, in contrast to the above, levels of citric acid cycle intermediates were decreased in the E− embryos (Figure 10), indicating the possibility of impaired aerobic metabolism and compromised mitochondrial function, as found during more prolonged developmental VitE deficiency in 2 dpf (but not 1 dpf) E− embryos [3].
Figure 10.
E− larvae have perturbed aerobic metabolism when compared to E+ larvae. The outlined metabolic pathway diagram (left) shows the relationship of the metabolites shown in the bar chart. Solid lines indicate direct reactions and dashed lines denote several reaction steps between metabolites. Boxes shown in Red (increased in E− or Blue (increased in E+) represent metabolites that were higher in E− or E+ larvae, respectively. Black boxes indicate relative levels of a given metabolite are not shown in the figure. Data were analyzed as in Figure 7. Abbreviations: CIT, citrate; ISO, isocitrate; AKG, α-ketoglutarate; FUM, fumarate; MAL, malate; OXO, oxaloacetate
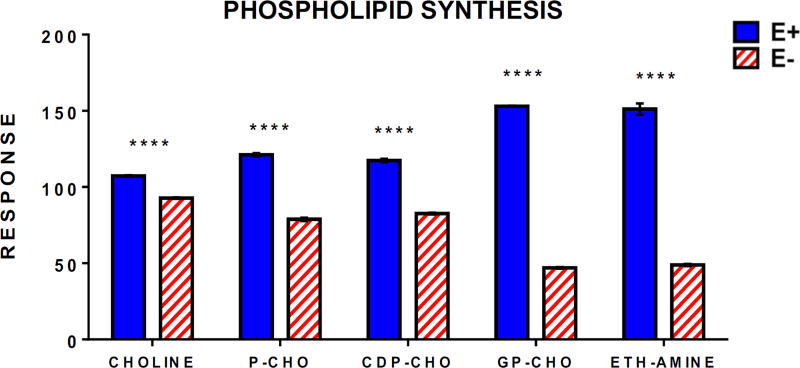
VitE deficiency-induced lipid peroxidation (and ensuing DHA depletion) also causes increased DHA-containing phospholipid (DHA-PL) and lysophospholipid (lyso-PL) recycling/turnover, which leads to the depletion of choline-containing PLs (PCs) [4] and results in a secondary choline deficiency in E− embryos [3]. Thus, we hypothesized that choline levels also would be significantly lower in E− compared to E+ larvae. Targeted metabolomics analyses of choline and choline-containing compounds involved in PC synthesis revealed these metabolites were significantly lower in the E− larvae (Figure 11). Analyses of choline-derived methyl-donor metabolites (e.g. betaine, S-adenyslmethionine), however, showed no differences between E− and E+ groups (Supplementary Table 1). Previously, we observed depletion of both choline and choline-derived methyl donors (e.g. betaine, S-adenosylmethionine) in E− embryos[3,5], which is consistent with the decreased global DNA methylation status from 1–4 dpf in E− vs. E+ embryos. The dietary choline supply was presumably adequate to restore and maintain normal methyl-donor status and DNA methylation in the 12 dpf E− larvae (Figure 12).
Figure 11.
Phospholipid synthesis is lower in E− larvae despite maintenance on a choline-adequate diet. Relative response intensities of choline, CDP-choline pathway, and PEMT pathway metabolites. E− and E+ larvae (n=10/sample; 4 samples/group) data were normalized against QC sample intensities (n=4) for each individual metabolite. Statistical significance (p<0.05) was determined as described in Figure 7. Shown are means ± SEM, p-values are indicated as **** <0.0001.
Figure 12.
Minor decreases in choline levels at 12 days post-fertilization in E− compared to E+ larvae do not disturb global DNA methylation. Global (total) DNA methylation (5-methylcytosine content; 5-mC) and hydroxy-methylation (5-hydroxy-methylcytosine; 5-hmC) were quantified and expressed as percentages of total DNA cytosine content (19.3% for zebrafish, [68]) in E− and E+ embryos/larvae from 1–5 and 12 dpf (n= 8–16 per sample; 4 sample replicates per group). Shown are means ± SEM; 2-way ANOVA with Tukey’s post-test, statistical significance set at p<0.05. Paired comparison p-values are indicated as * <0.05, **<0.01, ***<0.001, **** <0.0001. **** <0.0001.
DISCUSSION
Developmental VitE deficiency causes neurobehavioral impairments that are resolved with preventative VitE supplementation initiated early during the embryonic period [5]; however, these perturbations are not readily reversed via later dietary remediation. Results from our behavioral assessments in 12 dpf E− and E+ larvae show rescue was not possible using a nutritionally complete diet as an intervention strategy, despite the apparent normal phenotype of the animals (Figure 1). We found that E− larvae sustain marked locomotor deficits in response to light/dark stimuli (Figure 2). An established symptom of overt VitE deficiency in humans and rodent is spinocerebellar ataxia [28,29], therefore outcomes of our locomotor assay alone were insufficient to indicate specifically cognitive impairments in the E− larvae because lasting motor-related neuropathologies could contribute to the reduced locomotor response observed in the E-group. To deduce specifically whether this outcome was due to cognitive, motor, or perceptual (e.g. vision) defects in E− larvae, we next performed an active avoidance assay using a visual threat (moving red bar). Although E− larvae behaved similarly to E+ larvae during baseline conditions and showed no signs of motor (swimming) impairments (Figure 3), the E− group did not exert a typical avoidance response (Figure 3A-B [21], or evident measures of anxiety (Figure 3D) [23] as observed in E+ larvae. Instead, most E− larvae “froze” (i.e. stopped moving appreciably; Figure 3B). Such freezing may constitute a maladaptive avoidance response suggestive of cognitive dysfunction, as reported in studies of neurologically impaired adult zebrafish [30]. A small subset of E− larvae appeared to perform avoidance swimming by moving away from the red bar (Figure 3C), but this response was far less pronounced than that of the E+ larvae, and E− swimming speeds between baseline and stimulus conditions remained unchanged (Figure 3A). Overall, since the E− larva responded to, and therefore perceived, stimuli presentation, they presumably suffer cognitive (not perceptual) defects, which adversely impacted their ability to quickly and appropriately execute behavioral tasks. Additional tests of visual acuity in E− vs. E+ larvae [31] are necessary to verify this interpretation.
The continued neurocognitive impairments may be attributed to sustained VitE deficiency at 12 dpf in the E− compared with E+ larvae (Figure 4). We hypothesize that concomitant dietary supplementation with copious amounts of LC-PUFAs led to substantially increased antioxidant requirements and utilization resulting from the enhanced lipid peroxidation in the E− state (especially of highly-unsaturated DHA, [32]), as found in previous reports [33,34]. Our observations that (1) VitE status was maintained from 5 to 12 dpf in the E+ larvae, (2) E− larval VitE levels increased significantly from 5 to 12 dpf (Figure 4), and (3) differences over time in quantified total, unesterified (free), and oxidized lipid levels previously measured in 5 dpf larvae [3,5] compared to levels in 12 dpf larvae (Figures 5 and 6) showed parallel patterns of change in both E− and E+ groups, provide evidence that although the diet contained adequate VitE to support normal antioxidant requirements in growing zebrafish, the E− group, given their initial state of extreme VitE deficiency, may require greater amounts of VitE to achieve repletion (i.e. VitE levels equal to the E+ group). Future experiments utilizing different feeding regimens are needed to better address the requirements and/or potential for complete resolution of VitE deficiency in the E− larvae, and to determine if, once deficiency is fully ameliorated, the E− group remains cognitively impaired.
Decreases in DHA and ARA (Figure 5) resulting from elevated lipid peroxidation in E− compared to E+ larvae (Figure 6) also potentially underlie the former group’s cognitive dysfunction, since both DHA [35] and ARA [36] are essential for healthy fetal neurodevelopment. Of relevance to brain function are the F4-NPs, which were ~3.5 times higher in E− compared to E+ larvae (Figure 6A). Both animal [37] and human [38] studies demonstrate that brain F4-NPs are elevated during enhanced oxidative stress and pathological cognitive decline. Higher levels of additional autoxidized DHA products such as 10-HDoHE [39] (Figure 6A) further suggest free radical-induced lipid peroxidation of brain DHA due to inadequate antioxidant (VitE) protection in E− larvae, though the possibility of aberrant enzymatic activity (e.g. of lipoxygenases) warrants attention as well.
Our metabolomics data showing consequent depletion of antioxidants (Figure 7), a decrease in the NADPH/NADP+ ratio (Figure 8A), and elevated glucose metabolism through the PPP (Figure 8) in E− larvae suggest that continued lipid peroxidation prolonged the diversion of glucose to the PPP in the E− group, as the animal attempted to generate adequate NADPH to replenish and preserve antioxidant network function under conditions of VitE deficiency, as reported in models of increased cerebral oxidative stress [40]. Interestingly, glucose utilization via cytosolic, anaerobic metabolic pathways (specifically, the PPP (Figure 8) and glycolytic pathway (Figure 9)) were higher in E− compared with E+ larvae, as observed in 1 dpf E− embryos [3]. However, the aerobic metabolism via the citric acid cycle was decreased in E− vs E+ larvae (Figure 10), which matches the metabolic profile of 2 dpf E− embryos, which also exhibit deranged mitochondrial function in bioenergetic profiling assays [3]. Thus, it may be that once VitE deficiency devastates mitochondrial function during the embryonic period, the damage is irreparable, and normal aerobic metabolism cannot be restored regardless of substrate (glucose) availability. Such would be especially detrimental to the brain, since neurons are highly dependent on aerobic metabolism/oxygen utilization [41] and die rapidly if deprived of energy substrate (e.g. glucose), as in cerebral ischemia [42].
Targeted metabolomics analyses also indicated continued relative choline deficiency in the E− vs. E+ larvae, potentially due to upregulated PC synthesis (Figure 11), especially via the phosphatidylethanolamine N-methyltransferase (PEMT) pathway, which utilizes PLs with an ethanolamine headgroup (PEs; notably, ethanolamine was decreased in E− vs. E+ larvae) to synthesize PC species enriched in DHA [43]. These data match our previous reports [3,4] and provide evidence for continued perturbations in membrane PL remodeling. Lasting effects of reduced choline availability may partially underlie compromised cognition in the E− larvae, as demonstrated in mouse models of prenatal choline deficiency [44]. These consequences possibly are mediated by methyl donor-dependent epigenetic mechanisms [45] related to DNA methylation status, established either during the embryonic and/or larval periods.
Numerous studies focused on the redox-control of energy metabolism [46] show that DNA methylation (epigenetic) events mediate cellular bioenergetics [47]. We found decreased global DNA methylation (5-methylcytosine content; 5-mC) in E− embryos from 1–4 dpf (Figure 12) during periods of more severe choline deficiency [3,5]; however, levels measured at 12 dpf were not different. Presumably, once provided with an adequate dietary source, the E− larvae utilized available choline to restore vital methyl-donor dependent reactions such as DNA methylation at the expense of maintaining PC synthesis (Figure 11), indicating a potential hierarchy in the endogenous functions of choline. Our findings showing elevated levels of global 5-hydroxymethylcytosine (5-hmC) by 5 dpf as well as an increased 5-hmC/5-mC in E− vs. E+ larvae by 2 dpf (Figure 12), both indicative of oxidative stress-induced chemical changes to DNA [47], also suggest that developmental perturbations – though no longer present at 12 dpf – may partially underlie the continued behavioral disruptions in E− larvae, as evidenced in models of autism [48]. Both DNA methylation and hydroxymethylation are known to regulate neural crest formation [49] and other neurodevelopmental processes [50]; thus, future studies focused on brain and gene-specific methylation status rather than global DNA methylation alone are warranted to investigate the possibility of altered methylation and hydroxymethylation profiles that specifically, and potentially permanently, affects cognitive development.
A unifying mechanism potentially linking developmental VitE deficiency with many of the metabolic perturbations reported herein – all of which may perturb brain function – is ferroptosis, a process of non-apoptotic programmed cell death [51] that involves several key features observed in our E− larvae, most critically: 1) enhanced enzymatic lipid peroxidation [52], especially due to excessive ARA metabolism via 5- [53] and 15-lipooxygenase [54] activities (Figure 6A-B; including 5- and 15-HETE; 5-oxo-ETE [55]); 2) glutathione depletion [56] (Figure 7); and 3) mitochondrial dysfunction [57] (Figure 10). We also found E− larvae had increased levels of glutamate (p< 0.001; Supplementary Table 1) relative to E+ larvae, which could signify glutamate toxicity, another metabolic perturbation associated with ferroptosis [53] via inhibition of the cellular cysteine/glutamate antiporter system Xc- [51]. Excessive glutamate is neurotoxic [58] and may be a consequence of compromised mitochondria [59]; additional experiments regarding the regulation of neuronal intracellular glutamate levels are required to determine whether these mechanisms also apply to our VitE deficiency model. Importantly, VitE supplementation successfully prevents ferroptosis [60] and associated neurological impairments [61], while VitE deficiency exacerbates the latter [62], indicating that ferroptosis may constitute a biological rationale for the consequences of embryonic VitE deficiency we observed in E− larvae.
Taken together, our data reveals embryonic VitE deficiency causes lasting perturbations in lipid, antioxidant, and energy metabolism, despite consumption of an adequate diet at the larval stage. These combined outcomes may underlie the sustained neurocognitive abnormalities evident in the E− larvae, suggesting that embryonic VitE inadequacy has long-term adverse effects on the brain, as observed with prenatal DHA [63] and choline [64] deficiencies, respectively, during critical periods of brain development. Such findings substantiate the provocative contention that VitE also is a nutrient of similar status and significance, both for the fetal brain and for long-term cognitive function, and provide evidence to encourage future reevaluation of recommended VitE intake levels to promote optimal neurodevelopment and cognitive health in humans. Currently, there is only limited information available on the role of VitE in miscarriage [2,65] and cognitive function [66,67] in humans. Clearly, more research is needed in this area.
Supplementary Material
HIGHLIGHTS.
Embryonic vitamin E (VitE) deficiency causes lasting neurocognitive impairments.
Behavioral defects may be due to persisting secondary DHA and choline deficiencies.
Continued lipid peroxidation perpetuates aerobic energy metabolism dysregulation.
Sustained metabolic perturbations suggest permanent damage to mitochondria.
Underlying mechanisms potentially include ferroptosis and altered DNA methylation.
Acknowledgments
The authors thank Carrie Barton, Jane La Du, Greg Gonnerman, Dr. Michael Simonich, and Dr. Donald Jump for their superior technical assistance. NIH grant S10RR027878 (MGT) and NIEHS P30ES000210 (RT) supported this work. MGT supported in part by the Ava Helen Pauling endowment to the LPI.
Abbreviations
- dpf
days post-fertilization
- DHA
docosahexaenoic acid
- hpf
hours post-fertilization
- α-tocopherol; VitE
vitamin E
- E−
VitE deficient
- E+
VitE sufficient
Footnotes
Publisher's Disclaimer: This is a PDF file of an unedited manuscript that has been accepted for publication. As a service to our customers we are providing this early version of the manuscript. The manuscript will undergo copyediting, typesetting, and review of the resulting proof before it is published in its final citable form. Please note that during the production process errors may be discovered which could affect the content, and all legal disclaimers that apply to the journal pertain.
References
- 1.Evans HM, Bishop KS. On the existence of a hitherto unrecognized dietary factor essential for reproduction. Science. 1922;56:650–651. doi: 10.1126/science.56.1458.650. [DOI] [PubMed] [Google Scholar]
- 2.Shamim AA, Schulze K, Merrill RD, Kabir A, Christian P, Shaikh S, Wu L, Ali H, Labrique AB, Mehra S, Klemm RD, Rashid M, Sungpuag P, Udomkesmalee E, West KP., Jr First-trimester plasma tocopherols are associated with risk of miscarriage in rural Bangladesh. Am J Clin Nutr. 2015;101:294–301. doi: 10.3945/ajcn.114.094920. [DOI] [PubMed] [Google Scholar]
- 3.McDougall M, Choi J, Kim HK, Bobe G, Stevens JF, Cadenas E, Tanguay R, Traber MG. Lethal dysregulation of energy metabolism during embryonic vitamin E deficiency. Free Radic Biol Med. 2017;104:324–332. doi: 10.1016/j.freeradbiomed.2017.01.020. [DOI] [PMC free article] [PubMed] [Google Scholar]
- 4.McDougall MQ, Choi J, Stevens JF, Truong L, Tanguay RL, Traber MG. Lipidomics and H2(18)O labeling techniques reveal increased remodeling of DHA-containing membrane phospholipids associated with abnormal locomotor responses in alpha-tocopherol deficient zebrafish (danio rerio) embryos. Redox Biol. 2016;8:165–174. doi: 10.1016/j.redox.2016.01.004. [DOI] [PMC free article] [PubMed] [Google Scholar]
- 5.McDougall M, Choi J, Kim HK, Bobe G, Stevens JF, Cadenas E, Tanguay R, Traber MG. Lipid quantitation and metabolomics data from vitamin E-deficient and - sufficient zebrafish embryos from 0 to 120 hours-post-fertilization. Data Brief. 2017;11:432–441. doi: 10.1016/j.dib.2017.02.046. [DOI] [PMC free article] [PubMed] [Google Scholar]
- 6.Burton GW, Joyce A, Ingold KU. First proof that vitamin E is major lipid-soluble, chain-breaking antioxidant in human blood plasma. Lancet. 1982;2:327. doi: 10.1016/s0140-6736(82)90293-8. [DOI] [PubMed] [Google Scholar]
- 7.Lebold KM, Kirkwood JS, Taylor AW, Choi J, Barton CL, Miller GW, La Du J, Jump DB, Stevens JF, Tanguay RL, Traber MG. Novel liquid chromatography-mass spectrometry method shows that vitamin E deficiency depletes arachidonic and docosahexaenoic acids in zebrafish (Danio rerio) embryos. Redox Biol. 2013;2:105–113. doi: 10.1016/j.redox.2013.12.007. [DOI] [PMC free article] [PubMed] [Google Scholar]
- 8.Lagarde M, Bernoud N, Brossard N, Lemaitre-Delaunay D, Thies F, Croset M, Lecerf J. Lysophosphatidylcholine as a preferred carrier form of docosahexaenoic acid to the brain. J Mol Neurosci. 2001;16:201–204. doi: 10.1385/JMN:16:2-3:201. discussion 215-221. [DOI] [PubMed] [Google Scholar]
- 9.Nguyen LN, Ma D, Shui G, Wong P, Cazenave-Gassiot A, Zhang X, Wenk MR, Goh EL, Silver DL. Mfsd2a is a transporter for the essential omega-3 fatty acid docosahexaenoic acid. Nature. 2014;509:503–506. doi: 10.1038/nature13241. [DOI] [PubMed] [Google Scholar]
- 10.Guemez-Gamboa A, Nguyen LN, Yang H, Zaki MS, Kara M, Ben-Omran T, Akizu N, Rosti RO, Rosti B, Scott E, Schroth J, Copeland B, Vaux KK, Cazenave-Gassiot A, Quek DQ, Wong BH, Tan BC, Wenk MR, Gunel M, Gabriel S, Chi NC, Silver DL, Gleeson JG. Inactivating mutations in MFSD2A, required for omega-3 fatty acid transport in brain, cause a lethal microcephaly syndrome. Nat Genet. 2015;47:809–813. doi: 10.1038/ng.3311. [DOI] [PMC free article] [PubMed] [Google Scholar]
- 11.Fisher MC, Zeisel SH, Mar MH, Sadler TW. Perturbations in choline metabolism cause neural tube defects in mouse embryos in vitro. FASEB J. 2002;16:619–621. doi: 10.1096/fj.01-0564fje. [DOI] [PubMed] [Google Scholar]
- 12.Shaw GM, Finnell RH, Blom HJ, Carmichael SL, Vollset SE, Yang W, Ueland PM. Choline and risk of neural tube defects in a folate-fortified population. Epidemiology. 2009;20:714–719. doi: 10.1097/EDE.0b013e3181ac9fe7. [DOI] [PubMed] [Google Scholar]
- 13.Kimmel CB, Ballard WW, Kimmel SR, Ullmann B, Schilling TF. Stages of embryonic development of the zebrafish. Dev Dyn. 1995;203:253–310. doi: 10.1002/aja.1002030302. [DOI] [PubMed] [Google Scholar]
- 14.Miller GW, Ulatowski L, Labut EM, Lebold KM, Manor D, Atkinson J, Barton CL, Tanguay RL, Traber MG. The alpha-tocopherol transfer protein is essential for vertebrate embryogenesis. PLoS One. 2012;7:e47402. doi: 10.1371/journal.pone.0047402. [DOI] [PMC free article] [PubMed] [Google Scholar]
- 15.Blusztajn JK, Mellott TJ. Neuroprotective actions of perinatal choline nutrition. Clin Chem Lab Med. 2013;51:591–599. doi: 10.1515/cclm-2012-0635. [DOI] [PMC free article] [PubMed] [Google Scholar]
- 16.Lebold KM, Jump DB, Miller GW, Wright CL, Labut EM, Barton CL, Tanguay RL, Traber MG. Vitamin E deficiency decreases long-chain PUFA in zebrafish (Danio rerio) J Nutr. 2011;141:2113–2118. doi: 10.3945/jn.111.144279. [DOI] [PMC free article] [PubMed] [Google Scholar]
- 17.Westerfield M. The Zebrafish Book; A guide for the laboratory use of zebrafish (Danio rerio) Eugene: University of Oregon Press; 2007. [Google Scholar]
- 18.Depner CM, Philbrick KA, Jump DB. Docosahexaenoic acid attenuates hepatic inflammation, oxidative stress, and fibrosis without decreasing hepatosteatosis in a Ldlr(−/−) mouse model of western diet-induced nonalcoholic steatohepatitis. J Nutr. 2013;143:315–323. doi: 10.3945/jn.112.171322. [DOI] [PMC free article] [PubMed] [Google Scholar]
- 19.Saili KS, Corvi MM, Weber DN, Patel AU, Das SR, Przybyla J, Anderson KA, Tanguay RL. Neurodevelopmental low-dose bisphenol A exposure leads to early life-stage hyperactivity and learning deficits in adult zebrafish. Toxicology. 2012;291:83–92. doi: 10.1016/j.tox.2011.11.001. [DOI] [PMC free article] [PubMed] [Google Scholar]
- 20.Truong L, Saili KS, Miller JM, Hutchison JE, Tanguay RL. Persistent adult zebrafish behavioral deficits results from acute embryonic exposure to gold nanoparticles. Comp Biochem Physiol C Toxicol Pharmacol. 2012;155:269–274. doi: 10.1016/j.cbpc.2011.09.006. [DOI] [PMC free article] [PubMed] [Google Scholar]
- 21.Richendrfer H, Creton R. Automated high-throughput behavioral analyses in zebrafish larvae. J Vis Exp. 2013:e50622. doi: 10.3791/50622. [DOI] [PMC free article] [PubMed] [Google Scholar]
- 22.Clift D, Richendrfer H, Thorn RJ, Colwill RM, Creton R. High-throughput analysis of behavior in zebrafish larvae: effects of feeding. Zebrafish. 2014;11:455–461. doi: 10.1089/zeb.2014.0989. [DOI] [PMC free article] [PubMed] [Google Scholar]
- 23.Schnorr SJ, Steenbergen PJ, Richardson MK, Champagne DL. Measuring thigmotaxis in larval zebrafish. Behav Brain Res. 2012;228:367–374. doi: 10.1016/j.bbr.2011.12.016. [DOI] [PubMed] [Google Scholar]
- 24.Dupuy A, Le Faouder P, Vigor C, Oger C, Galano JM, Dray C, Lee JC, Valet P, Gladine C, Durand T, Bertrand-Michel J. Simultaneous quantitative profiling of 20 isoprostanoids from omega-3 and omega-6 polyunsaturated fatty acids by LC-MS/MS in various biological samples. Anal Chim Acta. 2016;921:46–58. doi: 10.1016/j.aca.2016.03.024. [DOI] [PMC free article] [PubMed] [Google Scholar]
- 25.Yen HC, Wei HJ, Lin CL. Unresolved issues in the analysis of F2-isoprostanes, F4-neuroprostanes, isofurans, neurofurans, and F2-dihomo-isoprostanes in body fluids and tissue using gas chromatography/negative-ion chemical-ionization mass spectrometry. Free Radic Res. 2015;49:861–880. doi: 10.3109/10715762.2015.1014812. [DOI] [PubMed] [Google Scholar]
- 26.Chung ML, Lee KY, Lee CY. Profiling of oxidized lipid products of marine fish under acute oxidative stress. Food Chem Toxicol. 2013;53:205–213. doi: 10.1016/j.fct.2012.11.047. [DOI] [PubMed] [Google Scholar]
- 27.Ben-Yoseph O, Camp DM, Robinson TE, Ross BD. Dynamic measurements of cerebral pentose phosphate pathway activity in vivo using [1,6-13C2,6,6-2H2]glucose and microdialysis. J Neurochem. 1995;64:1336–1342. doi: 10.1046/j.1471-4159.1995.64031336.x. [DOI] [PubMed] [Google Scholar]
- 28.Schuelke M. Ataxia with Vitamin E Deficiency. https://www.ncbi.nlm.nih.gov/pubmed/20301419.
- 29.Yokota T, Igarashi K, Uchihara T, Jishage K, Tomita H, Inaba A, Li Y, Arita M, Suzuki H, Mizusawa H, Arai H. Delayed-onset ataxia in mice lacking alpha -tocopherol transfer protein: model for neuronal degeneration caused by chronic oxidative stress. Proc Natl Acad Sci U S A. 2001;98:15185–15190. doi: 10.1073/pnas.261456098. [DOI] [PMC free article] [PubMed] [Google Scholar]
- 30.Agetsuma M, Aizawa H, Aoki T, Nakayama R, Takahoko M, Goto M, Sassa T, Amo R, Shiraki T, Kawakami K, Hosoya T, Higashijima S, Okamoto H. The habenula is crucial for experience-dependent modification of fear responses in zebrafish. Nat Neurosci. 2010;13:1354–1356. doi: 10.1038/nn.2654. [DOI] [PubMed] [Google Scholar]
- 31.Kokel D, Dunn TW, Ahrens MB, Alshut R, Cheung CY, Saint-Amant L, Bruni G, Mateus R, van Ham TJ, Shiraki T, Fukada Y, Kojima D, Yeh JR, Mikut R, von Lintig J, Engert F, Peterson RT. Identification of nonvisual photomotor response cells in the vertebrate hindbrain. J Neurosci. 2013;33:3834–3843. doi: 10.1523/JNEUROSCI.3689-12.2013. [DOI] [PMC free article] [PubMed] [Google Scholar]
- 32.Wagner BA, Buettner GR, Burns CP. Free radical-mediated lipid peroxidation in cells: oxidizability is a function of cell lipid bis-allylic hydrogen content. Biochemistry. 1994;33:4449–4453. doi: 10.1021/bi00181a003. [DOI] [PubMed] [Google Scholar]
- 33.Song JH, Miyazawa T. Enhanced level of n-3 fatty acid in membrane phospholipids induces lipid peroxidation in rats fed dietary docosahexaenoic acid oil. Atherosclerosis. 2001;155:9–18. doi: 10.1016/s0021-9150(00)00523-2. [DOI] [PubMed] [Google Scholar]
- 34.Cho SH, Choi YS. Lipid peroxidation and antioxidant status is affected by different vitamin E levels when feeding fish oil. Lipids. 1994;29:47–52. doi: 10.1007/BF02537090. [DOI] [PubMed] [Google Scholar]
- 35.Lauritzen L, Brambilla P, Mazzocchi A, Harslof LB, Ciappolino V, Agostoni C. DHA Effects in Brain Development and Function. Nutrients. 2016:8. doi: 10.3390/nu8010006. [DOI] [PMC free article] [PubMed] [Google Scholar]
- 36.Hadley KB, Ryan AS, Forsyth S, Gautier S, Salem N., Jr The Essentiality of Arachidonic Acid in Infant Development. Nutrients. 2016;8:216. doi: 10.3390/nu8040216. [DOI] [PMC free article] [PubMed] [Google Scholar]
- 37.De Felice C, Della Ragione F, Signorini C, Leoncini S, Pecorelli A, Ciccoli L, Scalabri F, Marracino F, Madonna M, Belmonte G, Ricceri L, De Filippis B, Laviola G, Valacchi G, Durand T, Galano JM, Oger C, Guy A, Bultel-Ponce V, Guy J, Filosa S, Hayek J, D’Esposito M. Oxidative brain damage in Mecp2-mutant murine models of Rett syndrome. Neurobiol Dis. 2014;68:66–77. doi: 10.1016/j.nbd.2014.04.006. [DOI] [PMC free article] [PubMed] [Google Scholar]
- 38.Markesbery WR, Kryscio RJ, Lovell MA, Morrow JD. Lipid peroxidation is an early event in the brain in amnestic mild cognitive impairment. Ann Neurol. 2005;58:730–735. doi: 10.1002/ana.20629. [DOI] [PubMed] [Google Scholar]
- 39.Derogis PB, Freitas FP, Marques AS, Cunha D, Appolinario PP, de Paula F, Lourenco TC, Murgu M, Di Mascio P, Medeiros MH, Miyamoto S. The development of a specific and sensitive LC-MS-based method for the detection and quantification of hydroperoxy- and hydroxydocosahexaenoic acids as a tool for lipidomic analysis. PLoS One. 2013;8:e77561. doi: 10.1371/journal.pone.0077561. [DOI] [PMC free article] [PubMed] [Google Scholar]
- 40.Amorini AM, Lazzarino G, Di Pietro V, Signoretti S, Lazzarino G, Belli A, Tavazzi B. Metabolic, enzymatic and gene involvement in cerebral glucose dysmetabolism after traumatic brain injury. Biochim Biophys Acta. 2016;1862:679–687. doi: 10.1016/j.bbadis.2016.01.023. [DOI] [PubMed] [Google Scholar]
- 41.Raefsky SM, Mattson MP. Adaptive responses of neuronal mitochondria to bioenergetic challenges: Roles in neuroplasticity and disease resistance. Free Radic Biol Med. 2017;102:203–216. doi: 10.1016/j.freeradbiomed.2016.11.045. [DOI] [PMC free article] [PubMed] [Google Scholar]
- 42.Foster KA, Galeffi F, Gerich FJ, Turner DA, Muller M. Optical and pharmacological tools to investigate the role of mitochondria during oxidative stress and neurodegeneration. Prog Neurobiol. 2006;79:136–171. doi: 10.1016/j.pneurobio.2006.07.001. [DOI] [PMC free article] [PubMed] [Google Scholar]
- 43.Vance DE. Physiological roles of phosphatidylethanolamine N-methyltransferase. Biochim Biophys Acta. 2013;1831:626–632. doi: 10.1016/j.bbalip.2012.07.017. [DOI] [PubMed] [Google Scholar]
- 44.Ishii D, Matsuzawa D, Matsuda S, Tomizawa H, Sutoh C, Shimizu E. Methyl donor-deficient diet during development can affect fear and anxiety in adulthood in C57BL/6J mice. PLoS One. 2014;9:e105750. doi: 10.1371/journal.pone.0105750. [DOI] [PMC free article] [PubMed] [Google Scholar]
- 45.Tomizawa H, Matsuzawa D, Ishii D, Matsuda S, Kawai K, Mashimo Y, Sutoh C, Shimizu E. Methyl-donor deficiency in adolescence affects memory and epigenetic status in the mouse hippocampus. Genes Brain Behav. 2015;14:301–309. doi: 10.1111/gbb.12207. [DOI] [PubMed] [Google Scholar]
- 46.Yin F, Cadenas E. Mitochondria: the cellular hub of the dynamic coordinated network. Antioxid Redox Signal. 2015;22:961–964. doi: 10.1089/ars.2015.6313. [DOI] [PMC free article] [PubMed] [Google Scholar]
- 47.Cyr AR, Domann FE. The redox basis of epigenetic modifications: from mechanisms to functional consequences. Antioxid Redox Signal. 2011;15:551–589. doi: 10.1089/ars.2010.3492. [DOI] [PMC free article] [PubMed] [Google Scholar]
- 48.James SJ, Shpyleva S, Melnyk S, Pavliv O, Pogribny IP. Elevated 5-hydroxymethylcytosine in the Engrailed-2 (EN-2) promoter is associated with increased gene expression and decreased MeCP2 binding in autism cerebellum. Transl Psychiatry. 2014;4:e460. doi: 10.1038/tp.2014.87. [DOI] [PMC free article] [PubMed] [Google Scholar]
- 49.Hu N, Strobl-Mazzulla PH, Bronner ME. Epigenetic regulation in neural crest development. Dev Biol. 2014;396:159–168. doi: 10.1016/j.ydbio.2014.09.034. [DOI] [PMC free article] [PubMed] [Google Scholar]
- 50.Papale LA, Madrid A, Li S, Alisch RS. Early-life stress links 5-hydroxymethylcytosine to anxiety-related behaviors. Epigenetics. 2017;12:264–276. doi: 10.1080/15592294.2017.1285986. [DOI] [PMC free article] [PubMed] [Google Scholar]
- 51.Cao JY, Dixon SJ. Mechanisms of ferroptosis. Cell Mol Life Sci. 2016;73:2195–2209. doi: 10.1007/s00018-016-2194-1. [DOI] [PMC free article] [PubMed] [Google Scholar]
- 52.Yang WS, Kim KJ, Gaschler MM, Patel M, Shchepinov MS, Stockwell BR. Peroxidation of polyunsaturated fatty acids by lipoxygenases drives ferroptosis. Proc Natl Acad Sci U S A. 2016;113:E4966–4975. doi: 10.1073/pnas.1603244113. [DOI] [PMC free article] [PubMed] [Google Scholar]
- 53.Liu Y, Wang W, Li Y, Xiao Y, Cheng J, Jia J. The 5-Lipoxygenase Inhibitor Zileuton Confers Neuroprotection against Glutamate Oxidative Damage by Inhibiting Ferroptosis. Biol Pharm Bull. 2015;38:1234–1239. doi: 10.1248/bpb.b15-00048. [DOI] [PubMed] [Google Scholar]
- 54.Kagan VE, Mao G, Qu F, Angeli JP, Doll S, Croix CS, Dar HH, Liu B, Tyurin VA, Ritov VB, Kapralov AA, Amoscato AA, Jiang J, Anthonymuthu T, Mohammadyani D, Yang Q, Proneth B, Klein-Seetharaman J, Watkins S, Bahar I, Greenberger J, Mallampalli RK, Stockwell BR, Tyurina YY, Conrad M, Bayir H. Oxidized arachidonic and adrenic PEs navigate cells to ferroptosis. Nat Chem Biol. 2017;13:81–90. doi: 10.1038/nchembio.2238. [DOI] [PMC free article] [PubMed] [Google Scholar]
- 55.Powell WS, Rokach J. Biochemistry, biology and chemistry of the 5-lipoxygenase product 5-oxo-ETE. Prog Lipid Res. 2005;44:154–183. doi: 10.1016/j.plipres.2005.04.002. [DOI] [PubMed] [Google Scholar]
- 56.Yang WS, SriRamaratnam R, Welsch ME, Shimada K, Skouta R, Viswanathan VS, Cheah JH, Clemons PA, Shamji AF, Clish CB, Brown LM, Girotti AW, Cornish VW, Schreiber SL, Stockwell BR. Regulation of ferroptotic cancer cell death by GPX4. Cell. 2014;156:317–331. doi: 10.1016/j.cell.2013.12.010. [DOI] [PMC free article] [PubMed] [Google Scholar]
- 57.Wang YQ, Chang SY, Wu Q, Gou YJ, Jia L, Cui YM, Yu P, Shi ZH, Wu WS, Gao G, Chang YZ. The Protective Role of Mitochondrial Ferritin on Erastin-Induced Ferroptosis. Front Aging Neurosci. 2016;8:308. doi: 10.3389/fnagi.2016.00308. [DOI] [PMC free article] [PubMed] [Google Scholar]
- 58.Ha JS, Lee CS, Maeng JS, Kwon KS, Park SS. Chronic glutamate toxicity in mouse cortical neuron culture. Brain Res. 2009;1273:138–143. doi: 10.1016/j.brainres.2009.03.050. [DOI] [PubMed] [Google Scholar]
- 59.Del Rio P, Massieu L. Mild mitochondrial inhibition in vivo enhances glutamate-induced neuronal damage through calpain but not caspase activation: role of ionotropic glutamate receptors. Exp Neurol. 2008;212:179–188. doi: 10.1016/j.expneurol.2008.03.023. [DOI] [PubMed] [Google Scholar]
- 60.Carlson BA, Tobe R, Yefremova E, Tsuji PA, Hoffmann VJ, Schweizer U, Gladyshev VN, Hatfield DL, Conrad M. Glutathione peroxidase 4 and vitamin E cooperatively prevent hepatocellular degeneration. Redox Biol. 2016;9:22–31. doi: 10.1016/j.redox.2016.05.003. [DOI] [PMC free article] [PubMed] [Google Scholar]
- 61.Chen L, Hambright WS, Na R, Ran Q. Ablation of the Ferroptosis Inhibitor Glutathione Peroxidase 4 in Neurons Results in Rapid Motor Neuron Degeneration and Paralysis. J Biol Chem. 2015;290:28097–28106. doi: 10.1074/jbc.M115.680090. [DOI] [PMC free article] [PubMed] [Google Scholar]
- 62.Hambright WS, Fonseca RS, Chen L, Na R, Ran Q. Ablation of ferroptosis regulator glutathione peroxidase 4 in forebrain neurons promotes cognitive impairment and neurodegeneration. Redox Biol. 2017;12:8–17. doi: 10.1016/j.redox.2017.01.021. [DOI] [PMC free article] [PubMed] [Google Scholar]
- 63.Anderson GJ, Neuringer M, Lin DS, Connor WE. Can prenatal N-3 fatty acid deficiency be completely reversed after birth? Effects on retinal and brain biochemistry and visual function in rhesus monkeys. Pediatr Res. 2005;58:865–872. doi: 10.1203/01.pdr.0000182188.31596.5a. [DOI] [PubMed] [Google Scholar]
- 64.Lamoureux JA, Meck WH, Williams CL. Prenatal choline availability alters the context sensitivity of Pavlovian conditioning in adult rats. Learn Mem. 2008;15:866–875. doi: 10.1101/lm.1058708. [DOI] [PMC free article] [PubMed] [Google Scholar]
- 65.Balogun OO, da Silva Lopes K, Ota E, Takemoto Y, Rumbold A, Takegata M, Mori R. Vitamin supplementation for preventing miscarriage. Cochrane Database Syst Rev. 2016;5:CD004073. doi: 10.1002/14651858.CD004073.pub4. [DOI] [PMC free article] [PubMed] [Google Scholar]
- 66.Wright RS, Gerassimakis C, Bygrave D, Waldstein SR. Dietary Factors and Cognitive Function in Poor Urban Settings. Curr Nutr Rep. 2017;6:32–40. doi: 10.1007/s13668-017-0186-x. [DOI] [PMC free article] [PubMed] [Google Scholar]
- 67.Chen K, Zhang X, Wei XP, Qu P, Liu YX, Li TY. Antioxidant vitamin status during pregnancy in relation to cognitive development in the first two years of life. Early Hum Dev. 2009;85:421–427. doi: 10.1016/j.earlhumdev.2009.02.001. [DOI] [PubMed] [Google Scholar]
- 68.Zhou Y, Bizzaro JW, Marx KA. Homopolymer tract length dependent enrichments in functional regions of 27 eukaryotes and their novel dependence on the organism DNA (G+C)% composition. BMC Genomics. 2004;5:95. doi: 10.1186/1471-2164-5-95. [DOI] [PMC free article] [PubMed] [Google Scholar]
Associated Data
This section collects any data citations, data availability statements, or supplementary materials included in this article.


