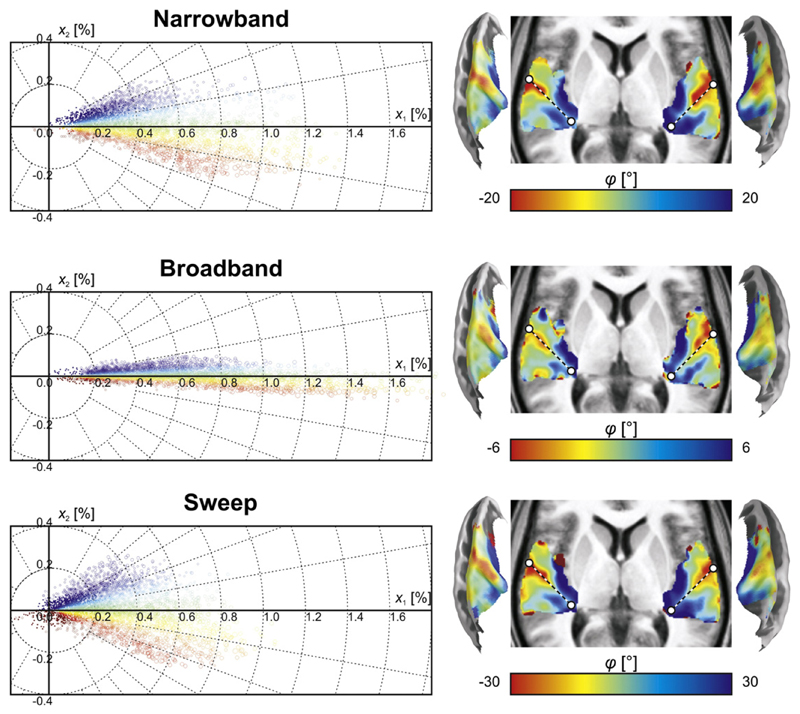
Fig. 6.
The magnitudes of the 1st and 2nd components (x1 and x2) are plotted against each other for the data based on narrowband, broadband, and sweep sequences; each point corresponds to one voxel. The scatter in the horizontal direction reflects differences in activation level, whilst that in the vertical direction reflects differences in frequency tuning. The angles in the polar scatter plots were colour-coded to result in a better correlate of frequency tuning. The resulting tonotopic maps were similar across all three types of stimuli and primarily differed at the edges of the activation cluster where signal to noise was poorest. The dashed line approximately outlines the axis of Heschl's gyrus, which forms the border between putative core fields hA1 and hR.

