

Abstract
Background
Acquired aplastic anemia results from immune-mediated destruction of bone marrow. Immunosuppressive therapies are effective, but reduced numbers of residual stem cells may limit their efficacy. In patients with aplastic anemia that was refractory to immunosuppression, eltrombopag, a synthetic thrombopoietin-receptor agonist, led to clinically significant increases in blood counts in almost half the patients. We combined standard immunosuppressive therapy with eltrombopag in previously untreated patients with severe aplastic anemia.
Methods
We enrolled 92 consecutive patients in a prospective phase 1–2 study of immunosuppressive therapy plus eltrombopag. The three consecutively enrolled cohorts differed with regard to the timing of initiation and the duration of the eltrombopag regimen (cohort 1 received eltrombopag from day 14 to 6 months, cohort 2 from day 14 to 3 months, and cohort 3 from day 1 to 6 months). The cohorts were analyzed separately. The primary outcome was complete hematologic response at 6 months. Secondary end points included overall response, survival, relapse, and clonal evolution to myeloid cancer.
Results
The rate of complete response at 6 months was 33% in cohort 1, 26% in cohort 2, and 58% in cohort 3. The overall response rates at 6 months were 80%, 87%, and 94%, respectively. The complete and overall response rates in the combined cohorts were higher than in our historical cohort, in which the rate of complete response was 10% and the overall response rate was 66%. At a median follow-up of 2 years, the survival rate was 97%; one patient died during the study from a nonhematologic cause. Marked increases in bone marrow cellularity, CD34+ cell number, and frequency of early hematopoietic progenitors were noted. Rates of relapse and clonal evolution were similar to our historical experience. Severe rashes occurred in two patients, resulting in the early discontinuation of eltrombopag.
Conclusions
The addition of eltrombopag to immunosuppressive therapy was associated with markedly higher rates of hematologic response among patients with severe aplastic anemia than in a historical cohort. (Funded by the National Heart, Lung, and Blood Institute; ClinicalTrials.gov number, NCT01623167.)
In patients with aplastic anemia, the “empty” bone marrow does not produce blood cells, and when pancytopenia is severe and untreated, almost all patients die within 1 year after diagnosis.1 Acquired aplastic anemia has immune pathophysiological features, as inferred from numerous laboratory studies and animal models.2 Patients are cured by the replacement of both the hematopoietic and immune systems in a stem-cell transplant, but immunosuppressive therapy alone is also effective. Approximately two thirds of patients have increased blood-cell production after a single course of horse antithymocyte globulin and cyclosporine.3-5 Hemato-logic response is strongly correlated with long-term survival.6
Many efforts to improve on the standard treatment with horse antithymocyte globulin and cyclosporine have failed. Rabbit antithymocyte globulin, a more potent lymphocytotoxic agent than horse antithymocyte globulin, was less effective than horse antithymocyte globulin in a randomized trial.5 Cyclophosphamide had unacceptable toxic effects.7 Empirical efforts to increase the rate of response8,9 and rational attempts to modulate the immune response further10,11 have not been successful in research trials.
A likely limit to the efficacy of immunosuppression is the stem-cell deficit. Early progenitor and hematopoietic stem cells are greatly reduced in all patients with severe aplastic anemia.12 Blood counts are the major predictors of outcome in patients with aplastic anemia and are assumed to reflect stem-cell reserve. Residual levels of reticulocytes and lymphocytes have correlated with both response to antithymocyte globulin and survival.13 The rates of hematologic response to immunosuppressive therapies are higher among children than adults14 and are worse among older adults,1515 correlating with the stem-cell loss that occurs with aging.
We previously found that eltrombopag, an oral thrombopoietin-receptor agonist, was effective in patients with aplastic anemia that was refractory to immunosuppression.16,17 Approximately 45% of the patients had a hematologic response to single-agent eltrombopag; not only did they have higher platelet counts, but they also had marked increases in hemoglobin levels and higher neutrophil numbers. We hypothesized that the addition of eltrombopag to standard immunosuppression as the first treatment for severe aplastic anemia would increase the rate of complete response and improve long-term outcomes.
Methods
Study Design and Implementation
This investigator-initiated, nonrandomized, historically controlled, phase 1–2 study was approved by the institutional review board at the National Heart, Lung, and Blood Institute (NHLBI). The protocol is available with the full text of this article at NEJM.or. The Intramural Research Program of the NHLBI, National Institutes of Health, funded this research. GlaxoSmithKline and Novartis, the manufacturers of eltrombopag, provided the drug and research support to the U.S. government under a Cooperative Research and Development Agreement. A data and safety monitoring board monitored the study. The authors wrote the manuscript without assistance, gathered and analyzed the data, vouch for the completeness and accuracy of the data and analysis, and vouch for the adherence of the study to the protocol. All the patients or their legal guardians provided written informed consent.
Antithymocyte globulin and cyclosporine were administered as standard immunosuppression. Three eltrombopag dosing schemes were implemented in consecutively enrolling cohorts (Fig. 1). Participants underwent evaluations that included serial bone marrow biopsies, blood counts, and health-outcome questionnaires (see the protocol). Evaluations were performed at the Hatfield Clinical Research Center, Bethesda, Maryland. Pharmacokinetic assessments were performed in a subgroup of patients (see the Supplementary Appendix, available at NEJM.org).
Figure 1. Study Design and Treatment Plan According to Cohort.

All the patients received antithymocyte globulin (ATG) and cyclosporine. Three eltrombopag dosing schemes were implemented in consecutively enrolling cohorts. Results from each cohort informed the design of the subsequent cohort. In cohort 1, eltrombopag was initiated after ATG, owing to concern about overlapping hepatotoxic effects, especially when it is coadministered with ATG and cyclosporine. Since most responses in cohort 1 appeared within 3 months and in order to limit eltrombopag exposure, eltrombopag was discontinued at 3 months in cohort 2. Because the hepatotoxic effects in cohort 2 were found to be infrequent and the rate of complete response was lower than in cohort 1, in cohort 3 eltrombopag was initiated on day 1 with ATG and continued for 6 months. Details regarding the daily dosing scheme are provided in the Supplementary Appendix. The primary end point was the rate of complete hematologic response at 6 months. The rate of partial response and the overall response rate (which included patients with a partial or complete response) were secondary end points.
Patients
Patients 2 years of age or older who had previously untreated severe aplastic anemia1 were eligible. Participants with Fanconi's anemia, severe liver impairment, or evidence of a clonal myeloid disorder on cytogenetic testing performed within 12 weeks before study entry were excluded (see the Supplementary Appendix). From June 2012 through November 2015, all the consecutive patients who were eligible were offered enrollment (Fig. S1 in the Supplementary Appendix).
Treatment Regimen
Horse antithymocyte globulin (ATGAM, Pfizer) and cyclosporine were administered as described previously (see the Supplementary Appendix).5 Eltrombopag (Promacta, Novartis) was administered at a dose of 150 mg daily in patients who were 12 years of age or older, at a dose of 75 mg daily in patients who were 6 to 11 years of age, and at a dose of 2.5 mg per kilogram of body weight per day in patients who were 2 to 5 years of age. East or Southeast Asian participants were administered 50% of the eltrombopag dose because of higher eltrombopag exposure due to differences in pharmacokinetics observed in this ethnic group. Dose reductions were implemented as described in the Supplementary Appendix. The duration of treatment with eltrombopag varied according to cohort (Fig. 1).
CD34+ Cell Enumeration and Assay of Hematopoietic Progenitors
Enumeration of CD34+ cell numbers was performed on serial bone marrow aspirates by means of flow cytometry in all patients (see the Supplementary Appendix). In addition, hematopoieticstem cells CD34+CD38-CD45RA-CD90+CD49f+ phenotype with low rhodamine uptake) and multipotent progenitors (CD34+CD38-CD45RA-CD90-CD49f- phenotype) were measured in 13 patients by means of flow cytometry as previously described (see the Supplementary Appendix).18
End Points
The primary efficacy end point was complete response at 6 months. The primary safety end point was the safety profile in the 6 months after the initiation of treatment. Secondary end points included partial and overall hematologic responses at 3 months, at 6 months, and at each year of follow-up; survival; self-reported health outcomes; relapse; paroxysmal nocturnal hemoglobinuria (PNH); and clonal evolution, which was defined as a new clonal cytogenetic abnormality or characteristic changes in bone marrow consistent with the myelodysplastic syndrome or acute myeloid leukemia.
Hematologic response was defined according to our previously published studies4,6and categorized as follows: a complete response was defined as an absolute neutrophil count of at least 1000 per cubic millimeter, a hemoglobin level of at least 10 g per deciliter, and a platelet count of at least 100,000 per cubic millimeter (all three criteria had to be met); nonresponse was defined as blood counts that continued to meet the Camitta criteria1 for severe aplastic anemia; and partial response was defined as blood counts that no longer met the criteria for severe aplastic anemia but also did not meet the criteria for complete response. The overall response rate corresponded to the proportion of patients who had a partial or complete response.
Statistical Analysis
The sample size for each cohort was calculated on the basis of Simon's two-stage “minimax” design19 to test the null hypothesis that the 6-month complete response rate (primary end point) was 10% or lower versus the alternative that the 6-month complete response rate was 30% or higher, at the 0.05 significance level and 80% power. The 10% rate was estimated on the basis of three decades of historical complete response rates associated with horse antithymocyte globulin plus cyclosporine at our institution. The primary end point was analyzed according to the intention-to-treat principle; patients who withdrew before 6 months were considered to not have had a response. To compensate for early withdrawals and to allow for a sufficient number of patients to be evaluated for secondary end points, while maintaining statistical power for the primary end point, we adopted the following upper limits of the cohort sample sizes: 31 participants in cohort 1, 33 in cohort 2, and 31 in cohort 3. Results in each cohort were analyzed separately for the primary end point. Secondary and exploratory end points in each cohort and in all the cohorts combined were compared with a historical cohort of 102 patients who had received horse antithymocyte globulin plus cyclosporine while they were participating in randomized control groups of one of our two most recent clinical trials (see the Supplementary Appendix).5,11
Results
Patients
The demographic and clinical characteristics of the patients were similar across cohorts and were similar also to those of the historical cohort (Table 1, and Table S1 in the Supplementary Appendix). The median follow-up was 703 days (23 months; range, 84 to 1422 days) in all patients and 713 days (24 months; range, 194 to 1422 days) in surviving patients (Fig. S4 in the Supplementary Appendix).
Table 1. Characteristics of the Patients at Baseline*.
| Characteristic | Cohort 1 (N = 30) | Cohort 2 (N = 31) | Cohort 3 (N = 31) | All Patients (N = 92) |
|---|---|---|---|---|
| Age — yr | ||||
| Median | 39 | 28 | 29 | 32 |
| Range | 12–72 | 3–68 | 11–82 | 3–82 |
| Age distribution — no. (%) | ||||
| <18 yr | 5 (17) | 6 (19) | 8 (26) | 19 (21) |
| 18–64 yr | 20 (67) | 23 (74) | 18 (58) | 61 (66) |
| ≥65 yr | 5 (17) | 2 (6) | 5 (16) | 12 (13) |
| Sex — no. (%) | ||||
| Male | 16 (53) | 17 (55) | 17 (55) | 50 (54) |
| Female | 14 (47) | 14 (45) | 14 (45) | 42 (46) |
| GPI-deficient neutrophils† | ||||
| Range — % | <1–99 | <1–99 | <1–79 | <1–99 |
| Distribution — no./total no. (%) | ||||
| <1% | 20/28 (71) | 18/30 (60) | 15/26 (58) | 53/84 (63) |
| ≥1% | 8/28 (29) | 12/30 (40) | 11/26 (42) | 31/84 (37) |
| Neutrophil count — per cubic millimeter | ||||
| Median | 275 | 330 | 300 | 310 |
| Range | 0–1380 | 0–900 | 0–1810 | 0–1810 |
| Reticulocyte count — per cubic millimeter | ||||
| Median | 22,550 | 14,600 | 24,300 | 19,950 |
| Range | 2400–51,600 | 1600–52,900 | 2000–60,400 | 1600–60,400 |
| Platelet count — per cubic millimeter | ||||
| Median | 9500 | 8000 | 8000 | 9000 |
| Range | 2000–37,000 | 1000–14,000 | 0–27,000 | 0–37,000 |
| Thrombopoietin — pg/ml | ||||
| Median | 3133 | 3255 | 3111 | 3163 |
| Range | 1945–4443 | 1806–4955 | 2003–4793 | 1806–4955 |
The baseline characteristics of the enrolled patients are shown according to cohort and in the total population of patients. All patients received horse antithymocyte globulin on days 1 to 4 and cyclosporine from day 1 to 6 months. All the patients received eltrombopag at an age-dependent dose, with cohort 1 receiving eltrombopag from day 14 to 6 months, cohort 2 from day 14 to 3 months, and cohort 3 from day 1 to 6 months. Patient 11 in cohort 1 was excluded from the analysis owing to ineligibility (Fig. S1A in the Supplementary Appendix). Patient 17 in cohort 1 had fluctuating blood counts at the 6-month time point owing to a viral infection and was categorized as having a complete response.
Glycosylphosphatidylinositol (GPI)–deficient neutrophils could not be measured in eight patients owing to severe neutropenia.
Hematologic Response
The primary efficacy end point of the rate of complete hematologic response at 6 months exceeded the historical rate of 10% in all the cohorts combined (Table 2). Complete response was most frequent in cohort 3 (occurring in 58% of the patients), in which eltrombopag was administered from day 1 and then continued for 6 months. The rate of complete response was lowest in cohort 2 (occurring in 26% of the patients), in which the exposure to eltrombopag was shortest. Response rates also were higher across all cohorts as compared with the rate in our historical cohort (66%), and almost all the patients in cohort 3 (94%) had a hematologic response (Table 2).5,11
Table 2. Hematologic Response in Patients Treated with Immunosuppression and Eltrombopag*.
| Cohort and Response | Rate at 3 Mo | Rate at 6 Mo | P Value |
|---|---|---|---|
| Cohort 1 | |||
| No. of patients | 30 | 30 | |
| Response — no. (% [95% CI]) | |||
| Overall response | 23 (77 [61–93]) | 24 (80 [65–95]) | |
| Partial response | 18 (60 [41–79]) | 14 (47 [28–66]) | |
| Complete response | 5 (17 [3–31]) | 10 (33 [15–31]) | 0.01 |
| Cohort 2 | |||
| No. of patients | 31 | 31 | |
| Response — no. (% [95% CI]) | |||
| Overall response | 24 (77 [62–93]) | 27 (87 [75–100]) | |
| Partial response | 16 (52 [33–70]) | 19 (61 [43–79]) | |
| Complete response | 8 (26 [9–42]) | 8 (26 [9–42]) | 0.06 |
| Cohort 3 | |||
| No. of patients | 31 | 31 | |
| Response — no. (% [95% CI]) | |||
| Overall response | 27 (87 [75–100]) | 29 (94 [84–103]) | |
| Partial response | 12 (39 [21–57]) | 11 (35 [18–53]) | |
| Complete response | 15 (48 [30–67]) | 18 (58 [40–76]) | <0.001 |
| All cohorts | |||
| No. of patients | 92 | 92 | |
| Response — no. (% [95% CI]) | |||
| Overall response | 74 (80 [72–89]) | 80 (87 [80–94]) | <0.001† |
| Partial response | 46 (50 [40–60]) | 44 (48 [37–58]) | |
| Complete response | 28 (30 [21–40]) | 36 (39 [29–49]) | <0.001 |
Complete response was defined as an absolute neutrophil count of at least 1000 per cubic millimeter, a hemoglobin level of at least 10 g per deciliter, and a platelet count of at least 100,000 per cubic millimeter. Partial response was defined as blood counts no longer meeting the criteria for severe aplastic anemia but not meeting the criteria for complete response. The results for overall response correspond to the proportions of patients with a partial or complete response. Three patients in cohort 1 withdrew from the study before 6 months, as did two patients in cohort 2 and one in cohort 3 (Fig. S1A, S1B, and S1C in the Supplementary Appendix). The P value is for testing the null hypothesis that the rate of complete response at 6 months would be 30% or greater. The 95% confidence intervals were computed on the basis of normal approximation.
The overall response rate in all cohorts was an exploratory end point. The P value is for testing the comparison of the overall response rate to the overall response rate in a historical cohort (67 of 102 patients [66%]).
The absolute neutrophil counts and platelet counts in all the cohorts were higher at 3 months and 6 months than they were in patients in the historical cohort who had a response (Fig. S2 in the Supplementary Appendix). In 26 patients with very severe neutropenia (absolute neutrophil count, <200 per cubic millimeter) who had a response (across all cohorts), the median time to an absolute neutrophil count of more than 500 per cubic millimeter was 48 days (interquartile range, 35 to 54). Among patients who had a response, the median time to transfusion independence was 32 days (interquartile range, 12 to 38) for platelets and 39 days (interquartile range, 10 to 73) for red cells. Eltrombopag was discontinued in 17 patients because the platelet count increased to greater than 200,000 per cubic millimeter.
Comparison of Cohorts and Predictors of Response
The response rates among the cohorts were compared and were highest in cohort 3, which had the earliest initiation of eltrombopag and the longest duration of treatment (Table 2). On multivariate logistic regression, none of the previously reported baseline hematologic characteristics that are predictive of response to immunosuppression13 were associated with complete response or overall response in the current study. A longer telomere length of leukocytes at baseline was significantly correlated with response, as was younger age (Table S2 in the Supplementary Appendix).
Adverse Events
Eltrombopag was briefly discontinued during the first 2 weeks in 7 patients who had transient elevations in liver-enzyme levels. Two severe adverse events, cutaneous eruptions of grade 2 (in Patient 86) and grade 3 (in Patient 54), were attributed by the investigators to eltrombopag and resulted in the discontinuation of the drug (at 4 weeks in Patient 86 and at 6 weeks in Patient 54) (Table 3, and Fig. S3 in the Supplementary Appendix). Adverse events that were not attributed to eltrombopag by the investigators were neutropenic infections and known toxic effects from antithymocyte globulin and cyclosporine (Table S3 in the Supplementary Appendix). One patient died 3 months after treatment from a nonhematologic disorder, specifically paraneoplastic encephalopathy that was attributed to thymoma that predated study entry.
Table 3. Adverse Events of Grade 3 or Higher or Serious Adverse Events Attributed to Eltrombopag*.
| Event | Patients (N = 92) |
|---|---|
| no. (%) | |
| Skin | |
|
| |
| Maculopapular rash† | 2 (2) |
|
| |
| Pruritus | 1 (1) |
|
| |
| Abdominal pain | 2 (2) |
|
| |
| Liver test abnormality | 17 (18) |
|
| |
| Increased alanine aminotransferase level | 9 (10) |
|
| |
| Increased aspartate aminotransferase level | 3 (3) |
|
| |
| Blood bilirubin increased | 12 (13) |
All the adverse events of grade 3 or higher that were attributed by the investigators to eltrombopag are shown. The data-cutoff date was May 25, 2016. Events were graded according to the National Cancer Institute Common Terminology Criteria for Adverse Events, version 4. Patient 87 required a temporary dose reduction of cyclosporine and eltrombopag owing to conjugated bilirubinemia associated with pruritus. Eltrombopag was discontinued temporarily as mandated by the protocol in seven patients owing to a transient elevation in the liver-enzyme levels during the administration of antithymocyte globulin or during serum sickness that occurred during the first 2 weeks.
Severe adverse events were observed in Patient 54 (in cohort 2) and Patient 86 (in cohort 3), who had maculopapular rashes of grade 3 and 2, respectively, that were associated with fever and oral pain and that resulted in hospitalization, discontinuation of eltrombopag, and treatment with glucocorticoids.
Self-Reported Health Outcomes
A total of 69 adult patients who spoke English or Spanish completed surveys and reported clinically relevant impairments in their physical health at baseline, with improvement in their physical health and overall health-related quality of life by 6 months. Patients with a response at 6 months reported significantly higher levels of physical health and overall health-related quality of life than did patients who had not had a response (see the Supplementary Appendix).
Pharmacokinetics
Pharmacokinetic measurements in 21 patients showed a higher-than-predicted geometric mean area-under-the-curve value of 668 μg per milliliter (coefficient of variation, 50.6%) and a maximum concentration of 33.8 μg per milliliter (coefficient of variation, 43.2%) for the 150-mg daily regimen of eltrombopag (see the Supplementary Appendix). There was no correlation of the area under the curve with response, but a trend toward a higher area under the curve was observed in older participants and women.
Long-Term Outcomes
The overall survival rate at 2 years was 97% (95% confidence interval [CI], 94 to 100) in all the cohorts and 99% (95% CI, 97 to 100) when data were censored because of transplantation (Fig. S4A and S4B in the Supplementary Appendix). Transplantation was indicated in 12 patients; 6 patients had not had a response or remained dependent on blood-cell transfusions, 3 had a relapse, and 3 had clonal evolution. A total of 3 patients died: 1 patient died during the study, and 2 died after allogeneic transplantation from a matched sibling (Patient 9) or an unrelated donor (Patient 15). A total of 10 patients underwent transplantation successfully and were alive at last follow-up; 5 patients received a transplant from a matched sibling donor, 2 from a matched unrelated donor, 1 from a haploidentical family donor, and 2 from an unrelated cord-blood donor in combination with a transplant from a haploidentical family donor.
Relapse, defined as declining blood counts that warranted the reintroduction of full-dose cyclosporine, occurred in 25 of 78 patients with a response (32%) after 6 months. The protocol was amended to allow the continuation of lowdose cyclosporine from 6 months to 2 years after the administration of antithymocyte globulin (Fig. S4C in the Supplementary Appendix). This change was effective in reducing the frequency of relapse: 6 of 43 patients with a response (14%) in whom the drug was continued at a low dose beyond 6 months had a relapse, as compared with 19 of 35 patients with a response (54%) in whom cyclosporine was stopped at 6 months. The reinstitution of full-dose cyclosporine was effective in reversing relapse and increasing blood counts in 13 of 25 patients. The addition of eltrombopag in combination with cyclosporine reversed relapse in an additional 10 patients.
Clonal cytogenetic evolution occurred in seven patients at 2 years. The incidence was 8% (standard error, ±3%) according to a competing-risk analysis (Fig. S4D and Table S4 in the Supplementary Appendix). Five patients had the loss of chromosome 7, which was associated with dys-plastic bone marrow changes in three patients. One patient with a complex karyotype (t(3;3) (q21;q26), –7) had progression to acute myeloid leukemia (Table S4 in the Supplementary Appendix). Clonal evolution occurred 3 to 6 months after treatment in five patients and at 30 months in two patients. The frequency of clonal evolution was similar to our historical experience with standard immunosuppressive therapy (at 2 years, 8% [standard error, ±3%] of the patients in our historical cohort had clonal evolution) (Fig. S4D in the Supplementary Appendix).20 Hemolytic PNH developed in two patients during long-term follow up; these patients received eculizumab therapy. Two patients who were receiving eculizumab before the development of severe aplastic anemia continued to take eculizumab during the study for persistent, large PNH clones. In nine patients, the preexisting PNH clones became undetectable after treatment with the three-drug regimen.
Hematopoiesis
Serial samples from bone marrow biopsies showed improved cellularity in 79 of 92 patients (86%) at either 3 or 6 months (Fig. 2A). There was no increase in the incidence of fibrosis. The median number of bone marrow CD34+ cells at baseline had increased by a factor of 3 at 3 months (Fig. 2B, and Fig. S5 in the Supplementary Appendix). Bone marrow populations that were highly enriched in hematopoietic stem cells and multipotent progenitors were measured by means of flow cytometry in 13 patients. Although they were undetectable at baseline, these cells constituted 2 to 48 hematopoietic stem cells and 1 to 27 multipotent progenitors per 100,000 CD34+ cells at 3 or 6 months after therapy, which is similar to the frequencies detected in healthy persons (Fig. 2C, and Fig. S5 in the Supplementary Appendix).21
Figure 2. (facing page). CD34+ Cell Enumeration and Assay of Hematopoietic Progenitors.
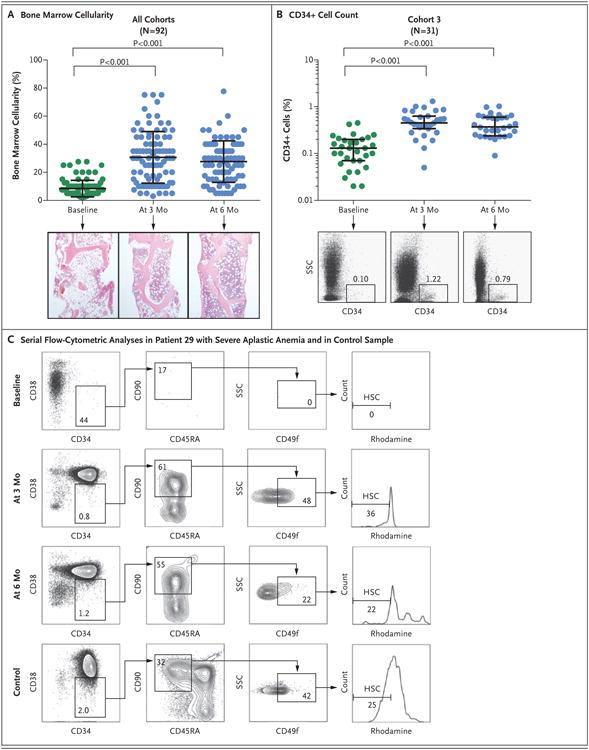
Panel A shows serial measurements of bone marrow cellularity in all 92 patients at baseline (green) and at 3 months and 6 months after the initiation of treatment (blue). Representative samples from bone marrow core biopsies (hematoxylin and eosin) obtained from Patient 7 at these three time points are shown. Each circle indicates one patient. The long horizontal bar indicates the mean, and the I bar the standard deviation. Panel B shows the serial quantification of CD34+ cells of the patients in cohort 3 at baseline (green) and at 3 months and 6 months after the initiation of treatment (blue). The long horizontal bar indicates the median, and the I bar the interquartile range. Representative flow-cytometric analyses at these three time points are shown for Patient 67; the numbers in the boxes represent the percentages of cells within the indicated fraction. SSC denotes side scatter. At 3 months, the median fraction of CD34+ cells in this cohort had increased from the baseline value by a factor of 3 (baseline value, 0.13%; value at 3 months, 0.45%; and value at 6 months, 0.37%). Similarly, the numbers of CD34+ cells in bone marrow increased during treatment in cohorts 1 and 2 (Fig. S5 in the Supplementary Appendix). Panel C shows representative serial flow-cytometric analyses of phenotypically defined hematopoietic stem cells (HSCs; CD34+CD38–CD45RA–CD90+CD49f+ phenotype with low rhodamine uptake) in the bone marrow of Patient 29 and in a sample obtained from a healthy person (control).21 Nucleated bone marrow cells were initially enriched for CD34+ cells by Magnetic Automated Cell Separation (MACS) and analyzed by means of flow cytometry for markers expressed on HSCs. Owing to the paucity of CD34+ cells at baseline, most of the cells that were measured had a CD34– phenotype. Representative flow-cytometric analyses of multipotent progenitors are shown in Figure S5 in the Supplementary Appendix. The P values were calculated by one-way analysis of variance.
Discussion
We added eltrombopag, a thrombopoietin-receptor agonist, to standard immunosuppressive therapy in patients with previously untreated severe aplastic anemia. In this prospective phase 1–2 study, the primary end point was complete hematologic response, defined as normal or near-normal blood counts, at 6 months. Patients who have a robust hematologic response have fewer complications, particularly with regard to relapse and clonal evolution to myeloid cancers, than do those without a robust response.20 Partial responses to antithymocyte globulin and cyclosporine are the usual outcome of therapy, with only 10 to 20% of patients having a complete response. However, in the current study, more than one third of the patients had a complete response by 6 months. The overall response rate, a secondary end point in our study, included patients who had a complete or partial response, the majority of whom reached transfusion independence and had neutrophil counts that were adequate for the avoidance of infection.6
The response rate was also higher than expected with standard immunosuppression: the rate was 87% in the current study, as compared with 66% in our historical cohort. The overall response rate (94%) and complete response rate (58%) were notably higher in cohort 3, in which patients had the longest exposure to eltrombopag. The great majority of partial and complete responses were present at 3 months, a secondary end-point time. The average time to transfusion independence was approximately 1 month, and clinically meaningful increments in the neutrophil level occurred within a few weeks after therapy began, even in patients with very severe neutropenia. Overall increases in blood levels of platelets and neutrophils were higher in patients in this study than in our historical cohort. The addition of eltrombopag to the current standard immunosuppression regimen therefore appeared to substantially increase the frequency, speed, and robustness of hematologic recovery in patients with severe aplastic anemia. The survival rate was greater than 95% at a median follow-up of 2 years.
Two severe cutaneous eruptions led to the premature discontinuation of eltrombopag early in the regimen. Liver-test abnormalities, although frequent, did not limit the administration of eltrombopag and were often transient. Health-related quality-of-life surveys showed an improvement in physical health and overall health-related quality of life after treatment that correlated with hematologic response.
Clonal evolution, the development of the myelo-dysplastic syndrome and acute myeloid leukemia from aplastic anemia, was a concern in our study of eltrombopag in patients with heavily pre-treated and refractory aplastic anemia.17 In the current study, we observed chromosomal changes in seven patients that were within the range that would be expected with immunosuppression alone at 2 years after the initiation of treat-ment.6,20,22 In two patients, chromosomal aberrations were either of unclear significance (trisomies 6 and 15 in 2 of 21 cells in Patient 7, who had very short telomeres on initial testing) or transient (deletion of the q arm of chromosome 13 in Patient 14). In five patients, however, the loss of chromosome 7, either alone or in combination with complex cytogenetic abnormalities, was noted at follow-up bone marrow assessment; in three patients, this was accompanied by morphologic evidence of dysplasia or full myeloid malignant transformation. Three of the five patients who had a loss of chromosome 7 did not have somatic mutations that were detectable in candidate genes that are recurrently mutated in the myelodysplastic syndrome and acute myeloid leukemia; in the other two patients, small clones that had mutated in ASXL1 or DNMT3A were present but of uncertain significance — findings that were consistent with our earlier report regarding the loss of chromosome 7 after aplastic anemia.23 Two patients with clonal evolution had germline mutations in RTEL1, a gene encoding a helicase that is involved in telomere maintenance.24,25
The mechanism by which eltrombopag acts in the context of bone marrow failure is unclear. It is likely that eltrombopag acts directly to stimulate the proliferation of small numbers of residual stem-progenitor cells in patients with aplastic anemia. Telomere length at baseline and the age of the patient were predictive; both were reflective of the stem-cell pool. The interruption of the thrombopoietin-Mpl–receptor axis in animals and in humans culminates in general bone marrow failure.26,27 Nevertheless, thrombopoietin blood levels, similar to concentrations of other hematopoietic growth factors (erythropoietin and granulocyte colony-stimulating factor) in circulating blood, are markedly elevated in patients with aplastic anemia.28,29 As a small molecule, eltrombopag may avoid plasma protein binding and kinetics, factors that could result in extremely high local concentrations in the stem-cell niche. Eltrombopag also may circumvent the inhibition of signal transduction from growth factor receptors that is induced by proinflammatory cytokines such as interferon-gamma (data not shown),30 which has been implicated in the pathophysiology of immune-mediated bone marrow failure.
A large, randomized, placebo-controlled trial (RACE; ClinicalTrials.gov number, NCT02099747) is under way in Europe to confirm our results. Longer follow-up data from the current trial and the RACE trial will allow for more precise determination of late risks of relapse and myeloid cancer. The median time to clonal evolution with immunosuppressive therapy is 4 to 6 years, which is longer than the median follow-up of 2 years in the current study. Given reproducibility and no unexpected late complications, eltrombopag in combination with immunosuppression may help patients optimize the timing of allogeneic stem-cell transplantation or avoid it. Of particular interest would be use of eltrombopag in combination with less toxic immunosuppressive regimens that omit antithymocyte globulin, particularly in older patients, in patients with coexisting conditions, and in developing countries where aplastic anemia is prevalent and conventional therapies extremely costly. Eltrombopag has shown some efficacy beyond aplastic anemia, including myelodysplastic syndromes,31 unilineage cytopenias, or moderate aplastic anemia (data not shown).
Supplementary Material
Acknowledgments
Supported by the Division of Intramural Research, National Heart, Lung, and Blood Institute.
We thank Li Yang, Stephen Klagholz, Stephanie Sellers, Key-van Keyvanfar, Nicky Soltani, Charles Bolan, Sophia Grasmeder, Tatyana Sarkisova, Doris Burak, Nicole Stone, Connie Erickson-Miller, Jianping Zhang, and the members of the eltrombopag team at GlaxoSmithKline and Novartis, Mejar Albitar at Neoge-nomics, and Janis L. Abkowitz, Donna S. Neuberg, and the staff of the American Society of Hematology Clinical Research Training Institute.
Footnotes
Disclosure forms provided by the authors are available with the full text of this article at NEJM.org.
References
- 1.Camitta BM. Criteria for severe aplastic anaemia. Lancet. 1988;1:303–4. doi: 10.1016/s0140-6736(88)90388-1. [DOI] [PubMed] [Google Scholar]
- 2.Young NS, Calado RT, Scheinberg P. Current concepts in the pathophysiology and treatment of aplastic anemia. Blood. 2006;108:2509–19. doi: 10.1182/blood-2006-03-010777. [DOI] [PMC free article] [PubMed] [Google Scholar]
- 3.Frickhofen N, Kaltwasser JP, Schrezenmeier H, et al. Treatment of aplastic anemia with antilymphocyte globulin and methylprednisolone with or without cyclosporine. N Engl J Med. 1991;324:1297–304. doi: 10.1056/NEJM199105093241901. [DOI] [PubMed] [Google Scholar]
- 4.Rosenfeld SJ, Kimball J, Vining D, Young NS. Intensive immunosuppression with antithymocyte globulin and cyclosporine as treatment for severe acquired aplastic anemia. Blood. 1995;85:3058–65. [PubMed] [Google Scholar]
- 5.Scheinberg P, Nunez O, Weinstein B, et al. Horse versus rabbit antithymocyte globulin in acquired aplastic anemia. N Engl J Med. 2011;365:430–8. doi: 10.1056/NEJMoa1103975. [DOI] [PMC free article] [PubMed] [Google Scholar]
- 6.Rosenfeld S, Follmann D, Nunez O, Young NS. Antithymocyte globulin and cyclosporine for severe aplastic anemia: association between hematologic response and long-term outcome. JAMA. 2003;289:1130–5. doi: 10.1001/jama.289.9.1130. [DOI] [PubMed] [Google Scholar]
- 7.Scheinberg P, Townsley D, Dumitriu B, et al. Moderate-dose cyclophosphamide for severe aplastic anemia has significant toxicity and does not prevent relapse and clonal evolution. Blood. 2014;124:2820–3. doi: 10.1182/blood-2014-05-573642. [DOI] [PMC free article] [PubMed] [Google Scholar]
- 8.Marmont AM, Bacigalupo A, Van Lint MT, et al. Treatment of severe aplastic anemia with high-dose methylprednisolone and antilymphocyte globulin. Prog Clin Biol Res. 1984;148:271–87. [PubMed] [Google Scholar]
- 9.Kojima S, Hibi S, Kosaka Y, et al. Immunosuppressive therapy using antithymocyte globulin, cyclosporine, and danazol with or without human granulocyte colony-stimulating factor in children with acquired aplastic anemia. Blood. 2000;96:2049–54. [PubMed] [Google Scholar]
- 10.Scheinberg P, Nunez O, Wu C, Young NS. Treatment of severe aplastic anaemia with combined immunosuppression: antithymocyte globulin, ciclosporin and mycophenolate mofetil. Br J Haematol. 2006;133:606–11. doi: 10.1111/j.1365-2141.2006.06085.x. [DOI] [PubMed] [Google Scholar]
- 11.Scheinberg P, Wu CO, Nunez O, et al. Treatment of severe aplastic anemia with a combination of horse antithymocyte globulin and cyclosporine, with or without sirolimus: a prospective randomized study. Haematologica. 2009;94:348–54. doi: 10.3324/haematol.13829. [DOI] [PMC free article] [PubMed] [Google Scholar]
- 12.Maciejewski JP, Selleri C, Sato T, Anderson S, Young NS. A severe and consistent deficit in marrow and circulating primitive hematopoietic cells (long-term culture-initiating cells) in acquired aplastic anemia. Blood. 1996;88:1983–91. [PubMed] [Google Scholar]
- 13.Scheinberg P, Wu CO, Nunez O, Young NS. Predicting response to immunosuppressive therapy and survival in severe aplastic anaemia. Br J Haematol. 2009;144:206–16. doi: 10.1111/j.1365-2141.2008.07450.x. [DOI] [PMC free article] [PubMed] [Google Scholar]
- 14.Scheinberg P, Wu CO, Nunez O, Young NS. Long-term outcome of pediatric patients with severe aplastic anemia treated with antithymocyte globulin and cyclosporine. J Pediatr. 2008;153:814–9. doi: 10.1016/j.jpeds.2008.06.004. [DOI] [PMC free article] [PubMed] [Google Scholar]
- 15.Tichelli A, Socié G, Henry-Amar M, et al. Effectiveness of immunosuppressive therapy in older patients with aplastic anemia. Ann Intern Med. 1999;130:193–201. doi: 10.7326/0003-4819-130-3-199902020-00004. [DOI] [PubMed] [Google Scholar]
- 16.Olnes MJ, Scheinberg P, Calvo KR, et al. Eltrombopag and improved hematopoiesis in refractory aplastic anemia. N Engl J Med. 2012;367:11–9. doi: 10.1056/NEJMoa1200931. [DOI] [PMC free article] [PubMed] [Google Scholar]
- 17.Desmond R, Townsley DM, Dumitriu B, et al. Eltrombopag restores trilineage hematopoiesis in refractory severe aplastic anemia that can be sustained on discontinuation of drug. Blood. 2014;123:1818–25. doi: 10.1182/blood-2013-10-534743. [DOI] [PMC free article] [PubMed] [Google Scholar]
- 18.Bhatia M, Wang JC, Kapp U, Bonnet D, Dick JE. Purification of primitive human hematopoietic cells capable of repopulating immune-deficient mice. Proc Natl Acad Sci U S A. 1997;94:5320–5. doi: 10.1073/pnas.94.10.5320. [DOI] [PMC free article] [PubMed] [Google Scholar]
- 19.Simon R. Optimal two-stage designs for phase II clinical trials. Control Clin Trials. 1989;10:1–10. doi: 10.1016/0197-2456(89)90015-9. [DOI] [PubMed] [Google Scholar]
- 20.Scheinberg P, Young NS. How I treat acquired aplastic anemia. Blood. 2012;120:1185–96. doi: 10.1182/blood-2011-12-274019. [DOI] [PMC free article] [PubMed] [Google Scholar]
- 21.Huntsman HD, Bat T, Cheng H, et al. Human hematopoietic stem cells from mobilized peripheral blood can be purified based on CD49f integrin expression. Blood. 2015;126:1631–3. doi: 10.1182/blood-2015-07-660670. [DOI] [PMC free article] [PubMed] [Google Scholar]
- 22.Maciejewski JP, Risitano A, Sloand EM, Nunez O, Young NS. Distinct clinical outcomes for cytogenetic abnormalities evolving from aplastic anemia. Blood. 2002;99:3129–35. doi: 10.1182/blood.v99.9.3129. [DOI] [PubMed] [Google Scholar]
- 23.Dumitriu B, Feng X, Townsley DM, et al. Telomere attrition and candidate gene mutations preceding monosomy 7 in aplastic anemia. Blood. 2015;125:706–9. doi: 10.1182/blood-2014-10-607572. [DOI] [PMC free article] [PubMed] [Google Scholar]
- 24.Deng Z, Glousker G, Molczan A, et al. Inherited mutations in the helicase RTEL1 cause telomere dysfunction and Hoyeraal-Hreidarsson syndrome. Proc Natl Acad Sci U S A. 2013;110:E3408–E3416. doi: 10.1073/pnas.1300600110. [DOI] [PMC free article] [PubMed] [Google Scholar]
- 25.Townsley DM, Dumitriu B, Young NS. Bone marrow failure and the telomeropathies. Blood. 2014;124:2775–83. doi: 10.1182/blood-2014-05-526285. [DOI] [PMC free article] [PubMed] [Google Scholar]
- 26.Geddis AE. Congenital amegakaryocytic thrombocytopenia. Pediatr Blood Cancer. 2011;57:199–203. doi: 10.1002/pbc.22927. [DOI] [PubMed] [Google Scholar]
- 27.Alexander WS, Roberts AW, Nicola NA, Li R, Metcalf D. Deficiencies in progenitor cells of multiple hematopoietic lineages and defective megakaryocytopoiesis in mice lacking the thrombopoietic receptor c-Mpl. Blood. 1996;87:2162–70. [PubMed] [Google Scholar]
- 28.Feng X, Scheinberg P, Wu CO, et al. Cytokine signature profiles in acquired aplastic anemia and myelodysplastic syndromes. Haematologica. 2011;96:602–6. doi: 10.3324/haematol.2010.030536. [DOI] [PMC free article] [PubMed] [Google Scholar]
- 29.Emmons RV, Reid DM, Cohen RL, et al. Human thrombopoietin levels are high when thrombocytopenia is due to megakaryocyte deficiency and low when due to increased platelet destruction. Blood. 1996;87:4068–71. [PubMed] [Google Scholar]
- 30.de Bruin AM, Voermans C, Nolte MA. Impact of interferon-γ on hematopoiesis. Blood. 2014;124:2479–86. doi: 10.1182/blood-2014-04-568451. [DOI] [PubMed] [Google Scholar]
- 31.Platzbecker U, Wong RS, Verma A, et al. Safety and tolerability of eltrombopag versus placebo for treatment of thrombocytopenia in patients with advanced myelodysplastic syndromes or acute myeloid leukaemia: a multicentre, randomised, placebo-controlled, double-blind, phase 1/2 trial. Lancet Haematol. 2015;2(10):e417–e426. doi: 10.1016/S2352-3026(15)00149-0. [DOI] [PubMed] [Google Scholar]
Associated Data
This section collects any data citations, data availability statements, or supplementary materials included in this article.