

Abstract
Background and aims
Adenoma detection rate (ADR) has been established as a quality indicator for screening colonoscopy. Because ADR is cumbersome to obtain in routine practice, polyp detection rate (PDR), polypectomy rate (PR) and adenoma-to-polyp-detection-rate-ratio (APDRR) have been proposed to estimate ADR. This study aimed to evaluate APDRR in order to estimate ADR (ADRest) in different settings.
Methods
Average risk screening and surveillance colonoscopies from a community-based private practice and a tertiary academic hospital setting were retrospectively evaluated. APDRR was calculated as averaged group APDRR for all study procedures (APDRR) and for the first half of study procedures of each gastroenterologist (APDRRag) or individually for each gastroenterologist on the basis of his or her first 25, 50 and 100 colonoscopies (APDRRind). ADRest was determined from PDR by using APDRR, APDRRag, and APDRRind, respectively.
Results
A total of 2717 individuals were analyzed. Using APDRR, significant correlations between ADR and ADRest were observed for the entire (0.944, p < 0.001), proximal (0.854, p < 0.001), and distal (0.977, p < 0.001) colon. These correlations were lost when APDRRag was used to estimate each gastroenterologist’s ADR for the second half of his or her included colonoscopies. However, ADR and ADRest correlated significantly with a root-mean-square-error of 6.8% and 5.8% when APDRRind on the basis of each gastroenterologist’s first 50 and 100 colonoscopies was used for subsequent colonoscopies.
Conclusions
ADR for subsequent colonoscopies of an individual endoscopist can be reliably estimated from PDR by using an individually calculated APDRR. Prospective studies are needed to verify this promising approach in different practice settings.
Keywords: Adenoma detection rate, colonoscopy, colorectal cancer, polyp detection rate, screening
Introduction
Colorectal cancer (CRC) is the third most commonly diagnosed cancer in males and the second most in females worldwide,1 and colonoscopy has been established as the preferable screening and surveillance method. Polyp detection rate (PDR) and adenoma detection rate (ADR) among others have been established as quality indicators for screening colonoscopy,2 with ADR being the most important quality measure, as it is directly related to key outcome indicators,3 i.e. rates of interval cancer.3 However, a significant number of adenomas and CRCs are missed during screening colonoscopy, thereby jeopardizing the ideal preventive effect.4,5 Since the actual ADR is cumbersome to obtain, the adenoma-to-polyp-detection-rate-quotient (APDRQ) has been proposed as a practical tool to easily estimate the ADR in practices with large numbers of staff gastroenterologists.6,7 Also, PDR and polypectomy rate (PR) have been proposed as quality indicators for ADR because of their good correlation with ADR.8,9 The aims of this study were to evaluate APDRQ and its individually calculated analogs in order to estimate ADR in different settings.
Patients and methods
We retrospectively evaluated consecutive screening and surveillance (follow-up because of prior detection and removal of polyps) colonoscopies of average-risk individuals between September 1998 and September 2010 at a tertiary academic hospital and from January 2012 to March 2015 in a community-based private practice setting. Individuals with an increased risk for CRC (e.g. chronic inflammatory bowel disease, hereditary cancer syndromes), patients with proven polyps and/or adenomas who had been referred for the purpose of polypectomy, and patients with a sigmoidoscopy only were excluded from this study. In accordance with German law, approval by a local ethics committee was not required (paragraph 15, sentence 1, North Rhine Medical Association’s professional code of conduct from November 14, 1998, as amended November 19, 2011), neither was a written informed consent from the participants required because of the strictly retrospective design of our study (paragraph 6, sentence 1, Health Data Protection Act of North Rhine-Westphalia).
All endoscopically visible polypoid lesions were removed for histopathological work-up. Advanced adenomas were defined as adenomas ≥10 mm, adenomas with tubular-villous or villous histology and/or with high-grade intraepithelial neoplasia. We distinguished between a proximal (from the cecum to the transverse colon excluding the splenic flexure) and a distal location (from the splenic flexure to the rectum) of all detected lesions. All patients were categorized into three age groups (<65 years, 65 to <75 years, and ≥75 years). All procedures were performed by seven experienced gastroenterologists who had performed at least 200 colonoscopies in all indications in the previous year before study start. Because APDRQ actually describes a ratio instead of a quotient, we prefer the term adenoma-to-polyp-detection-rate-ratio (APDRR). PDR, ADR, advanced ADR (advADR) and APDRR were calculated as previously described.7,10
PDR (%) = number of colonoscopies in which at least one polyp was detected and histologically confirmed, divided by the total number of colonoscopies performed by the gastroenterologist.
ADR (%) = number of colonoscopies in which at least one adenoma was detected and histologically confirmed, divided by the total number of colonoscopies performed by the gastroenterologist.
advADR (%) = number of colonoscopies in which at least one advanced adenoma was detected and histologically confirmed, divided by the total number of colonoscopies performed by the gastroenterologist.
Averaged group APDRR = average ADR of all gastroenterologists, divided by average PDR of all gastroenterologists.
Individual APDRR = ADR of a single gastroenterologist, divided by his or her PDR.
For the purpose of the study, three different APDRRs were calculated:
averaged group APDRR for all colonoscopies included (APDRR);
averaged group APDRR for the first half of colonoscopies performed by each gastroenterologist (APDRRag); and
individual APDRR for each gastroenterologist’s first 25, 50, and 100 colonoscopies, respectively (APDRRRind).
For each gastroenterologist, estimated ADR (ADRest) was then calculated as the product of APDRR and his or her individual PDR, and correlations between ADR and ADRest were calculated for the entire, proximal and distal colon as well as for each anatomic segment, respectively. Two estimation rules were calculated by using (i) APDRRag to estimate ADR for each gastroenterologist from his or her PDR of the second half of his or her colonoscopies included in the study and (ii) APDRRind to estimate ADR for each gastroenterologist from PDR of his or her subsequent colonoscopies grouped in portions of 50 procedures (estimation rule 25, 50 and 100, respectively).
Statistical analysis was performed using SPSS statistics version 22 (IBM, Chicago, IL, USA) and MS Excel (Microsoft, Richmond, VA, USA). Age was reported as median with interquartile range (IQR). Univariate analysis was performed using the χ2-test. We used Pearson’s correlation coefficient (r) to describe the strength of association between ADR and ADRest. A nonparametric test for related samples (Wilcoxon matched-pair signed-rank) was used to test the difference between different estimation rules. The root-mean-square error (RMSE) was defined as √(ADR – ADRest)2. A p value < 0.05 was considered statistically significant.
Results
We identified a total of 2717 individuals who underwent screening or surveillance colonoscopy (Table 1). Of these individuals, 1241 (45.7%) were men and 1476 (54.3%) were women. The median age was 61.8 years (IQR 56.2, 68.7), with no significant gender difference (men: 62.1 years, IQR 56.4, 70.0; women: 61.6 years, IQR 56.1, 68.5), and 61.6% of individuals were <65 years. There was no significant difference between the population in the community and the hospital setting regarding gender distribution; however, the community cohort was significantly older compared to the hospital cohort (63.2 years, IQR 57.0, 70.3 vs. 60.6 years, IQR 53.9, 67.2).
Table 1.
Study cohort characteristics.
| Total | Community setting | Hospital setting | p value | |
|---|---|---|---|---|
| Colonoscopies, n (%) | 2717 (100) | 1357 (49.9) | 1360 (50.1) | |
| Gender | ||||
| Men, n (%) | 1241 (45.7) | 640 (47.2) | 601 (44.2) | 0.120 |
| Women, n (%) | 1476 (54.3) | 717 (52.8) | 759 (55.8) | |
| Median age, years (IQR) | 61.8 (56.2, 68.7) | 63.2 (57.0, 70.3) | 60.6 (53.9, 67.2) | <0.05 |
| Age groups | ||||
| <65 years | 1674 (61.6) | 766 (56.4) | 908 (66.8) | <0.05 |
| 65 to < 75 years | 795 (29.3) | 436 (32.1) | 359 (26.4) | |
| ≥75 years | 248 (9.1) | 155 (11.4) | 93 (6.8) | |
IQR: interquartile range. p value between community setting and hospital setting.
Propofol sedation was used in 83.7% of the procedures, the cecum was intubated in 98.3% of cases, and diverticula were present in 51.8% of the patients. The overall, proximal, and distal PDR and ADR were 52.6%, 25.9%, and 40.5%, and 35.1%, 18.9%, and 24.0%, respectively. At least one advanced adenoma was detected in 7.3% of cases (2.5% in the proximal and 5.2% in the distal colon). A total of 27 CRCs were detected during the procedures, corresponding to a prevalence of 1.0%. Independent of age or gender PDR and ADR correlated closely within colon segments from the cecum to the sigmoid colon in the entire study population whereas the correlation diverged in the rectum for three gastroenterologists (Figure 1).
Figure 1.

Correspondence between PDR (%) and ADR (%) by colon segment (2: cecum; 3: ascending colon; 4: hepatic flexure; 5: transverse colon; 6: splenic flexure; 7: descending colon; 8: sigmoid colon; 9: rectum) for each endoscopist (a–g) and total cohort (h). Colon segments on x-axis, detection rate (%) on y-axis. PDR: polyp detection rate; ADR: adenoma detection rate.
Estimated ADR using averaged group APDRR
The mean APDRR for the proximal colon was significantly higher than for the distal colon only in men (0.704 ± 0.170 vs. 0.447 ± 0.196, p < 0.001; women: 0.680 ± 0.264 vs. 0.587 ± 0.213, p = 0.158) and in all three age groups (<65 years: 0.640 ± 0.254 vs. 0.510 ± 0.203, p < 0.043; 65 to <75 years: 0.721 ± 0.226 vs. 0.518 ± 0.304, p = 0.009; ≥75 years: 0.864 ± 0.176 vs. 0.620, p = 0.011). ADR and ADRest in the entire study population correlated well in the proximal, distal, and entire colon as well as in each colon segment except for the ascending colon, transverse colon and rectum (Table 2). The relationship between ADR and ADRest is depicted in Figure 2. No proportional bias was found in the Bland-Altman-plot by linear regression analysis (t-value = −0.541; p = 0.591), which means that there is an even agreement throughout the range of measurements.
Table 2.
Correlation between ADR and estimated ADR (ADRest) for the entire study population using averaged group APDRR.
| Colon segment |
Proximal | Distal | Entire | ||||||||
|---|---|---|---|---|---|---|---|---|---|---|---|
| 2 | 3 | 4 | 5 | 6 | 7 | 8 | 9 | colon | colon | colon | |
| ADR (%) | 5.60 | 9.90 | 1.80 | 5.70 | 1.00 | 4.80 | 15.20 | 7.10 | 18.9 | 24.1 | 35.1 |
| ADRest (%) | 5.29 | 9.37 | 1.92 | 5.44 | 0.99 | 4.47 | 14.00 | 6.52 | 18.13 | 22.09 | 33.51 |
| APDRR | 0.67 | 0.71 | 0.71 | 0.64 | 0.52 | 0.58 | 0.57 | 0.37 | 0.73 | 0.59 | 0.67 |
| r | 0.787 | 0.629 | 0.958 | 0.623 | 0.943 | 0.948 | 0.900 | 0.695 | 0.854 | 0.977 | 0.944 |
| p value | 0.036 | 0.130 | 0.001 | 0.135 | 0.001 | 0.001 | 0.006 | 0.083 | <0.001 | <0.001 | <0.001 |
ADR: adenoma detection rate; r: correlation coefficient; APDRR: adenoma-to-polyp-detection-rate-ratio; Colon segments: 2: cecum; 3: ascending colon; 4: hepatic flexure; 5: transverse colon; 6: splenic flexure; 7: descending colon; 8: sigmoid colon; 9: rectum.
Figure 2.
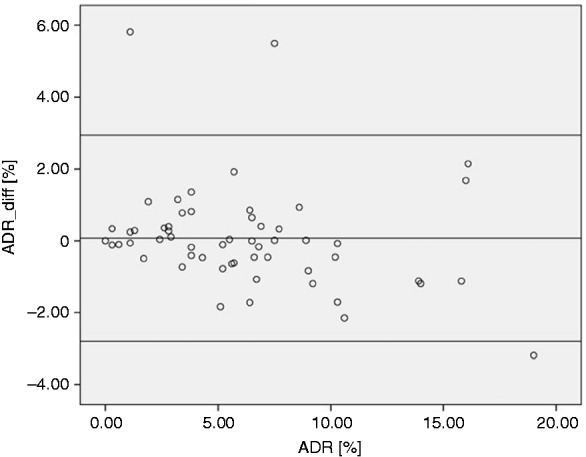
Bland-Altman-Plot demonstrating the discrepancies between ADR and estimated ADR (ARDest) using averaged group APDRR. ADR_diff (%) = ADR (%) – ADRest (%). Middle line represents the mean difference between ADR and ADRest, upper and lower lines represent the 95% tolerance limits. ADR: adenoma detection rate; APDRR: adenoma-to-polyp-detection-rate-ratio.
Estimated ADR using APDRRag from the first half of colonoscopies
When APDRRag was calculated for the first half of each gastroenterologist’s colonoscopies and APDRRag was then applied to the PDR of each gastroenterologist for the second half of his or her procedures, the mean RSME between ADR and ADRest was 5.8%, 3.1% and 5.1% for the entire, proximal and distal colon, respectively, with no significant difference between the proximal and distal colon. However, we did not find a significant correlation between ADR and ADRest for the individual endoscopist (Table 3).
Table 3.
Correlation between ADR and estimated ADR (ADRest) for the second half of study period calculated with APDRRag derived from first half of study period.
| Entire colon |
Proximal colon |
Distal colon |
|||||
|---|---|---|---|---|---|---|---|
| ADR (%) | ADRest (%) | ADR (%) | ADRest (%) | ADR (%) | ADRest (%) | ||
| Endoscopist | a | 40.1 | 33.7 | 22.6 | 20.3 | 27 | 21.4 |
| b | 37.4 | 32.9 | 24.7 | 20.0 | 20.1 | 20.7 | |
| c | 31.6 | 35.8 | 16 | 17.5 | 21.8 | 24.7 | |
| d | 33.6 | 37.3 | 17.6 | 17.9 | 24.4 | 29.2 | |
| e | 36.8 | 46.4 | 20.7 | 24.5 | 26.4 | 34.7 | |
| f | 32.6 | 39.6 | 17.4 | 22.4 | 21.7 | 27.7 | |
| g | 30.8 | 28.3 | 17.9 | 18.2 | 12.8 | 16.4 | |
| Correlation | r = 0.189 | (p = 0.684) | r = 0.341 | (p = 0.454) | r = 0.686 | (p = 0.087) | |
| RMSE (%) | 5.8 | 3.1 | 5.1 | ||||
ADR: adenoma detection rate; r: correlation coefficient; APDRRag: averaged group adenoma-to-polyp-detection-rate-ratio; r: correlation coefficient for ADR and ADRest; RMSE: root-mean-square error.
Estimated ADR using APDRRind from the first 25, 50 or 100 colonoscopies
We then tested the possibility to estimate ADR by using an individually calculated APDRRind for each gastroenterologist (Figures 3 and 4). Two gastroenterologists (f and g) were excluded from this analysis because of a low total number of examinations. ADR and ADRest correlated significantly in four of five gastroenterologists in the estimation rule 50 (two of two gastroenterologists from private practice, i.e. the later study period and two of three gastroenterologists from an academic hospital, i.e. the early study period), three of five in the estimation rule 100 (two of two and one of three gastroenterologists, respectively) and two of five in the estimation rule 25 (one of two and one of three gastroenterologists, respectively). Mean RMSE for the estimation rule 25, 50 and 100 was 9.9%, 6.8% and 5.8%, respectively. Using the Wilcoxon-test, the difference in RMSE for all gastroenterologists between estimation rule 25 and 50 (p < 0.001) as well as between estimation rule 25 and 100 (p < 0.001) were significantly different, whereas there was no significant difference between the estimation rule 50 and 100.
Figure 3.

ADR and estimated ADR (ADRest) (%) using APDRRind as a function of numbers of colonoscopies presented as groups of 50 procedures (on x-axis). The first interval represents the basis for estimation rule. The left column shows estimation rule 25, middle column estimation rule 50 and right column estimation rule 100. From top to bottom are gastroenterologists a to e. ADR: adenoma detection rate; APDRRind: adenoma-to-polyp-detection-rate-ratio individually for each gastroenterologist on the basis of his or her first 25, 50 and 100 colonoscopies.
Figure 4.

ADR plotted against estimated ADR (ADRest) calculated with APDRRind. Each point represents a group of 50 colonoscopies. r: correlation coefficient. The left column shows estimation rule 25, middle column estimation rule 50 and right column estimation rule 100 for the three gastroenterologists who ranked highest in number of performed endoscopies; APDRRind: adenoma-to-polyp-detection-rate-ratio individually for each gastroenterologist on the basis of his or her first 25, 50 and 100 colonoscopies.
Discussion
In this study, we investigated 2717 individuals from the general population with an average risk for CRC who underwent screening or surveillance colonoscopy in a community or tertiary academic hospital setting. Using an individually calculated APDRR from the first 50 patients of each endoscopist, we were able to reliably predict ADR for his or her following colonoscopies with the PDR from these procedures. Since PDR is available at the end of every colonoscopy, this approach would give the endoscopist immediate feedback about his or her performance and at the same time the risk for intentional manipulation of PDR is reduced because of its adjustment with a histologically proven ADR.
More colonoscopies were identified with the detection of at least one polyp, adenoma, or advanced adenoma in the distal colon compared to the proximal colon. We have already previously demonstrated a difference in detection rates between proximally and distally located polyps, adenomas, and advanced adenomas (PDR 23.8% vs. 40.9%, ADR 16.2% vs. 21.3%, and advADR 2.0% vs. 4.0%), which has also been detectable after differentiating for age and gender.10 Our study population corresponded well to the reported characteristics of participants of the German CRC screening program with a mean age of 64.5 ± 4.1 years and a gender distribution of 47% male and 53% female participants.11 The characteristics of colonoscopies performed in our study are also in line with previously published studies regarding cecal intubation rate, PDR, ADR, advADR, and the detection of CRC,11–13 meeting the current international consensus for quality standards for screening colonoscopies in asymptomatic participants older than 50 years of age.14
There are several studies reporting a correlation between PDR and PR, respectively, and ADR.8,9,15 A weak correlation between PR and ADR in the distal colon compared to the proximal colon has been published by Gohel et al. (r = 0.58 and r = 0.92, respectively; overall 0.80)8 as well as by Boroff et al., which has been mainly attributed to the removal of diminutive polyps in this location.6 It has been proposed that using PR as a quality indicator for screening colonoscopy might be advantageous compared to ADR, as PR is more convenient to retrieve using administrative or claims data. Furthermore, it gives the endoscopist immediate feedback about his or her performance, and, most important, PR also correlates with important endpoints as studies have demonstrated that a high PR is associated with a decrease in development of interval CRC.16 Based on a model, Gohel et al. described an increase of 7% in ADR for every 10% increase in PR.8 To meet the recommended minimal ADR for average-risk men and women of ≥25% and ≥15%, respectively, they calculated a minimal target PR of 35% in men and 25% in women;8 however, it is very easy to artificially inflate PR by removing diminutive polyps from the rectum using snare polypectomy.
Francis et al. were the first to describe APDRR (originally termed APDRQ) as a conversion factor to estimate ADR from PDR obtained during colonoscopies for all indications.7 They reported an averaged group APDRR of 0.64 (range 0.46–1.00, SD 0.13) for the entire colon with a correlation coefficient of 0.85 (95% confidence interval (CI), 0.65–0.93) between ADR and ADRest. In a study including only screening and surveillance colonoscopies, Boroff et al. reported an averaged group APDRR of 0.65 (95% CI, 0.61–0.70) in their cohort with a correlation coefficient of 0.86 (95% CI, 0.65–0.95).6 The correlation between ADR and ADRest has been significantly higher for the proximal colon (r = 0.91; 95% CI, 0.77–0.97) and the right colon (r = 0.95; 95% CI, 0.87–0.98) than for the left colon (r = 0.59; 95% CI, 0.17–0.83). The lower APDRR for the distal compared to the proximal colon—also seen in our study—can be explained by a smaller proportion of adenomas among polyps in a distal location.6
The averaged group APDRR does not offer any advantage in estimating ADR as it has been applied to colonoscopies, from which ADR was used to calculate the averaged group APDRR, explaining the observed good correlation between ADR and ADRest. Even though a large number of endoscopists had been included, the average number of colonoscopies per endoscopist ranged from approximately 966 to 168.7 Outside the United States of America, the large majority of screening and surveillance colonoscopies is performed in practices with far fewer staff endoscopists.17
However, we tested two different approaches to estimate ADR. In the first estimation rule, we used the averaged group APDRR from the first half of study procedures to estimate the individual gastroenterologist’s ADR for the second half of his or her colonoscopies. Although the mean RSME was low, especially in the proximal colon, no significant correlation was found between ADR and ADRest. In the second estimation rule, we applied an APDRR, individually derived from the first 25, 50, and 100 colonoscopies of each gastroenterologist, to his or her following procedures in steps of 50 colonoscopies each. With this estimation rule, which easily could be applied even to practices with only one endoscopist, we found a significant correlation between ADR and ADRest, especially when the first 50 or 100 colonoscopies were used as the basis for the individually calculated APDRR. We did not see an increasing deviation between ADR and ADRest over time. However, it remains open to discussion after which time interval the individual calculated APDRR has to be calculated again.
The main limitation of this study is its retrospective design and the limitations derived thereof; however, our study comprises a relatively large number of colonoscopies from two different centers with experienced gastroenterologists. Data to analyze already established quality indicators for screening colonoscopies, e.g. withdrawal time or the quality of bowel preparation, could not be retrieved from a sufficient number of cases from the electronic database. Insufficient bowel preparation may increase the number of incomplete procedures, delay the cecal intubation time as well as the withdrawal time with declining concentration of the endoscopist and unfavorable effects on PDR and ADR.14 Also, no further information about family history of CRC, total number of prior colonoscopies or concomitant medication (e.g. nonsteroidal anti-inflammatory drug (NSAID)) and above all the number of interval CRCs could be retrieved from the electronic patient files.
In conclusion, we were able to demonstrate a strong correlation between PDR and ADR for the entire colon, the proximal and distal colon as well as for each colon segment except the rectum. This also held true for men and women as well as for all age groups. Furthermore, ADR and ADRest using an individual calculated APDRR correlated well. The individual approach to calculating APDRR as a conversion factor in order to estimate ADR from easily available PDR seems promising and should be further evaluated in different practice settings.
Declaration of conflicting interests
None declared.
Funding
This research received no specific grant from any funding agency in the public, commercial, or not-for-profit sectors.
References
- 1.Torre LA, Bray F, Siegel RL, et al. Global cancer statistics, 2012. CA Cancer J Clin 2015; 65: 87–87. [DOI] [PubMed] [Google Scholar]
- 2.Rex D, Petrini JL, Baron TH, et al. Quality indicators for colonoscopy. Am J Gastroenterol 2006; 101: 873–885. [DOI] [PubMed] [Google Scholar]
- 3.Kaminski MF, Regula J, Kraszewska E, et al. Quality indicators for colonoscopy and the risk of interval cancer. N Engl J Med 2010; 362: 1795–1803. [DOI] [PubMed] [Google Scholar]
- 4.Bressler B, Paszat LF, Vinden C, et al. Colonoscopic miss rates for right-sided colon cancer: A population-based analysis. Gastroenterology 2004; 127: 452–456. [DOI] [PubMed] [Google Scholar]
- 5.Van Rijn JC, Reitsma JB, Stoker J, et al. Polyp miss rate determined by tandem colonoscopy: A systematic review. Am J Gastroenterol 2006; 101: 343–350. [DOI] [PubMed] [Google Scholar]
- 6.Boroff ES, Gurudu SR, Hentz JG, et al. Polyp and adenoma detection rates in the proximal and distal colon. Am J Gastroenterol 2013; 108: 93–99. [DOI] [PubMed] [Google Scholar]
- 7.Francis DL, Rodrigues-Correa DT, Buchner A, et al. Application of a conversion factor to estimate the adenoma detection rate from the polyp detection rate. Gastrointest Endosc 2011; 73: 493–497. [DOI] [PubMed] [Google Scholar]
- 8.Gohel TD, Burke CA, Lankaala P, et al. Polypectomy rate: A surrogate for adenoma detection rate varies by colon segment, gender, and endoscopist. Clin Gastroenterol Hepatol 2014; 12: 1137–1142. [DOI] [PubMed] [Google Scholar]
- 9.Williams JE, Holub JL, Faigel DO. Polypectomy rate is a valid quality measure for colonoscopy: Results from a national endoscopy database. Gastrointest Endosc 2012; 75: 576–582. [DOI] [PMC free article] [PubMed] [Google Scholar]
- 10.Schramm C, Mbaya N, Franklin J, et al. Patient- and procedure-related factors affecting proximal and distal detection rates for polyps and adenomas: Results from 1603 screening colonoscopies. Int J Colorectal Dis 2015; 30: 1715–1722. [DOI] [PubMed] [Google Scholar]
- 11.Adler A, Lieberman D, Aminalai A, et al. Data quality of the German screening colonoscopy registry. Endoscopy 2013; 45: 813–818. [DOI] [PubMed] [Google Scholar]
- 12.Brenner H, Altenhofen L, Kretschmann J, et al. Trends in adenoma detection rates during the first 10 years of the Germany screening colonoscopy program. Gastroenterology 2015; 149: 356–366. [DOI] [PubMed] [Google Scholar]
- 13.Pox CP, Altenhofen L, Brenner H, et al. Efficacy of a nationwide screening colonoscopy program for colorectal cancer. Gastroenterology 2012; 142: 1460–1467.e2–1460–1467.e2. [DOI] [PubMed] [Google Scholar]
- 14.Rex D, Petrini JL, Baron TH, et al. Quality indicators for colonoscopy. Am J Gastroenterol 2006; 101: 873–885. [DOI] [PubMed] [Google Scholar]
- 15.Sanaka MR, Gohel T, Podgu A, et al. Adenoma and sessile serrated polyp detection rates: Variation by patient sex and colonic segment but not specialty of the endoscopist. Dis Colon Rectum 2014; 57: 1113–1119. [DOI] [PubMed] [Google Scholar]
- 16.Baxter NN, Sutradhar R, Forbes SS, et al. Analysis of administrative data finds endoscopist quality measures associated with postcolonoscopy colorectal cancer. Gastroenterology 2011; 140: 65–72. [DOI] [PubMed] [Google Scholar]
- 17.Adler A, Wegscheider K, Lieberman D, et al. Factors determining the quality of screening colonoscopy: A prospective study on adenoma detection rates, from 12,134 examinations (Berlin colonoscopy project 3, BECOP-3). Gut 2013; 62: 236–241. [DOI] [PubMed] [Google Scholar]