Abstract
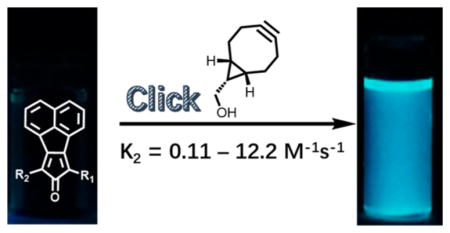
Bioorthogonally activated smart probes greatly facilitate the selective labeling of biomolecules in living system. Herein, we described a novel type of smart probes with tunable reaction rates, high fluorescence turn-on ratio, and easy access. The practicality of such probes was demonstrated by selective labeling of lipid and hCAII in Hela cells.
Graphical Abstract
INTRODUCTION
The ability to selectively label biomolecules greatly facilitates the understanding of their dynamic roles under physiological and pathological conditions. Such understanding could help the identification of specific biomarkers and development of therapeutic agents against human diseases.1–5 Bioorthogonal chemistry holds great promise in selective labeling of biomolecules, which normally involves two steps: tagging biomolecules of interest with a reporter group and then “clicking” with a secondary reagent normally bearing a fluorescent probe.6–10 In most cases, an excess of the secondary reagent is employed to guarantee an adequate labeling efficiency. As a result, an intensive washing step is required to remove the excessive unreacted fluorescent reagent in order to eliminate the background fluorescence, which can also reduce the specific labeling when a noncovalent tagging strategy is employed.11 Additionally, such florescent reagents cannot be applied to situations where a washing step is impractical, such as real-time monitoring of biomolecules’ dynamic processes and in vivo labeling.
In order to address aforementioned issues, there have been a high level of interest in developing bioorthogonally activated smart probes where the florescence is “turned on” upon the click reaction between the two reagents used, and hence, the tedious washing steps become unnecessary.11 For optimal performance, the smart probes should ideally possess the following characteristics: (1) tunable reaction kinetics; (2) fast reaction without the need of additional catalysis; and (3) high fluorescence turn-on ratio (a 100-fold turn-on ratio was considered to be preferable for robust labeling).12 There have been several elegant types of smart probes developed where the fluorescence of the fluorophore is quenched by azido, alkyne,13–17 phosphorus (Staudinger reaction),18–21 or tetra-zine,12,22–28 and the fluorescence is turned on after the click reaction. However, few of them meet all the aforementioned requirements.12 The fast and tunable reaction rates for tetrazine ligation (with trans-cyclooctene) stand out among others; however, only a moderate turn-on ratio (10–20 fold) was achieved in most cases.22,23,29 Consequently, there is still a need for further improvement, especially in terms of reaction rate tunability, reaction rate enhancement, and fluorescence “turn-on” ratio.
One way to design a labeling system with a high fluorescence turn-on ratio is the formation of a fluorophore as the result of the labeling reaction, in contrast to fluorescence quenching strategies. In such a case, only one fluorescent species is involved, and hence, a high fluorescence turn-on ratio can be expected. Very recently, Guo and co-workers described a new probe based on such a strategy employing the reaction between tetrazine and a terminal alkene for selective protein labeling. Although the stability of the terminal alkene is superior to strained alkenes (e.g., trans-cyclooctene), the reaction rate is compromised (k2 = 0.078 M−1 s−1).30 Herein, we described a novel bioorthogonal turn-on probe based on the fluorophore generation strategy, which does not involve any catalyst, has tunable reaction rates, becomes significantly fluorescent after the labeling reaction, and can be easily synthesized in just one step from readily available starting materials.
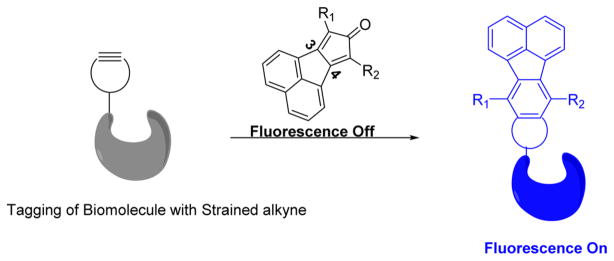
Previously, we have described the click reaction between tetraphenylcyclopentadienone and a strained alkyne (e.g., endo-BCN) as a prodrug for carbon monoxide.31 We envisioned that attachment of an appropriate chromophore to the cyclopentadienone system could lead to the formation of a fluorophore upon the click reaction. After examining various possibilities, we found that fusing a naphthalene group at positions 3 and 4 of the cyclopentadienone moiety allowed for the synthesis of a series of cyclopentadienones (Figure 1), which are nonfluorescent and yet are readily converted to highly fluorescent compounds after click reaction with a strained alkyne. Therefore, by tagging the biomolecules of interest with a strained alkyne, such smart probes could be employed for selective wash-free labeling of biomolecules.
Figure 1.
Selective labeling of biomolecules of interest with smart probes.
RESULTS AND DISCUSSION
The synthesis of the smart probes is quite straightforward and only involves one step, as shown in Scheme 1. Specifically, commercial ketone compounds 1a/c and diketone 2 were reacted to afford probes 3a/c by following literature procedures.32,33 By using a similar method used for the synthesis of 3c, 3b was also synthesized in high yield using 1b as starting material.
Scheme 1.
Synthesis of the Smart Probes
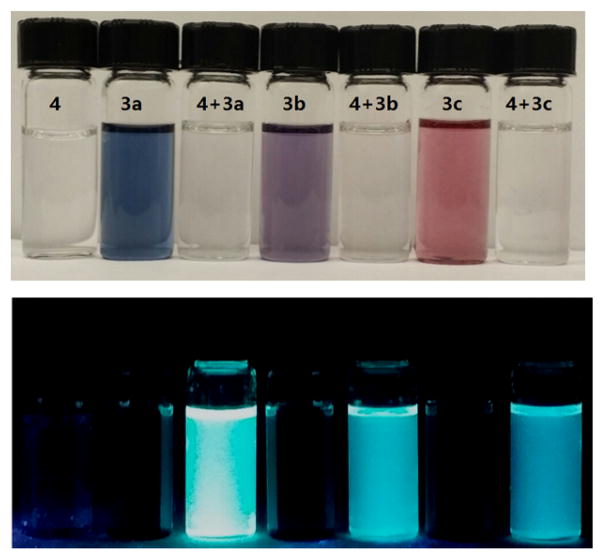
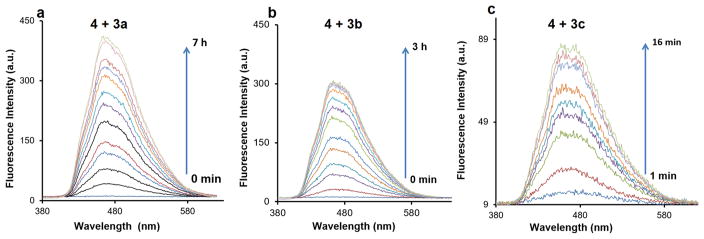
With these compounds in hand, we next tested their spectroscopic profiles. The solution of compounds 3a–c showed a blue, purple, or red color (Figure 2a), respectively, but no fluorescence. Click reaction with endo-BCN (4) in DMSO/PBS (10:1) at 37 °C led to time-dependent appearance of strong blue fluorescence with the concomitant disappearance of the color of the dienone compounds (Figures 2b and 3).
Figure 2.
Colorimetric (a) and fluorescent changes (b) after the reaction between 3a (300 μM, 6 h), 3b (300 μM, 1 h), or 3c (300 μM, 5 min) and 4 (1 mM) (DMSO/PBS (pH = 7.4) = 10:1, 37 °C).
Figure 3.
Time-dependent fluorescence changes of the reaction of 3a–c with 4 (DMSO/PBS (pH = 7.4) = 10:1, 37 °C): initial concentrations for 3a–c and 4 were (a) 80 μM (3a)/1 mM (4); (b) 50 μM (3b)/500 μM (4); (c) 16 μM (3c)/160 μM (4).
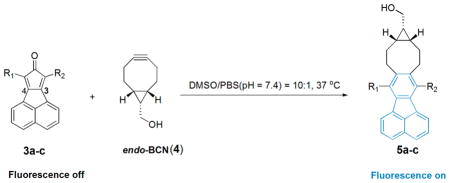
The fluorescent products were confirmed by NMR and HRMS as the cycloaddition products 5a–c (Table 1). As shown in Figure 3, the λem for compounds 5a–c is 461, 462, and 465 nm, respectively. The quantum yields for compounds 5a–c were determined by a relative comparison method using a well-characterized standard, quinine sulfate,34 and were found to be in the range of (0.13 ± 0.01)–(0.17 ± 0.02) with compound 5a having the highest quantum yield of 0.17 ± 0.02.
Table 1.
Click Reactions between 4 and 3a–c
| ||||
|---|---|---|---|---|
| compd | ka (M−1 s−1) | λex/λem b (nm) | Φc | BRe (M−1 cm−1) |
| 3a: R1 = R2 = Ph | 0.11 ± 0.01 | 370/461 | 0.17 ± 0.02 | 2.7 |
| 3b: R1 = Ph, R2 = COOMe | 1.30 ± 0.11 | 370/462 | 0.13 ± 0.01 | 1.4 |
| 3c: R1 = R2 = COOMe | 12.2 ± 0.6d | 368/465 | 0.13 ± 0.01 | 1.7 |
Second-order reaction rate constants.
The excitation/emission wavelength for the clicked products 5a–c.
The quantum yield of the clicked products 5a–c in methanol.
Reaction rate constant was determined at room temperature.
The brightness of compounds 5a–c was calculated by extinction coefficient × quantum yield/1000.
The significant difference in the fluorescence properties between the dienone compounds 3a–c and the cycloaddition products 5a–c allowed for easy determination of the second-order rate constant (DMSO/PBS, 10:1, pH = 7.4). Since the reaction between 3c and 4 is very fast (e.g., the reaction is finished within 16 min with an initial concentration of 160 μM), the second-order reaction rate constant was determined at room temperature instead of 37 °C, which was the condition used for determination of rate constants for 3a/b with 4. The reaction rate constant between compounds 3c and 4 (12.2 ± 0.6 M−1 s−1) is the highest because of the two strong electron-withdrawing ester groups (Table 1). This is expected because such electron-withdrawing groups decrease the gap between the LUMO of the diene and the HOMO of the dienophile in this DAinv reaction. The reaction rate constant for compound 3b with 4 (1.30 ± 0.11 M−1 s−1) is higher than that of compound 3a (0.11 ± 0.01 M−1 s−1), presumably because the ester group is more electron-withdrawing than the phenyl group in 3a. We also calculated the HOMO energy of 4 and LUMO energies of 3a, 3b and 3c by following published procedures.35 The HOMO energy level for 4 was calculated to be −144.4 kcal/mol, and the LUMO energy level for compounds 3a, 3b, and 3c was −62.9, −68.4, or −74.1 kcal/mol, respectively. Such results are qualitatively consistent with the trend of the observed second-order rate constants for the reaction between 4 and dienone compounds 3a–c.
Having confirmed that compounds 3a–c could be turned on by clicking with a strained alkyne, we next tested whether these probes could be applied to a real biological milieu for labeling purpose. Lipids have been shown to play vital roles in regulating many signaling pathways, and their abnormalities are associated with many human diseases.36 Selective labeling of lipids facilitates the study of lipid metabolism, protein lipidation, and other lipid biological roles.37,38 Some elegant labeling strategies have been successfully employed to visualize lipids in living cells, including bioorthogonally activated probes.24,39 In order to demonstrate the practicality of our probes, compound 3b was chosen for the labeling of lipids in Hela cells. For this purpose, an endo-BCN-modified phospho-lipid 7 was synthesized by conjugating DOPE with the activated ester of endo-BCN 6 (Scheme 2).
Scheme 2.
Synthesis of Lipid with endo-BCN Conjugation
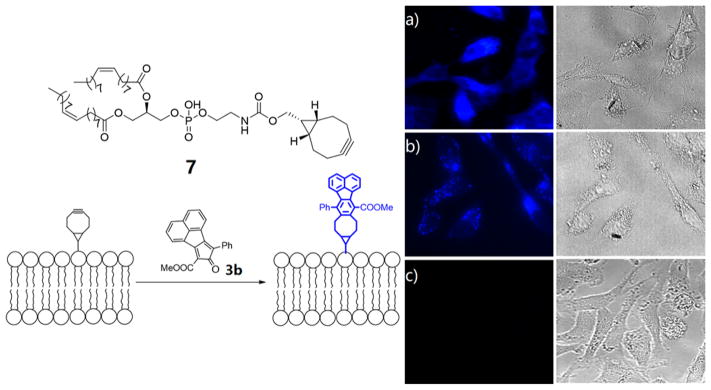
Hela cells were then preincubated with compound 7 for 1 h. After being washed with medium, the cells were subsequently incubated with probe 3b for another 4 h. Then the cells were fixed and imaged using a fluorescent microscope under DAPI imaging channel (excitation: 358 nm, emission: 461 nm). As shown in Figure 4a, the cells incubated with both compounds 7 and 3b showed strong blue fluorescence, yet the control cells treated with compound 3b only did not exhibit any fluorescence (Figure 4c), which highlighted the benefit of the bioorthogonally activated smart probes. The cells treated with 4 and 3b also showed blue fluorescence, yet the fluorescence primarily located in the cytoplasm (Figure 4b) and is different from the one shown in Figure 4a, which was presumably well-distributed on the cell surface.
Figure 4.
Two-step labeling of lipids in Hela cells. (a) Cells pretreated with 7 (100 μM) for 1 h and followed by treatment of 3b (50 μM) for 4 h. (b) Cells pretreated with 4 (100 μM, without phospholipid conjugation) for 1 h and followed by treatment of 3b (50 μM) for 4 h. (c) Cells treated with dienone compound 3b (50 μM) only. The image was taken under DAPI channel.
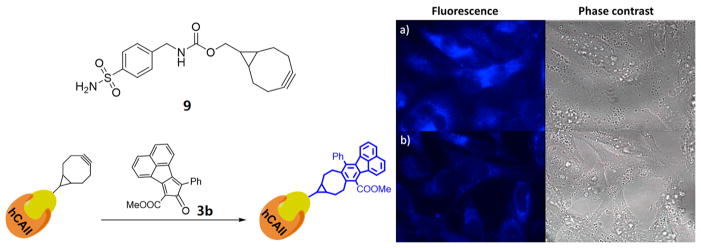
By installing a clickable handle on small-molecule inhibitors without disturbing their binding affinity to the target proteins, bioorthogonal smart probes have been applied to the investigation of the distribution of such inhibitors and, thus, the expression level and sublocation of the protein of interest in cells.22,24 Human carbonic anhydrase II (hCAII) is one of 14 forms of human α carbonic anhydrase, which regulate numerous physiological processes and play pivotal roles in a variety of diseases, including glaucoma, epilepsy, and cancer.40 It has been reported that 4-(aminomethyl)benzenesulfonamide (8, Scheme 3) showed potent inhibitory activity to hCAII, and chemical modifications to the benzylamino group impose little impact on the binding to hCAII.41,42 Therefore, compound 9 with endo-BCN conjugation was synthesized (Scheme 3) for two-step labeling of hCAII protein in Hela cells.
Scheme 3.
Synthesis of endo-BCN-Conjugated hCAII Inhibitor
Hela cells were pretreated with compound 9 for 1 h. After being washed with medium, the cells were subsequently incubated with probe 3b for another 4 h. Then the cells were fixed and imaged under DAPI channel. As shown in Figure 5a, the cells treated with compound 9 and 3b showed strong blue fluorescence, yet the cells treated with compound 9 or 3b only did not present any fluorescence (data not shown). In order to confirm that the blue florescence was mainly the result of binding by 9 to hCaII, the cells were pretreated with 100 μM of the inhibitor 8 for 1 h. After being washed with medium, the cells were further incubated with compound 9 for another 1 h. The cells were washed again to remove the unbound compound 9, followed by the incubation with probe 3b for another 4 h. Then the cells were fixed for imaging study under DAPI channel. As shown in Figure 5b, the intensity of the blue fluorescence was significantly weaker as compared to the one in Figure 5a, which presumably was due to the competition between compound 9 and the inhibitor 8 in binding to the target protein. Such a strategy showed potential as a high-throughout screening assay for the discovery of new inhibitors for the target protein in living cells.
Figure 5.
Two-step labeling of hCAII with biorthogonal activated probe. (a) Cells pretreated with compound 9 (20 μM) for 1 h then followed by the treatment of probe 3b (50 μM) for another 4 h. (b) Cells treated with inhibitor 8 (100 μM) for 1 h and followed the treatment of 9 (20 μM, 1 h) and 3b (50 μM, 4 h) separately. The image was taken under DAPI channel.
CONCLUSIONS
In conclusion, several cyclopentadienones were designed as a novel type of smart probes. These probes are nonfluorescent and generate a highly fluorescent fluorophore after labeling reaction with a strained alkyne (e.g., endo-BCN) under near-physiological conditions. The second-order reaction rate is tunable with the rate constants ranging from 0.11 ± 0.01 to 12.2 ± 0.6 M−1 s−1 with the three cyclopentadienones studied. This represents a 100-fold change in reaction rate constants. The application of these probes was demonstrated by the wash-free labeling of lipids and hCAII protein in Hela cells using BCN modified probes and compound 3b. Therefore, we believe that the probes reported herein hold great promise in the wash-free labeling of other biomolecules.
EXPERIMENTAL SECTION
General Methods
All reagents and solvents were of reagent grade. Column chromatography was carried out using flash silica gel (230–400 mesh) and P-2 Gel (particle size range 45–90 μm). TLC analysis was conducted on silica gel plates (Silica G UV254). NMR spectra were recorded at 400 MHz for 1H and 100 MHz for 13C. Chemical shifts (δ values) and coupling constants (J values) are given in ppm and hertz, respectively, using the respective solvent (1H NMR, 13C NMR) as the internal reference. IR spectra were recorded on a FT-IR system, and were reported in frequency of absorption (cm−1). Mass spectrometric results were obtained by the GSU Mass Spectrometry Facilities with a TOF analyzer.
7, 9-Diphenyl-8H-cyclopent[a]acenaphthylen-8-one (3a)
Compound 3a was synthesized by following previously published procedures (yield 75%).33 1H NMR (CDCl3): 8.08 (d, J = 7.2 Hz, 2H), 7.89–7.86 (m, 6H), 7.61 (t, J = 7.6 Hz, 2H), 7.55 (t, J = 7.6 Hz, 4H), and 7.43 (t, J = 7.2 Hz, 2H). HRMS (ESI) m/z: [M + H]+ calcd for C27H17O 357.1279, found 357.1291.
Methyl 8-Oxo-9-phenyl-8H-cyclopent[a]acenaphthylene-7-carboxylate (3b)
A solution of compound 1b (1.0 g, 5.2 mmol), which was synthesized following literature procedures,32 and acenaphthylene-1, 2-dione (0.95 g, 1 equiv) in THF/MeOH (30/10 mL) was treated with Et3N (0.79 g, 1.5 equiv), and the reaction mixture was stirred overnight at room temperature. The formed dark green precipitate was filtered and washed with methanol to give compound 3b as dark green solid (1.0 g, yield 60%). 1H NMR (CDCl3): 8.77 (d, J = 7.2 Hz, 1H), 8.09–8.05 (m, 2H), 7.94 (d, J = 8.0 Hz, 1H), 7.84 (d, J = 7.2 Hz, 2H), 7.80 (t, J = 7.6 Hz, 1H), 7.63 (t, J = 8.0 Hz, 1H), 7.54 (t, J = 8.0 Hz, 2H), 7.47 (t, J = 7.6 Hz, 1H), and 4.03 (s, 3H). HRMS (ESI) m/z: [M + H]+ calcd for C23H15O3 339.1021, found 339.1036.
Dimethyl 8-oxo-8H-cyclopent[a]acenaphthylene-7, 9-dicar-boxylate (3c)43
By a similar method used to synthesize 3b, 3c was obtained as a red solid (210 mg, yield 65%). 1H NMR (CDCl3): 8.67 (d, J = 7.2 Hz, 2H), 8.09 (d, J = 8.0 Hz, 2H), 7.80 (t, J = 7.2 Hz, 2H), and 4.01 (s, 6H). HRMS (ESI) m/z: [M + H]+ calcd for C19H13O5 321.0763, found 321.0755.
General Procedure for the Click Reaction between Compounds 3a–c and 4
A solution of 4 (10 mg, 0.067 mmol) and compound 3a, 3b, or 3c (0.5 equiv) in DMSO/PBS (pH = 7.4, 10:1, 11 mL) was incubated at 37 °C until the featured color for 3a–c disappeared. Then water (30 mL) was added, and product was extracted with ethyl acetate (3 × 30 mL). The combined organic layer was dried over anhydrous Na2SO4. After filtration and concentration, the obtained residue was purified over silica gel column using CH2Cl2/ethyl acetate (20:1) to obtain compounds 5a–c.
5a
Pale yellow solid (13 mg, yield 85%). 1H NMR (CDCl3, 60 °C): δ 7.67–7.50 (m, 8H), 7.46 (t, J = 7.6 Hz, 4H), 7.24 (t, J = 7.6 Hz, 2H), 6.37 (d, J = 7.2 Hz, 2H), 3.75 (d, J = 7.2 Hz, 2H), 2.97–2.69 (m, 4H), 2.06 (br, 2H), 1.31–1.10 (m, 5H). 13C NMR (CDCl3): 141.1, 136.9, 135.2, 132.8, 129.6, 129.3, 129.1, 128.9, 127.6, 127.4, 125.9, 122.5, 65.8, 59.8, 29.7, 17.2, and 15.4. IR (ν, cm−1): 3356, 2922, 1425, 1237, 1019, 825, 770, 700. HRMS (ESI) m/z: [M + Na]+ calcd for C36H30ONa 501.2194, found 501.2197.
5b
Pale yellow solid (13 mg, yield 87%). 1H NMR (CD3CN, 60 °C) δ 7.90 (d, J = 8.0 Hz, 1H), 7.79 (d, J = 8.0 Hz, 2H), 7.69–7.62 (m, 4H), 7.44–7.39 (m, 2H), 7.35–7.21 (m, 1H), 6.34 (d, J = 8.0 Hz, 1H), 4.15 (s, 3H), 3.62 (br, 2H), 3.08 (br, 1H), 2.99–2.79 (m, 2H), 2.72 (br, 1H), 2.30 (br, 1H), 2.19–2.18 (m, 1H), 1.71–1.38 (m, 2H), 1.02–0.93 (m, 3H). 13C NMR (CDCl3): 171.2, 136.2, 136.0, 134.7, 132.8, 132.7, 129.8, 129.7, 129.1, 129.0, 127.8, 127.7, 127.6, 127.0, 126.4, 122.8, 121.4, 60.4, 59.8, 52.5, 34.8, 29.7, 28.8, 27.9, and 14.1. IR (ν, cm−1): 3410, 2929, 1719, 1429, 1225, 1284, 1141, 1018, 824, 772, 704. HRMS (ESI) m/z: [M + Na]+ calcd for C32H28O3Na 483.1936, found 483.1913.
5c
Pale yellow solid (13 mg, yield 88%). 1H NMR (CD3CN, 60 °C): δ 7.98 (d, J = 8.0 Hz, 2H), 7.80 (d, J = 8.0 Hz, 2H), 7.71(t, J = 8.0 Hz, 2H), 4.14 (s, 6H), 3.62 (br, 2H), 3.09–3.03 (m, 2H), 2.92–2.85 (m, 2H), 2.35–2.13 (m, 3H), 1.62 (br, 2H), 1.02 (br, 1H), 0.91 (br, 2H). 13C NMR (CDCl3): 170.2, 134.1, 133.8, 132.6, 130.1, 129.9, 127.9, 127.4, 121.8, 59.7, 52.6, 29.7, 22.7, 21.1, and 14.2. IR (ν, cm−1): 2923, 1715, 1430, 1224, 1284, 1139, 1014, 822, 769. HRMS (ESI) m/z: [M + Na]+ calcd for C28H26O5Na 465.1678, found 465.1663.
Synthesis of Lipid with endo-BCN Conjugation (7)
The activated ester of endo-BCN 6 (60 mg, 0.19 mmol) was dissolved in DMF/THF (3 mL/1.5 mL), and then DOPE-NH2 (100 mg, 0.14 mmol) and Et3N (23 mg, 0.23 mmol) were added in one portion. The obtained solution was stirred at 60 °C for 6 h. Then the reaction mixture was dried under vacuum. The obtained residue was purified over silica gel using DCM/MeOH (10:1) to afford compound 7 as a colorless oil (77 mg, yield 60%). 1H NMR (CDCl3): 9.35 (s, 1H), 5. 40–5.31 (m, 4H), 5.24 (br, 1H), 4.41–4.38 (m, 1H), 4.21–4.15 (m, 3H), 3.98 (br, 4H), 3.43–3.25 (m, 3H), 2.30–2.22 (m, 9H), 2.07–1.99 (m, 7H), 1.51–1.21 (m, 49H), 0.96–0.88 (m, 8H). 13C NMR (CDCl3): 173.4, 173.0, 130.0, 129.7, 98.8, 46.5, 34.2, 34.1, 31.9, 29.8, 29.54, 29.4, 29.3, 29.2, 29.2, 29.1, 27.2, 27.1, 24.9, 24.8, 22.7, 21.4, 20.3, 20.2, 18.9, 14.1. IR (ν, cm−1): 3360, 2923, 2853, 1738, 1719, 1460, 1233, 1061. HRMS (ESI) m/z: [M – H] − calcd for C52H89NO10P 918.6224, found 918.6258.
Synthesis of hCAII Inhibitor with endo-BCN Conjugation (9)
The activated ester of endo-BCN 6 (50 mg, 0.16 mmol) was dissolved in DMF (4 mL), and then 8 (44 mg, 0.24 mmol) and Et3N (24 mg, 0.24 mmol) were added in one portion. The obtained solution was stirred at room temperature for 6 h. Then the reaction mixture was dried under vacuum. The obtained residue was purified over silica gel (hexane/ethyl acetate = 2:1) to afford compound 9 as a white solid (40 mg, yield 70%). 1H NMR (DMSO-d6): δ 7.77 (d, J = 8.0 Hz, 3H), 7.42 (d, J = 8.0 Hz, 2H), 7.31 (s, 2H), 4.24 (d, J = 6.0 Hz, 2H), 4.08 (d, J = 8.0 Hz, 2H), 2.24–2.09 (m, 6H), 1.54–1.52 (m, 2H), 1.38–1.22 (m, 1H), 0.90–0.85 (m, 2H). 13C NMR (DMSO-d6): δ 157.2, 144.5, 143.1, 127.8, 126.1, 99.5, 62.2, 43.9, 29.1, 21.3, 20.1, 18.1. IR (ν, cm−1): 3383, 3216, 3092, 1689, 1537, 1317, 1267, 1151, 1138, 910, 808, 670. HRMS (ESI) m/z: [M + H]+ calcd for C18H23N2O4S 363.1373, found 363.1366.
Determination of the Quantum Yield for Compounds 5a–c
The quantum yields of compounds 5a–c were determined by a comparative method using a well characterized standard, quinine sulfate (Φ = 0.54 in 0.05 M of H2SO4). Briefly, a series of solutions of compounds 5a–c and standard with different concentrations (4, 8, 12, 16, and 20 μM) were prepared, and the UV absorbance at their excitation wavelength was taken. Then the fluorescence of the same solution was recorded. The integrated fluorescence was plotted against the absorbance, and the quantum yield for the compounds was calculated according to the following equation
| (1) |
where the subscripts ST and x denote standard and compound respectively; Φ is the fluorescence quantum yield; grad is the gradient from the plot of integrated fluorescence intensity against absorbance; and η is the refractive index of the solvent.
Determination of the Second-Order Reaction Rate Constants between 3a–c and 4
The fluorescent property of the cycloaddition products 5a–c greatly facilitates the determination of the second-order reaction rate constants between 3a–c and 4 (DMSO/PBS = 10:1, 37 °C). The reaction rate constant for 3c was determined at room temperature. Briefly, the second-order reaction was treated as a pseudo-first-order reaction by using an excessive amount of 4 (>10-fold). The reaction process was monitored by the increase of the fluorescence intensity of the click product at different time intervals. The fluorescence intensity was then plotted against time, and the resulting curve was fitted using Sigmaplot to obtain the pseudo-first-order reaction rate constant k′. The obtained k′ was then plotted against the concentration of 4 used, and the slope is the second-order reaction rate constant between 3a–c and 4.
Cell Imaging
HeLa cells (ATCC CCL-2) were maintained in DMEM (Dulbecco’s Modified Eagle’s Medium) supplemented with 10% fetal bovine serum (MidSci; S01520HI) and 1% penicillin–streptomycin (Sigma-Aldrich; P4333) at 37 °C with 5% CO2. The medium was changed every other day. All of the experiments were done within 10 passages of HeLa cells.
1. . Lipid Imaging
The HeLa cells were seeded on coverslips in the six-well plate 1 day before compound treatment. The compounds were dissolved in DMSO as stock solution. The cells were incubated with 7 (100 μM) for 1 h. The cells were then washed with PBS followed by incubation with 3b (50 μM) for 4 h under 37 °C. The cells treated with 7 or 3b only were used as negative controls.
2. . Carbonic Anhydrase II Imaging
The HeLa cells were seeded on coverslips in the six-well plate 1 day before the compound treatment. The compounds were dissolved in DMSO as stock solution. The cells were incubated with 9 (20 μM) for 1 h. The cells were then washed with PBS followed by incubation with 3b (50 μM) for 4 h at 37 °C. For the competitive binding assay, the cells were first incubated with 100 μM inhibitor 8 for 1 h and then followed the incubation steps stated above. After that, the cells were washed with PBS twice and fixed with 4% paraformaldehyde in PBS for 30 min at room temperature. Then the cell samples were immersed in 300 μM glycine in PBS for 1 h at room temperature to quench the autofluorescence. The cells were then washed with PBS twice and the coverslips with cells were immersed in deionized water. The coverslips were mounted onto glass slides using the mounting media without DAPI (ProLong Live Antifade Reagent; P36974). The fluorescent imaging was performed on a Zeiss fluorescent microscope, using DAPI imaging channel (excitation 358 nm, emission 461 nm).
Supplementary Material
Acknowledgments
Partial financial support from the National Institutes of Health (CA180519) is gratefully acknowledged.
Footnotes
Notes
The authors declare no competing financial interest.
The Supporting Information is available free of charge on the ACS Publications website at DOI: 10.1021/acs.joc.6b02654.
Data for the reaction rate constant and quantum yield of the click product, tables of atom coordinates, and 1H and 13C NMR spectra of products (PDF)
References
- 1.Grammel M, Hang HC. Nat Chem Biol. 2013;9:475. doi: 10.1038/nchembio.1296. [DOI] [PMC free article] [PubMed] [Google Scholar]
- 2.Gonçalves MST. Chem Rev. 2009;109:190. doi: 10.1021/cr0783840. [DOI] [PubMed] [Google Scholar]
- 3.Patterson DM, Nazarova LA, Prescher JA. ACS Chem Biol. 2014;9:592. doi: 10.1021/cb400828a. [DOI] [PubMed] [Google Scholar]
- 4.Lang K, Chin JW. Chem Rev. 2014;114:4764. doi: 10.1021/cr400355w. [DOI] [PubMed] [Google Scholar]
- 5.McKay CS, Finn MG. Chem Biol. 2014;21:1075. doi: 10.1016/j.chembiol.2014.09.002. [DOI] [PMC free article] [PubMed] [Google Scholar]
- 6.Lang K, Chin JW. ACS Chem Biol. 2014;9:16. doi: 10.1021/cb4009292. [DOI] [PubMed] [Google Scholar]
- 7.Debets MF, van Hest JC, Rutjes FP. Org Biomol Chem. 2013;11:6439. doi: 10.1039/c3ob41329b. [DOI] [PubMed] [Google Scholar]
- 8.Sletten EM, Bertozzi CR. Angew Chem, Int Ed. 2009;48:6974. doi: 10.1002/anie.200900942. [DOI] [PMC free article] [PubMed] [Google Scholar]
- 9.Baskin JM, Bertozzi CR. QSAR Comb Sci. 2007;26:1211. [Google Scholar]
- 10.Ramil CP, Lin Q. Chem Commun. 2013;49:11007. doi: 10.1039/c3cc44272a. [DOI] [PMC free article] [PubMed] [Google Scholar]
- 11.Shieh P, Bertozzi CR. Org Biomol Chem. 2014;12:9307. doi: 10.1039/c4ob01632g. [DOI] [PMC free article] [PubMed] [Google Scholar]
- 12.Carlson JC, Meimetis LG, Hilderbrand SA, Weissleder R. Angew Chem, Int Ed. 2013;52:6917. doi: 10.1002/anie.201301100. [DOI] [PMC free article] [PubMed] [Google Scholar]
- 13.Jewett JC, Bertozzi CR. Org Lett. 2011;13:5937. doi: 10.1021/ol2025026. [DOI] [PMC free article] [PubMed] [Google Scholar]
- 14.Li J, Hu M, Yao SQ. Org Lett. 2009;11:3008. doi: 10.1021/ol9010344. [DOI] [PubMed] [Google Scholar]
- 15.Le Droumaguet C, Wang C, Wang Q. Chem Soc Rev. 2010;39:1233. doi: 10.1039/b901975h. [DOI] [PubMed] [Google Scholar]
- 16.Shieh P, Dien VT, Beahm BJ, Castellano JM, Wyss-Coray T, Bertozzi CR. J Am Chem Soc. 2015;137:7145. doi: 10.1021/jacs.5b02383. [DOI] [PMC free article] [PubMed] [Google Scholar]
- 17.Sivakumar K, Xie F, Cash BM, Long S, Barnhill HN, Wang Q. Org Lett. 2004;6:4603. doi: 10.1021/ol047955x. [DOI] [PubMed] [Google Scholar]
- 18.Hangauer MJ, Bertozzi CR. Angew Chem, Int Ed. 2008;47:2394. doi: 10.1002/anie.200704847. [DOI] [PMC free article] [PubMed] [Google Scholar]
- 19.Lemieux GA, De Graffenried CL, Bertozzi CR. J Am Chem Soc. 2003;125:4708. doi: 10.1021/ja029013y. [DOI] [PubMed] [Google Scholar]
- 20.Cohen AS, Dubikovskaya EA, Rush JS, Bertozzi CR. J Am Chem Soc. 2010;132:8563. doi: 10.1021/ja101766r. [DOI] [PMC free article] [PubMed] [Google Scholar]
- 21.Prescher JA, Dube DH, Bertozzi CR. Nature. 2004;430:873. doi: 10.1038/nature02791. [DOI] [PubMed] [Google Scholar]
- 22.Devaraj NK, Hilderbrand S, Upadhyay R, Mazitschek R, Weissleder R. Angew Chem, Int Ed. 2010;49:2869. doi: 10.1002/anie.200906120. [DOI] [PMC free article] [PubMed] [Google Scholar]
- 23.Lang K, Davis L, Torres-Kolbus J, Chou C, Deiters A, Chin JW. Nat Chem. 2012;4:298. doi: 10.1038/nchem.1250. [DOI] [PMC free article] [PubMed] [Google Scholar]
- 24.Yang KS, Budin G, Reiner T, Vinegoni C, Weissleder R. Angew Chem, Int Ed. 2012;51:6598. doi: 10.1002/anie.201200994. [DOI] [PMC free article] [PubMed] [Google Scholar]
- 25.Liu DS, Tangpeerachaikul A, Selvaraj R, Taylor MT, Fox JM, Ting AY. J Am Chem Soc. 2012;134:792. doi: 10.1021/ja209325n. [DOI] [PMC free article] [PubMed] [Google Scholar]
- 26.Lang K, Davis L, Wallace S, Mahesh M, Cox DJ, Blackman ML, Fox JM, Chin JW. J Am Chem Soc. 2012;134:10317. doi: 10.1021/ja302832g. [DOI] [PMC free article] [PubMed] [Google Scholar]
- 27.Meimetis LG, Carlson JC, Giedt RJ, Kohler RH, Weissleder R. Angew Chem, Int Ed. 2014;53:7531. doi: 10.1002/anie.201403890. [DOI] [PMC free article] [PubMed] [Google Scholar]
- 28.Wu H, Yang J, Seckute J, Devaraj NK. Angew Chem, Int Ed. 2014;53:5805. doi: 10.1002/anie.201400135. [DOI] [PMC free article] [PubMed] [Google Scholar]
- 29.Yang J, Seckute J, Cole CM, Devaraj NK. Angew Chem, Int Ed. 2012;51:7476. doi: 10.1002/anie.201202122. [DOI] [PMC free article] [PubMed] [Google Scholar]
- 30.Shang X, Song X, Faller C, Lai R, Li H, Cerny R, Niu W, Guo J. Chem Sci. 2017 doi: 10.1039/C6SC03635J. [DOI] [PMC free article] [PubMed] [Google Scholar]
- 31.Wang D, Viennois E, Ji K, Damera K, Draganov A, Zheng Y, Dai C, Merlin D, Wang B. Chem Commun. 2014;50:15890. doi: 10.1039/c4cc07748b. [DOI] [PubMed] [Google Scholar]
- 32.Matsubara T, Takahashi K, Ishihara J, Hatakeyama S. Angew Chem, Int Ed. 2014;53:757. doi: 10.1002/anie.201307835. [DOI] [PubMed] [Google Scholar]
- 33.Andrew TL, Cox JR, Swager TM. Org Lett. 2010;12:5302. doi: 10.1021/ol102384k. [DOI] [PubMed] [Google Scholar]
- 34.Melhuish WH. J Phys Chem. 1961;65:229. [Google Scholar]
- 35.Chen W, Wang D, Dai C, Hamelberg D, Wang B. Chem Commun. 2012;48:1736. doi: 10.1039/c2cc16716f. [DOI] [PubMed] [Google Scholar]
- 36.Woscholski R. Signal Transduction. 2006;6:77. [Google Scholar]
- 37.Best MD, Rowland MM, Bostic HE. Acc Chem Res. 2011;44:686. doi: 10.1021/ar200060y. [DOI] [PubMed] [Google Scholar]
- 38.Hang HC, Wilson JP, Charron G. Acc Chem Res. 2011;44:699. doi: 10.1021/ar200063v. [DOI] [PMC free article] [PubMed] [Google Scholar]
- 39.Neef AB, Schultz C. Angew Chem, Int Ed. 2009;48:1498. doi: 10.1002/anie.200805507. [DOI] [PubMed] [Google Scholar]
- 40.Supuran CT. Nat Rev Drug Discovery. 2008;7:168. doi: 10.1038/nrd2467. [DOI] [PubMed] [Google Scholar]
- 41.Yu WT, Wu TW, Huang CL, Chen IC, Tan KT. Chem Sci. 2016;7:301. doi: 10.1039/c5sc02808f. [DOI] [PMC free article] [PubMed] [Google Scholar]
- 42.Schmid M, Nogueira ES, Monnard FW, Ward TR, Meuwly M. Chem Sci. 2012;3:690. [Google Scholar]
- 43.Craig JT, Robins MDW. Aust J Chem. 1968;21:2237. [Google Scholar]
Associated Data
This section collects any data citations, data availability statements, or supplementary materials included in this article.


