

Abstract
Importance
Periodic discharges (PDs) that do not meet seizure criteria, also known as the ictal-interictal continuum (IIC), are pervasive on EEG following acute brain injury. However, their association with brain homeostasis and the need for clinical intervention remain unknown.
Objective
To determine whether distinct PD patterns can be identified that, similar to electrographic seizures, cause brain tissue hypoxia, a measure of ongoing brain injury.
Design, Setting, and Participants
This prospective cohort study included 90 comatose patients with high-grade spontaneous subarachnoid hemorrhage who underwent continuous surface (scalp) EEG (sEEG) recording and multimodality monitoring, including invasive measurements of intracortical (depth) EEG (dEEG), partial pressure of oxygen in interstitial brain tissue (PbtO2) and regional cerebral blood flow (CBF). Patient data were collected from June 1, 2006, to September 1, 2014, at a single tertiary care center. The retrospective analysis was performed from September 1, 2014, to May 1, 2016, with a hypothesis that the effect on brain tissue oxygenation was primarily dependent on the discharge frequency.
Main Outcomes and Measures
Electroencephalographic recordings were visually classified based on PD frequency and spatial distribution of discharges. Correlations between mean multimodality monitoring data and change-point analyses were performed to characterize electrophysiological changes by applying bootstrapping.
Results
Of the 90 patients included in the study (26 men and 64 women; mean [SD] age, 55 [15] years), 32 (36%) had PDs on sEEG and dEEG recordings and 21 (23%) on dEEG recordings only. Frequencies of PDs ranged from 0.5 to 2.5 Hz. Median PbtO2 was 23 mmHg without PDs compared to 16 mm Hg at 2.0 Hz and 14 mm Hg at 2.5 Hz (differences were significant for 0 vs 2.5 Hz based on bootstrapping). Change-point analysis confirmed a temporal association of high-frequency PD onset (≥ 2.0 Hz) and PbtO2 reduction (median normalized PbtO2 decreased by 25% 5–10 min after onset). Increased regional CBF of 21.0 mL/100g/min for 0 Hz, 25.9 mL/100g/min for 1.0 Hz, 27.5 mL/100g/min for 1.5 Hz, and 34.7 mL/100g/min for 2.0 Hz and increased global cerebral perfusion pressure of 91 mm Hg for 0 Hz, 100.5 mm Hg for 0.5 Hz, 95.5 mm Hg for 1.0 Hz, 97.0 mm Hg for 2.0 Hz, 98.0 mm Hg for 2.5 Hz, 95.0 mm Hg for 2.5 Hz, and 67.8 mm Hg for 3.0 Hz were seen for higher PD frequencies.
Conclusion and Relevance
These data give some support to consider redefining the continuum between seizures and PDs, suggesting that additional damage after acute brain injury may be reflected by frequency changes in electrocerebral recordings. Similar to seizures, cerebral blood flow increases in patients with PDs to compensate for the increased metabolic demand but higher-frequency PDs (>2 per second) may be inadequately compensated without an additional rise in CBF and associated with brain tissue hypoxia, or higher-frequency PDs may reflect inadequacies in brain compensatory mechanisms.
Keywords: Periodic discharges, acute brain injury, EEG, multimodality monitoring
INTRODUCTION
With the increasing use of continuous electroencephalography (EEG) in neurologic and nonneurologic intensive care units (ICUs), EEG phenomena of unclear significance are detected more frequently.1–4 Among these phenomena, periodic discharges (PDs) are most common.5 The prevalence of PDs ranges in medical and surgical ICU cohorts from 17% to 29% of comatose patients, even after exclusion of patients with neurological abnormalities.6,7 In neurologic ICUs with more liberal use of continuous EEG, prevalence ranges from 17% to as many as 40% of patients.8–10
Invasive multimodality monitoring (MMM) in comatose patients with spontaneous subarachnoid hemorrhage (SAH) has revealed that electrographic seizures may be associated with a decrease in partial pressure of oxygen in interstitial brain tissue (PbtO2), metabolic crisis, elevation of intracranial pressure, and a delayed increase in regional cerebral blood flow (CBF).11,12 These pathophysiologic changes during seizures are consistent with a large body of work generated across different experimental seizure models.13–15 In humans with acute brain injury, electrographic seizure burden worsens clinical outcomes16,17, which in conjunction with the aforementioned physiologic alterations that occur during seizures provide a rationale for treating electrographic seizures.
In comparison, the physiological changes of the brain during PDs are poorly understood. Whether PDs are associated with unfavorable brain tissue changes such as metabolic crisis with tissue hypoxia remains unclear. In comatose patients with acute brain injuries, PDs have been interpreted as an epiphenomenon18 and a harm-causing complication of acute brain injury.4 In a purely descriptive approach, PDs have been classified as being part of an ictal interictal continuum (IIC), a term that has become widely used.2,19 Uncertainty about the significance and underlying pathophysiological changes associated with PDs is reflected in varying local recommendations, with some centers aggressively administering antiseizure medications in response to PD detection and others favoring a watch-and-wait practice.20,21
Here we test the hypothesis that distinct IIC patterns can be identified and are similar to electrographic seizures in that they cause brain tissue hypoxia and may therefore lead to additional brain injury. We hypothesized that this effect on brain tissue oxygenation was primarily dependent on discharge frequency (higher-frequency discharges causing more metabolic stress that is not compensated for adequately after acute brain injury compared to lower-frequency discharges). In a secondary analysis, we explored the spatial characteristics of discharges (hypothesizing that generalized discharges cause more harm than lateralized ones). To test these hypotheses, we analyzed prospectively collected intracortical (depth) EEG (dEEG) and surface (scalp) EEG (sEEG) recordings with data obtained from MMM (PbtO2 and regional CBF) in patients with high-grade nontraumatic SAH.
METHODS
A more detailed description of the study can be found in eMethods 1 in the Supplement. Data were collected as part of the ongoing prospective SAH Outcomes Project study. All patients with poor-grade (Hunt and Hess grades 4–5; range, 1–5, with higher scores indicating greater disease severity22) SAH patients admitted to the neurologic ICU at Columbia University Medical Center, New York, New York, from June 1, 2006, to September 1, 2014, who underwent invasive MMM following an institutional protocol were included in the study.11,23 Patients underwent invasive brain monitoring when the Glasgow Coma Score was no higher than 8 (range, 3–15, with higher scores indicating greater wakefulness) at ICU admission and when no anticipated improvement of consciousness, clinical deterioration, and/or death was expected for at least 48 hours.11 This study was approved by the institutional review board of Columbia University Medical Center. Patient representatives provided written informed consent.
Multimodality Monitoring
According to a previously described institutional protocol, invasive neuromonitoring includes measurements of intracranial pressure, PbtO2, regional CBF, and dEEG.23,24 Details are available in eMethods 1 of the Supplement and have been published previously.11 The sEEG recordings were obtained according to the international 10–20 electrode system.
General Management
Medical and surgical management followed the guidelines set forth by the American Heart Association.25 Multimodality monitoring followed the guidelines of the Neurocritical Care Society and the European Society of Intensive Care Medicine, as well as local guidelines.22, 26–28 Independent of initial EEG findings, patients were given intravenous phenytoin sodium for 1 week after hemorrhage. Thereafter, antiseizure medication therapy was discontinued unless seizures were detected on sEEG recordings. Isolated seizures detected by sEEG recordings were typically treated with levetiracetam, and status epilepticus was treated with midazolam infusion.29 Periodic discharges were not deemed seizures and not treated with antiseizure medications. However, patients were maintained on an antiseizure medication regimen if PDs occurred during the first 7 days after admission and continued beyond that time, in order to prevent transition to seizure activity. Findings on dEEG recordings did not alter the antiseizure regimen.23
Data Collection
Data collection for the prospective outcomes database and digital physiological data have been described previously.11,30 The data collection process is summarized in the eMethods 1 in the Supplement.
EEG Monitoring and Classification
Continuous EEG recordings were rated after visual inspection by 2 experienced EEG clinicians (J.W. and J.C.) blinded to the clinical course of patients.11 Rating was performed separately for sEEG and dEEG recordings according to published criteria.3 Studies performed after the publication of these criteria have shown excellent interrater agreement regarding seizure detection and satisfactory interrater agreement regarding identification of PDs.31,32 Therefore, in the present study, classification followed agreement between the 2 primary raters, and in cases of disagreement, the final rating was determined by a third clinician (M.R.) who acted as a tiebreaker.
Classification of PDs
Frequencies were chosen ranging from 0 Hz (no PDs) to a maximum of 2.5 Hz. Periodic discharges of 3.0 Hz or higher were considered seizures by convention.3 Examples of coded EEG frequencies are shown (Fig. 1). In cases of PDs at different frequencies, the predominant PD frequency for a given minute was chosen. In addition to PDs, the presence or the absence of seizures was coded for each EEG minute following previously reported methods.11 Periodic discharges on the sEEG were classified according to criteria set forth by the American Clinical Neurophysiology Society Standardized Critical Care EEG Terminology3,31, using the main terms generalized, lateralized, and bilateral independent. Accordingly, for each EEG minute that contained PDs, we code these as unilateral left- or right- sided PDs; bilateral independent and generalized PDs after visual inspection. Unilaterality was defined as unilateral or bilateral synchronous (but predominantly unilateral) PDs in focal, regional and hemispheric distribution. Bilateral independent PDs included 2 or more independent and bilaterally present PD patterns in focal, regional or hemispheric distribution. In our study, bilateral independent PDs also included multifocal bilateral asynchronous patterns. Generalized PDs were defined as bilateral, bisynchronous, and symmetric patterns, even when occurring in a restricted field (e.g. bifrontal). Triphasic waves were categorized as generalized discharges.3
Figure 1. Four examples of periodic discharge frequencies on dEEG in four patients.
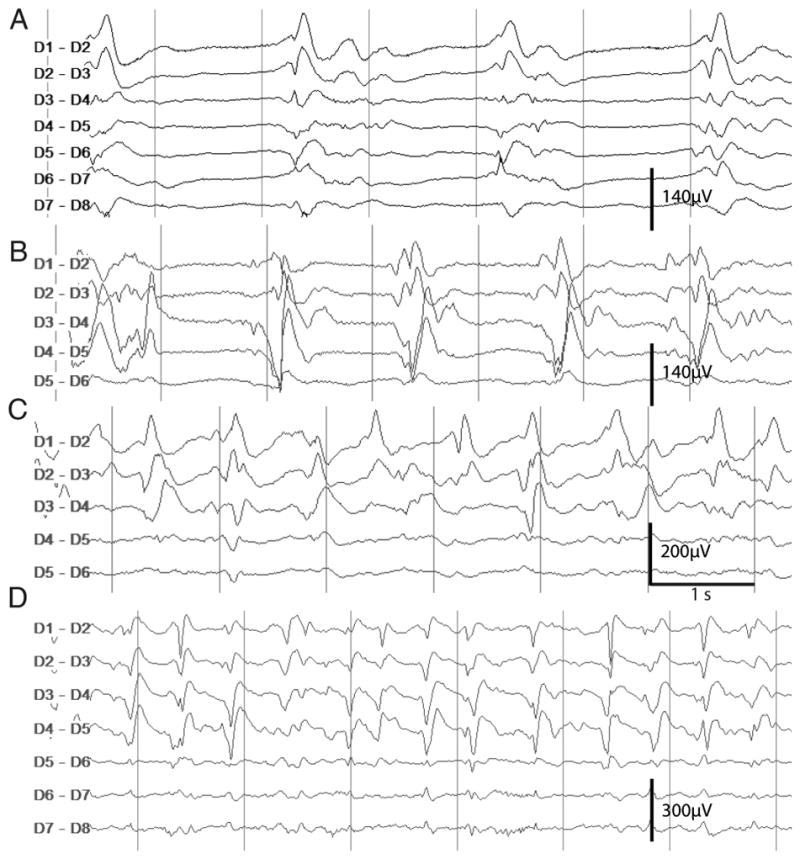
The final coded PD frequency was determined according to the predominant frequency considering the entire minute PDs were contained in. The segments shown here exhibit PD-frequencies of approximately 0.5 Hz (A), 1 Hz (B), 1.5 Hz (C), 2.5 Hz (D). PDs shown in B, C, and D had no consistent correlate on sEEG. Abbreviations: dEEG, Depth/Intracortical EEG; sEEG, Surface/Scalp EEG; PD, Periodic Discharge; Hz, Hertz
Data preparation
Data preparation and all analyses were performed using R software (version 3.0.2; R Project). For each of the physiological measures, we defined a filter to remove the most common artifacts, based on clinical knowledge about their onset, time course, and morphologic features. Details on the data filtering process and an example are available in eFigure 1 in the Supplement.
Statistical Analysis
Data were analyzed from September 1, 2014, to May 1, 2016. Data are represented as frequencies, median (interquartile range), or means (SD). Differences between patient groups were tested using the Mann-Whitney test or the Chi-Square test, as appropriate. P<0.05 was set as the threshold of statistical significance using a 2-tailed t test. All other statistical analyses were performed using nonparametric bootstrapping, which sampled the median 500 times with replacement, as implemented in the R package “boot”. We determined the 2.5% to 97.5% CI for conditions of interest and classified the difference between 2 conditions as significant if their CIs were nonoverlapping.33 To examine the association of PD frequencies and physiological variables, we chose the 0-Hz condition as a reference. For the purposes of the change point analysis, we chose the time from 10 and 5 minutes preceding the PD frequency change as the baseline.
RESULTS
Cohort
During the study period, 666 patients with spontaneous SAH were admitted to Columbia University Medical Center, 204 of whom had a Glasgow Coma Score on admission of 8 or lower and were potential candidates. Among these, 90 patients were included in the study (26 men and 64 women; mean [SD] age, 55 [15] years) (Table 1), and 114 were excluded, most frequently for anticipated improvement of the Glasgow Coma Score or death within 48 hours. Additional characteristics of the study cohort are described in eMethods 2 in the Supplement. Baseline characteristics of patients included and excluded in the present study were overall comparable (eTable in the Supplement).
Table 1.
Patient characteristics of 90 poor grade SAH patients with multimodality monitoring including continuous EEG
|
Demographics mean (SD) or n (%) |
Age | Female n (%) | Caucasian | |
|---|---|---|---|---|
| 55 +−15 | 64 (71) | 27 (30) | ||
|
Admission Scores median (IQR) or mean (SD) |
Admission Hunt&Hess |
APACHE II Score |
SAH Sum Score | IVH Sum Score |
| 4 [4–5] | 22 +− 7 | 19 +− 10 | 4 +− 4 | |
| Global Cerebral Edema | 43 (46) | |||
|
Aneurysm Treatment n (%) |
Aneurysm Clipping | Aneurysm Coiling | ||
| 53 (60) | 24 (28) | |||
|
Hospital Course n (%) or median (IQR) |
Delayed Cerebral Ischemia |
Worst Hunt&Hess score within first 24 hours of SAH | ||
| 49 (59) | 5 [4–5] | |||
| Functional Outcome at 3 months median (IQR) or n (%) | Modified Rankin | Dead or severely disabled | ||
| 5 [3–6] | 56 (62) | |||
SAH Spontaneous subarachnoid hemorrhage
IVH Intraventricular hemorrhage
Data Collection
Seventy-two patients (80%) had sEEG and dEEG recordings; the remaining 18 patients (20%) had sEEG recordings only. The mean (SD) EEG time per patient was 104 (69) hours. Of the 90 patients included in the study, 53 (59%) had PDs on sEEG or dEEG recordings or both. Twenty-one patients (23%) had PDs visible on only dEEG recordings and 32 (36%) had PDs visible on sEEG recordings. Twenty-one patients (23%) had generalized PDs; 21 (23%), right-sided PDs; 15 (17%), left-sided PDs; and 9 (10%), bilateral PDs. Twenty-two patients (24%) had more than 1 type of surface PD (e.g. generalized and lateralized PDs). Twenty-nine patients (32%) had lateralized PDs occurring only on 1 side throughout the recording (e.g., only left-sided, never right-sided). Twenty-eight patients (31%) had seizures, which were only visible on dEEG recordings in 19 (68%). All but 1 patient with seizures on the sEEG and/or dEEG recordings also had PDs on sEEG and/or dEEG recordings.
PD Frequency and MMM Variables
The mean duration of single PD episodes in patients who had PDs on dEEG recordings were 1110 minutes for a frequency of 0 Hz, 51 minutes for 0.5 Hz, 14 minutes for 1.0 Hz, 24 minutes for 1.5 Hz, 23 minutes for 2.0 Hz, 10 minutes for 2.5 Hz, and 18 minutes for 3.0 Hz. In patients who had PDs on dEEG recordings, the mean (SD) number of changes between frequencies per hour across patients was 0.73 (1.20). Probabilities of transition from one frequency to another are shown in eFigure 2 in the Supplement. Changes in PD frequencies generally are small (0.5 and 1.0 Hz), but large changes can occur when PD runs stop. For example, the probability of going from a frequency of 3.0 Hz to 0 Hz is about 0.4 (lowest entry on the left column in eFigure 2 in the Supplement).
Frequencies of PDs on dEEG recordings were correlated with the MMM variables (Fig. 2). This analysis was conducted with and without episodes that also fulfilled seizure criteria, which yielded comparable results. Median PbtO2 (Fig. 2A) was significantly lower at 14.4 mm Hg for a PD frequency of 2.5 Hz and 14.7 mm Hg for a PD frequency of 3.0 Hz when compared with PbtO2 at 0 Hz (23.4 mm Hg). Median regional CBF values (Fig. 2B) were higher at 25.9 mL/100g/min for a PD frequency of 1.0 Hz, 27.5 mL/100g/min for a PD frequency of 1.5 Hz, and 34.7 mL/100g/min for a PD frequency of 2.0 Hz when compared with median regional CBF of 21.0 mL/100g/min for a PD frequency of 0 Hz, but this difference was not statistically significant. No patient had higher-frequency PDs (>2.0 Hz) and simultaneous regional CBF measurements. Median cerebral perfusion pressure was increased at frequencies higher than 0 Hz and reduced at 3.0 Hz (Fig. 2C), but neither the initial increase nor the drop at 3.0 Hz reached statistical significance. Intracranial pressure did not appear to systematically change at 9.6 mm Hg for a PD frequency of 0 Hz, 8.6 mm Hg for a PD frequency of 0.5 Hz, 8.4 mm Hg for a PD frequency of 1.0 Hz, 9.0 mm Hg for a PD frequency of 1.5 Hz, 7.8 mm Hg for a PD frequency of 2.0 Hz, 9.3 mm Hg for a PD frequency of 2.5 Hz, and 10.5 mm Hg for a PD frequency of 3.0 Hz.
Figure 2. Frequency of periodic discharges (PDs) on dEEG and multimodality monitoring parameters.

A, Brain oxygen, B-C, Local and global cerebral blood flow, D, Intracranial Pressure. Frequency of 0 corresponds to absence of PDs. Values represent medians with interquartile ranges (25–75). Significant differences to respective values at 0 Hz revealed by bootstrapping (500 repetitions) are marked with an asterisk. Abbreviations: dEEG, Depth/Intracortical EEG; PbtO2, Interstitial Partial Brain Oxygen Tension; rCBF, Regional Cerebral Blood Flow; CPP, Cerebral Perfusion Pressure; ICP, Intracranial Pressure
Brain oxygen at PD-Frequency Change Points
Next we investigated whether the reduction of PbtO2 at a PD frequency of at least 2.0 Hz (high-frequency periodic discharges on dEEG) could be retraced in the time window surrounding high-frequency PD onset. For this purpose, we included in the analysis all patients with high-frequency PDs and plotted PbtO2 time courses starting 10 minutes before until 15 minutes after onset of high frequency PDs (Fig. 3).11 High frequency PD onsets, that were preceded by a lower PD frequency were included if the change in frequency was 1.0 Hz or greater (e.g. increase from 1.5 to 2.5 Hz, but not from 1.5 to 2.0 Hz). We found that PbtO2 values began to decrease approximately 5 minutes before the onset of high-frequency PDs. Bootstrapping revealed significant reductions of PbtO2 in the 5- to 10-minute window after high-frequency PD onset compared to PbtO2 5 to 10 minutes before the episodes.
Figure 3. Interstitial brain oxygen (PbtO2) at the onset of high frequency periodic discharges (≥2.0 Hz).
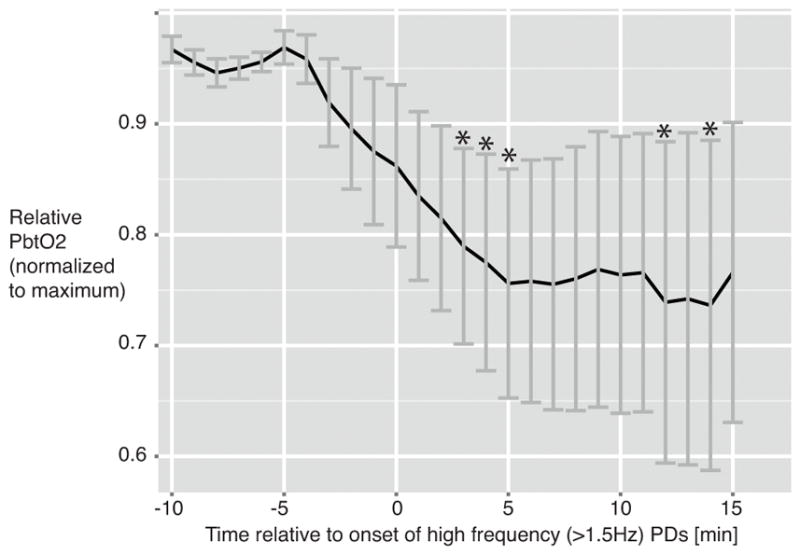
Episodes: n= 27 in n= 8 patients. PbtO2 normalized to maximum. Significant differences of respective time points in comparison with PbtO2 at 5–10 min before high frequency PD onset revealed by bootstrapping (500 repetitions) are marked with an asterisk.
PbtO2 and Distribution of PDs on sEEG
Regardless of anatomical distribution, PbtO2 was lower at high PD frequencies (Fig. 4A). To explore the association of anatomical localization of PDs on sEEG and PbtO2 values, we combined lateralized (right- and left-sided) PDs and generalized and bilateral PD distributions, respectively (Fig. 4B and C). Low-frequency (0.5–1.5 Hz) generalized PDs had lower PbtO2 when compared with low-frequency LPDs. No apparent PbtO2 difference was found between high-frequency (≥2.0Hz) lateralized PDs and high-frequency generalized PDs.
Figure 4. Interstitial brain oxygen tension in relation to surface EEG periodic discharges.

A, PbtO2 in relation to all PDs on sEEG categorized according to discharge frequency. B, PbtO2 in relation to low frequency PDs (0.5–1.5 Hz) categorized according to lateralized (right or left) and generalized PD distribution on sEEG. Lateralized PDs: n= 14 patients, generalized PDs: n=9 patients. C, PbtO2 in relation to high frequency PDs (2.0–2.5 Hz) categorized according to lateralized (right or left) and generalized PD distribution on sEEG. Laterlized PDs: n= 5 patients, Generalized PDs: n=5 patients. Abbreviations: PbtO2, Interstitial brain oxygen; sEEG, Scalp/surface EEG; PDs, Periodic Discharges
DISCUSSION
This study is the first, to our knowledge, in humans to anchor PDs in a framework of real-time brain physiologal changes using sEEG and dEEG recordings in combination with invasive monitoring of PbtO2 and regional CBF. By analyzing a large annotated EEG data set, the present study establishes the discharge frequency as the fundamental characteristic that allows discrimination between potentially harmful and likely benign PDs. Our findings suggest a PD frequency range of compensated brain metabolism where elevated CBF sufficiently matches the increased oxygen demand (0.5–2 Hz) and a higher PD frequency range (>2.0 Hz) of metabolic decompensation where brain oxygen levels decrease, indicating tissue hypoxia. Brain physiological changes above this decompensation threshold resemble those seen in seizures, with the clinical implication that high-frequency PDs after acute brain injury may be interpreted and managed as seizures.
Findings on dEEG Recordings
The hypothesis of a decompensation threshold is supported by 2 findings. First, brain tissue oxygen levels decrease at high PD frequencies with a critical threshold of greater than 2 per second. Second, local CBF and cerebral perfusion pressure as an indicator of global brain perfusion increase with all PDs but do not increase further with frequencies above 2.0 Hz, suggesting a compensatory perfusion response with a limit.
We found a close temporal association between the onset of high-frequency PDs and the reduction of PbtO2. This finding suggests a possible causal association between high-frequency PDs and interstitial brain oxygen reduction. Interestingly, we found a decrease in brain tissue oxygenation preceding PD frequency changes that, although statistically nonsignificant, raises the possibility that the electrographic changes could be reflecting rather than causing metabolic breakdown. A conceivable scenario is that brief episodes of hypoxia trigger PDs, which in turn perpetuate a hypermetabolic state and thus hypoxia, resulting in a vicious cycle between hypoxia and PDs. However, the electrographic changes may be purely secondary, with further investigation needed to determine whether they cause additional hypermetabolic and hypoxic changes.
Certainly, whether PDs are the cause or the effect of tissue hypoxia cannot be sufficiently addressed using this exploratory study design. The alterations of brain tissue physiological changes seen with the onset of high-frequency PDs, including the oxygen decrease that precedes high-frequency PDs, are congruent with the physiologic changes seen in electrographic seizures.11 During seizures, tissue deoxygenation is common, may precede the onset of spontaneous seizure activity, and is often reversible after cessation of seizures 34–37. However, seizures –unlike PDs – have more convincingly been shown to worsen clinical outcome16,17, which provides a rationale to treat seizures, although the underlying pathophysiological changes may not be completely understood. Whether treatment of high-frequency PDs is beneficial remains speculative at this point, and indeed controversy remains regarding whether and how to treat EEG seizure patterns in this setting. Future interventional trials targeting high-frequency PDs or interventions aimed at underlying conditions leading to PDs may advance our understanding further.38–39 Based on our study results alone, we are not in a position to recommend changing treatment of PDs. Our study may rather suggest that the injury potential of high-frequency PDs should be investigated and possibly be a target for clinical trials investigating the benefits of treatment. With respect to terminology, the physiological resemblance of high-frequency PDs and seizures provides some support to consider recategorization of some of the patterns within the IIC based on PD frequency. Notably, in the present study, we were careful to exclude not only classic seizures but also very high-frequency PDs (3 per second or more) because these have been categorized as seizures previously.1,3 Including these patterns in the analysis only strengthened the observations.
Our study does not establish whether PDs influence clinical outcome. However, because PDs are very common EEG phenomena in acute brain injury, we need to clarify their physiological significance before embarking on large randomized controlled trials on PDs or electrographic seizures. We must know whether certain types of PDs have to be regarded as seizures. Failure to correctly differentiate between benign and malignant EEG patterns is bound to confound study results and may lead to type II errors.
Findings on sEEG Recordings
Findings on sEEG were consistent with the findings on dEEG recordings; however, they largely remained descriptive and statistically nonsignificant. The lack of statistical power likely reflects the relatively lower prevalence of PDs, and in particular fewer high-frequency PDs, detected with sEEG recordings in comparison with dEEG recordings. Although virtually all patients with PDs on sEEG recordings had a correlate on dEEG recordings, almost one-quarter of patients with PDs on dEEG recordings had no correlate on sEEG recordings. This lack of power forced us to use a lower frequency cutoff to qualify for high-frequency PDs (>1.5 Hz). Again, lower PbtO2 was seen with higher-frequency PDs compared with lower frequencies. Low-frequency PDs were only associated with brain tissue hypoxia when discharges were generalized, whereas PbtO2 drops were seen for generalized and lateralized PDs at higher frequencies. These sEEG data suggest that the damaging effect of PDs may be based on an interaction between the frequency and spatial distribution of the discharges. However, these preliminary surface EEG observations need to be replicated in a larger data set. Statistically robust reproduction of our dEEG results using sEEG data would be particularly interesting from a clinical standpoint, because centers increasingly have access to sEEG, whereas the use of dEEG remains limited to few highly specialized centers.
Triphasic waves were categorized as generalized PDs according to recent guidelines, which may have systematically influenced our analysis on sEEG PDs.3 However, in our data set, we did not observe any triphasic waves at frequencies of greater than 2.0 Hz, and the ones at a frequency of 2.0 Hz were rare.
Our study results do not clearly demonstrate a role for sEEG recordings in the detection of PDs. Regarding feasibility and safety, generating more sEEG data in various patient populations will be nonproblematic. Depth EEG recordings on the other hand, despite having a similar safety profile as other MMM techniques, will likely remain restricted to patients with severe neurological illness in whom the risk-benefit ratio of intracortical electrode insertion is ethically justifiable.40
Pathophysiologic Changes Associated with PDs
Although association studies in critically ill patients have linked the occurrence of PDs to the occurrence of nonconvulsive seizures and status epilepticus41,42 as well as increased mortality and worse functional outcome,43,44 few studies explored pathophysiological changes associated with PDs. Differences in the PD patterns studied and varying definitions may explain some of the inconsistencies of the reported findings. For these reasons, we strictly adhered to the research terminology as defined by the American Clinical Neurophysiology Society that is not only widely used for research but is increasingly used for clinical purposes.3 A recent case series suggests that brain tissue hypermetabolism may be seen on positron emission tomography scanning in patients with IIC.45 Magnetic resonance imaging studies have revealed vasogenic and cytotoxic edema in some patients with PDs that are similar to those seen in patients with seizures.46 Functional magnetic resonance imaging in patients with idiopathic generalized epilepsy has revealed increased CBF associated with elevated cerebral metabolic rate of oxygen consumption during interictal epileptiform discharges.47 In contrast, case reports on stimulus-induced rhythmic, periodic, or ictal discharges48,49 suggest that this subtype of IIC may not be associated with an increase in regional CBF as visualized by single-photon emission computer tomography. A recent study by Vespa and coworkers12 reported metabolic crises on intraparenchymal microdialysis at times of electrographic seizures after traumatic brain injury. Their report included some patients with PDs as an ictal pattern, but did not include a separate analysis focusing on PDs alone.
Limitations
We studied patients with SAH who had a high burden of brain injury and were selected to undergo invasive brain monitoring, which may reflect on the generalizability of the results. A selection bias analysis among patients with high-grade SAH was conducted and revealed no major differences between patients selected to undergo MMM compared with those who were eligible but not selected.
The fact that all cohort patients were gravely ill and limited in number entailed that analyses investigating associations between PDs and clinical outcomes were bound to lack statistical power. At 3 months of follow-up, 36 of our patients (40%) were dead and 20 (22%) had a modified Rankin Scale score of 5 (range, 0 [no symptoms] to 6 [death]). A comparison between patients with unfavorable (modified Rankin Scale score, 4–6) and favorable (modified Rankin Scale score, 0–3) outcomes showed only a significant difference in admission Hunt and Hess scores between both groups, but did not show differences in other well-established predictors of outcome in patients with SAH (i.e. Acute Physiology and Chronic Health Evaluation II score, aneurysmal rebleeding, patient age) or in the prevalence of high-frequency PDs, which illustrates the lack of statistical power. Future studies are needed to test whether high-frequency PDs influence clinical outcomes and whether interventions targeting high-frequency PDs may improve outcomes.
An inherent limitation of most research in human participants, in contrast to research in animal models, is that injury patterns are not standardized and that experimental conditions are poorly controlled. In particular, the interaction between high-frequency PDs and hypoxia may become more conclusive if studied in animal models. Causality can also be explored using causal inference methods, but are challenging to explore in datasets with low-frequency events such as transitions between low- and high- frequency PDs.50
The difficulties of standardized PD detection and classification by visual diagnosis have been pointed out previously.31,33 The length of EEG recordings in our cohort varied depending on clinical necessity, and 20% of our cohort did not undergo dEEG recordings. Furthermore, brain-blood flow measures are technically challenging, leading to limited regional CBF data with many recording breaks. This situation is reflected in the fact that no simultaneous regional CBF recordings and high-frequency PDs were available in our data set. Moreover, we did not include information on medication data, which may affect EEG patterns. At our institution, patients with high-grade SAH routinely receive intravenous phenytoin during the first week after admission, which is not standard at other institutions. Generalizations to other acute brain injuries such as traumatic brain injury should be made with caution as pathophysiological background changes associated with this primary injury may determine the interaction between PDs and the measured brain physiology. The fact that findings on dEEG recordings could not clearly be reproduced using sEEG recordings impedes the immediate clinical applicability of our study results since most centers do not routinely use intracortical EEG technology.
Despite these limitations, our study provides a starting point for prospective trials in which potential confounders can be controlled.
Conclusions
Our study suggests that PDs, which largely constitute EEG patterns of unclear significance, are associated with frequency-dependent changes of the underlying brain tissue physiology in patients with acute brain injury. We describe a frequency threshold above which physiological changes resemble those seen during electrographic seizures, such as increased regional CBF and decreased brain tissue oxygenation. This finding redefines the distinction between seizures and PDs. Our study provides a rationale to conduct prospective interventional trials to test the hypotheses that patients with PD frequencies of more than 2 per second benefit from antiseizure medication and that low-frequency PDs may not exert harmful effects on brain tissue.
Supplementary Material
Acknowledgments
We thank the patients and relatives for their willingness to participate in our research study.
FUNDING/SUPPORT
This publication was supported by the Deutsche Forschungsgemeinschaft (Research Fellowship Wi 4300/1-1, J.W.), the DANA foundation (JC, JMS), the NLM of the NIH under Award Number R01LM011826 (JC), and NIH grant K01 ES026833 (SP). The content is solely the responsibility of the authors and does not necessarily represent the official views of the NIH.
Footnotes
CONFLICT OF INTEREST DISCLOSURES
Dr. Claassen reported receiving honoraria from serving on the Advisory Board of Actelion for study development.
AUTHOR CONTRIBUTIONS
Drs. Witsch and Claassen had full access to all the data in the study and take responsibility for the integrity of the data and the accuracy of the data analysis.
Study concept and design: Witsch, Frey, Claassen
Acquisition, analysis, or interpretation of data: All authors
Drafting of the manuscript: Witsch, Frey, Claassen
Critical revision of the manuscript for important intellectual content: Witsch, Frey, Schmidt, Roh, Reznik, Connolly, Claassen
Statistical analysis: Frey, Witsch, Schmidt, Claassen
Administrative, technical, or material support: Velazquez, Falo
Study supervision: Claassen
ROLE OF THE FUNDERS
The funding sources had no role in the design and conduct of the study; collection, management, analysis, or interpretation of the data; preparation, review, or approval of the manuscript; and decision to submit the manuscript for publication.
References
- 1.Beniczky S, Hirsch LJ, Kaplan PW, et al. Unified EEG terminology and criteria for nonconvulsive status epilepticus. Epilepsia. 2013;54(SUPPL 6):28–29. doi: 10.1111/epi.12270.. [DOI] [PubMed] [Google Scholar]
- 2.Chong DJ, Hirsch LJ. Which EEG patterns warrant treatment in the critically ill? Reviewing the evidence for treatment of periodic epileptiform discharges and related patterns. J Clin Neurophysiol. 2005;22(2):79–91. doi: 10.1097/01.wnp.0000158699.78529.af. [DOI] [PubMed] [Google Scholar]
- 3.Hirsch LJ, LaRoche SM, Gaspard N, et al. American Clinical Neurophysiology Society’s Standardized Critical Care EEG Terminology: 2012 version. J Clin Neurophysiol. 2013;30(1):1–27. doi: 10.1097/WNP.0b013e3182784729. [DOI] [PubMed] [Google Scholar]
- 4.Bauer G, Trinka E. Nonconvulsive status epilepticus and coma. Epilepsia. 2010;51(2):177–190. doi: 10.1111/j.1528-1167.2009.02297.x. [DOI] [PubMed] [Google Scholar]
- 5.García-Morales I, García MT, Galán-Dávila L, et al. Periodic lateralized epileptiform discharges: etiology, clinical aspects, seizures, and evolution in 130 patients. J Clin Neurophysiol. 2002;19:172–177. doi: 10.1177/0961203309351539. [DOI] [PubMed] [Google Scholar]
- 6.Oddo M, Carrera E, Claassen J, Mayer SA, Hirsch LJ. Continuous electroencephalography in the medical intensive care unit*. 2009;37(6) doi: 10.1097/CCM.0b013e3181a00604.. [DOI] [PubMed] [Google Scholar]
- 7.Kurtz P, Gaspard N, Wahl AS, et al. Continuous electroencephalography in a surgical intensive care unit. Intensive Care Med. 2014;40(2):228–34. doi: 10.1007/s00134-013-3149-8. [DOI] [PubMed] [Google Scholar]
- 8.Claassen J, Jetté N, Chum F, et al. Electrographic seizures and periodic discharges after intracerebral hemorrhage. Neurology. 2007;69(13):1356–65. doi: 10.1212/01.wnl.0000281664.02615.6c. [DOI] [PubMed] [Google Scholar]
- 9.Claassen J, Mayer SA, Hirsch LJ. Continuous EEG monitoring in patients with subarachnoid hemorrhage. J Clin Neurophysiol. 2005;22:92–98. doi: 10.1097/01.wnp.0000145006.02048.3a. [DOI] [PubMed] [Google Scholar]
- 10.Carrera E, Claassen J, Oddo M, Emerson RG, Mayer SA, Hirsch LJ. Continuous electroencephalographic monitoring in critically ill patients with central nervous system infections. Arch Neurol. 2008;65:1612–1618. doi: 10.1001/archneur.65.12.1612. 65/12/1612 [pii]\n. [DOI] [PubMed] [Google Scholar]
- 11.Claassen J, Perotte A, Albers D, et al. Nonconvulsive seizures after subarachnoid hemorrhage: Multimodal detection and outcomes. Ann Neurol. 2013;74(1):53–64. doi: 10.1002/ana.23859. [DOI] [PMC free article] [PubMed] [Google Scholar]
- 12.Vespa P, Tubi M, Claassen J, et al. Metabolic Crisis occurs with Seizures and Periodic Discharges after Brain Trauma. Ann Neurol. 2016 doi: 10.1002/ana.24606.. [DOI] [PubMed]
- 13.Meldrum BS, Nilsson B. Cerebral blood flow and metabolic rate early and late in prolonged epileptic seizures induced in rats by bicuculline. Brain. 1976;99(3):523–42. doi: 10.1093/brain/99.3.523. [DOI] [PubMed] [Google Scholar]
- 14.Suzuki R, Nitsch C, Fujiwara K, Klatzo I. Regional changes in cerebral blood flow and blood-brain barrier permeability during epileptiform seizures and in acute hypertension in rabbits. J Cereb Blood Flow Metab. 1984;4(1):96–102. doi: 10.1038/jcbfm.1984.12. [DOI] [PubMed] [Google Scholar]
- 15.Freund TF, Buzsáki G, Prohaska OJ, Leon A, Somogyi P. Simultaneous recording of local electrical activity, partial oxygen tension and temperature in the rat hippocampus with a chamber-type microelectrode. Effects of anaesthesia, ischemia and epilepsy. Neuroscience. 1989;28(3):539–49. doi: 10.1016/0306-4522(89)90003-1. [DOI] [PubMed] [Google Scholar]
- 16.De Marchis GM, Pugin D, Meyers E, et al. Seizure burden in subarachnoid hemorrhage associated with functional and cognitive outcome. Neurology. 2016;86(3):253–60. doi: 10.1212/WNL.0000000000002281. [DOI] [PMC free article] [PubMed] [Google Scholar]
- 17.Payne ET, Zhao XY, Frndova H, et al. Seizure burden is independently associated with short term outcome in critically ill children. Brain. 2014;137(Pt 5):1429–38. doi: 10.1093/brain/awu042. [DOI] [PMC free article] [PubMed] [Google Scholar]
- 18.Sutter R, Semmlack S, Kaplan PW. Nonconvulsive status epilepticus in adults - insights into the invisible. Nat Rev Neurol. 2016;12(5):281–93. doi: 10.1038/nrneurol.2016.45. [DOI] [PubMed] [Google Scholar]
- 19.Pohlmann-Eden B, Hoch DB, Cochius JI, Chiappa KH. Periodic lateralized epileptiform discharges---a critical review. J Clin Invest. 1996;13(6):519–530. doi: 10.1097/00004691-199611000-00007. [DOI] [PubMed] [Google Scholar]
- 20.Sivaraju A, Gilmore EJ. Understanding and Managing the Ictal-Interictal Continuum in Neurocritical Care. Curr Treat Options Neurol. 2016;18(2):1–13. doi: 10.1007/s11940-015-0391-0. [DOI] [PubMed] [Google Scholar]
- 21.van Putten MJAM, Hofmeijer J. Generalized periodic discharges: Pathophysiology and clinical considerations. Epilepsy Behav. 2015;49:228–33. doi: 10.1016/j.yebeh.2015.04.007. [DOI] [PubMed] [Google Scholar]
- 22.Hunt WE, Hess RM. Surgical risk as related to time of intervention in the repair of intracranial aneurysms. J Neurosurg. 1968;28(1):14–20. doi: 10.3171/jns.1968.28.1.0014. [DOI] [PubMed] [Google Scholar]
- 23.Waziri A, Claassen J, Stuart RM, et al. Intracortical electroencephalography in acute brain injury. Ann Neurol. 2009;66(3):366–77. doi: 10.1002/ana.21721. [DOI] [PubMed] [Google Scholar]
- 24.Mikell CB, Dyster TG, Claassen J. Invasive seizure monitoring in the critically-Ill brain injury patient: Current practices and a review of the literature. Seizure. 2016 doi: 10.1016/j.seizure.2016.05.017.. [DOI] [PMC free article] [PubMed] [Google Scholar]
- 25.Connolly ES, Rabinstein AA, Carhuapoma JR, et al. Guidelines for the management of aneurysmal subarachnoid hemorrhage: A guideline for healthcare professionals from the american heart association/american stroke association. Stroke. 2012;43:1711–1737. doi: 10.1161/STR.0b013e3182587839. [DOI] [PubMed] [Google Scholar]
- 26.Le Roux P, Menon DK, Citerio G, et al. Consensus summary statement of the International Multidisciplinary Consensus Conference on Multimodality Monitoring in Neurocritical Care: a statement for healthcare professionals from the Neurocritical Care Society and the European Society of Intensive C. Neurocrit Care. 2014;21(Suppl 2):S1–26. doi: 10.1007/s12028-014-0041-5. [DOI] [PMC free article] [PubMed] [Google Scholar]
- 27.Le Roux P, Menon DK, Citerio G, et al. Consensus summary statement of the International Multidisciplinary Consensus Conference on Multimodality Monitoring in Neurocritical Care: a statement for healthcare professionals from the Neurocritical Care Society and the European Society of Intensive. Intensive Care Med. 2014;40(9):1189–209. doi: 10.1007/s00134-014-3369-6. [DOI] [PubMed] [Google Scholar]
- 28.Komotar RJ, Schmidt M, Starke RM, et al. Resuscitation and critical care of poor-grade subarachnoid hemorrhage. In. Neurosurgery. 2009;64:397–410. doi: 10.1227/01.NEU.0000338946.42939.C7.. [DOI] [PubMed] [Google Scholar]
- 29.Fernandez A, Lantigua H, Lesch C, et al. High-dose midazolam infusion for refractory status epilepticus. Neurology. 2014;82(4):359–65. doi: 10.1212/WNL.0000000000000054. [DOI] [PMC free article] [PubMed] [Google Scholar]
- 30.Witsch J, Frey H-P, Patel S, et al. Prognostication of long-term outcomes after subarachnoid hemorrhage: The FRESH-score. Ann Neurol. 2016 doi: 10.1002/ana.24675.. [DOI] [PubMed] [Google Scholar]
- 31.Gaspard N, Hirsch LJ, LaRoche SM, Hahn CD, Westover MB. Interrater agreement for Critical Care EEG Terminology. Epilepsia. 2014;55(9):1366–73. doi: 10.1111/epi.12653. [DOI] [PMC free article] [PubMed] [Google Scholar]
- 32.Halford JJ, Shiau D, Desrochers JA, et al. Inter-rater agreement on identification of electrographic seizures and periodic discharges in ICU EEG recordings. Clin Neurophysiol. 2014 doi: 10.1016/j.clinph.2014.11.008.. [DOI] [PMC free article] [PubMed] [Google Scholar]
- 33.Mikell CB, Banks GP, Frey H-P, et al. Frontal networks associated with command following after hemorrhagic stroke. Stroke. 2015;46(1):49–57. doi: 10.1161/STROKEAHA.114.007645. [DOI] [PubMed] [Google Scholar]
- 34.Bahar S, Suh M, Zhao M, Schwartz TH. Intrinsic optical signal imaging of neocortical seizures: the “epileptic dip”. Neuroreport. 2006;17(5):499–503. doi: 10.1097/01.wnr.0000209010.78599.f5. [DOI] [PubMed] [Google Scholar]
- 35.Gonzalez H, Hunter CJ, Bennet L, Power GG, Gunn AJ. Cerebral oxygenation during postasphyxial seizures in near-term fetal sheep. J Cereb Blood Flow Metab. 2005;25(7):911–8. doi: 10.1038/sj.jcbfm.9600087. [DOI] [PubMed] [Google Scholar]
- 36.Zhao M, Suh M, Ma H, Perry C, Geneslaw A, Schwartz TH. Focal increases in perfusion and decreases in hemoglobin oxygenation precede seizure onset in spontaneous human epilepsy. Epilepsia. 2007;48(11):2059–2067. doi: 10.1111/j.1528-1167.2007.01229.x. [DOI] [PubMed] [Google Scholar]
- 37.Ingram J, Zhang C, Cressman JR, et al. Oxygen and seizure dynamics: I. Experiments. J Neurophysiol. 2014;112(2):205–12. doi: 10.1152/jn.00540.2013. [DOI] [PMC free article] [PubMed] [Google Scholar]
- 38.Browning M, Shear DA, Bramlett HM, et al. Levetiracetam Treatment in Traumatic Brain Injury: Operation Brain Trauma Therapy. J Neurotrauma. 2016;33(6):581–594. doi: 10.1089/neu.2015.4131. [DOI] [PubMed] [Google Scholar]
- 39.Claassen J, Albers D, Schmidt JM, et al. Nonconvulsive seizures in subarachnoid hemorrhage link inflammation and outcome. Ann Neurol. 2014;75:771–781. doi: 10.1002/ana.24166. [DOI] [PMC free article] [PubMed] [Google Scholar]
- 40.Stuart RM, Schmidt M, Kurtz P, et al. Intracranial multimodal monitoring for acute brain injury: a single institution review of current practices. Neurocrit Care. 2010;12(2):188–98. doi: 10.1007/s12028-010-9330-9. [DOI] [PubMed] [Google Scholar]
- 41.Foreman B, Claassen J, Khaled KA, et al. Generalized periodic discharges in the critically ill: A case-control study of 200 patients. Neurology. 2012;79:1951–1960. doi: 10.1212/WNL.0b013e3182735cd7. [DOI] [PMC free article] [PubMed] [Google Scholar]
- 42.Braksick SA, Burkholder DB, Tsetsou S, et al. Associated Factors and Prognostic Implications of Stimulus-Induced Rhythmic, Periodic, or Ictal Discharges. JAMA Neurol. 2016;73(5):585–590. doi: 10.1001/jamaneurol.2016.0006. [DOI] [PubMed] [Google Scholar]
- 43.Orta DSJ, Chiappa KH, Quiroz AZ, Costello DJ, Cole AJ. Prognostic implications of periodic epileptiform discharges. Arch Neurol. 2009;66:985–991. doi: 10.1001/archneurol.2009.137. [DOI] [PubMed] [Google Scholar]
- 44.Sainju RK, Manganas LN, Gilmore EJ, et al. Clinical Correlates and Prognostic Significance of Lateralized Periodic Discharges in Patients Without Acute or Progressive Brain Injury: A Case-Control Study. J Clin Neurophysiol. 2015;32(6):495–500. doi: 10.1097/WNP.0000000000000206. [DOI] [PubMed] [Google Scholar]
- 45.Struck AF, Westover MB, Hall LT, Deck GM, Cole AJ, Rosenthal ES. Metabolic Correlates of the Ictal-Interictal Continuum: FDG-PET During Continuous EEG. Neurocrit Care. 2016;24(3):324–31. doi: 10.1007/s12028-016-0245-y. [DOI] [PMC free article] [PubMed] [Google Scholar]
- 46.Canas N, Breia P, Soares P, et al. The electroclinical-imagiological spectrum and long-term outcome of transient periictal MRI abnormalities. Epilepsy Res. 2010;91(2–3):240–52. doi: 10.1016/j.eplepsyres.2010.07.019. [DOI] [PubMed] [Google Scholar]
- 47.Stefanovic B, Warnking JM, Kobayashi E, et al. Hemodynamic and metabolic responses to activation, deactivation and epileptic discharges. Neuroimage. 2005;28(1):205–15. doi: 10.1016/j.neuroimage.2005.05.038. [DOI] [PubMed] [Google Scholar]
- 48.Zeiler SR, Turtzo LC, Kaplan PW. SPECT-negative SIRPIDs argues against treatment as seizures. J Clin Neurophysiol. 2011;28(5):493–6. doi: 10.1097/WNP.0b013e318231c00a. [DOI] [PubMed] [Google Scholar]
- 49.Smith CC, Tatum WO, Gupta V, Pooley RA, Freeman WD. SPECT-negative SIRPIDs: less aggressive neurointensive care? J Clin Neurophysiol. 2014;31(3):e6–10. doi: 10.1097/WNP.0000000000000090. [DOI] [PubMed] [Google Scholar]
- 50.Claassen J, Rahman SA, Huang Y, et al. Causal Structure of Brain Physiology after Brain Injury from Subarachnoid Hemorrhage. PLoS One. 2016;11(4):e0149878. doi: 10.1371/journal.pone.0149878. [DOI] [PMC free article] [PubMed] [Google Scholar]
Associated Data
This section collects any data citations, data availability statements, or supplementary materials included in this article.