

Abstract
Genome-wide association studies (GWAS) have emerged as a powerful tool to identify alleles and molecular pathways that influence susceptibility to psychiatric disorders and other diseases. Forward genetics using mouse mapping populations allows for a complementary approach which provides rigorous genetic and environmental control. In this protocol, we describe techniques and tools that reduce the technical burden traditionally associated with genetic mapping in mice and enhance their translational utility to human psychiatric disorders. We provide guidance on choosing the appropriate mapping population, discuss the importance of phenotype, and offer detailed instructions on using the Web-based resource GeneNetwork to aid neuroscientists in better understanding the mechanisms through which genes influence behavior. We believe that the continued development of mouse mapping populations, genetic tools, bioinformatics resources, and statistical methodologies should remain a parallel strategy by which to investigate the genetic and environmental underpinnings of psychiatric disorders and other diseases in humans.
Keywords: quantitative trait locus mapping, recombinant inbred strains, systems genetics, GeneNetwork
INTRODUCTION
In the last decade, genome-wide association studies (GWAS) have emerged as a powerful tool to identify alleles and molecular pathways that influence susceptibility to psychiatric disorders (Manolio et al. 2008; Manolio et al. 2013; SWGPGC 2014). To perform GWAS, researchers measure the correlation between phenotypes and DNA markers (often referred to as single nucleotide polymorphisms, or SNPs) across the genome. It is considered a forward genetic approach because it starts with naturally occurring trait variation and looks for naturally occurring genetic variation that is associated with it. If a SNP appears to be highly correlated with a trait of interest, this indicates that the SNP lies physically close to the causative genetic variant.
Despite recent successes, human GWAS are somewhat limited in their scope and utility due to numerous practical, financial, and ethical concerns (Kapp 2006; Gelernter 2015; Montalvo-Ortiz et al. 2016). One complementary approach to human GWAS relies on the use of mouse mapping populations to clarify the biological mechanisms of characteristics relevant to psychiatric disorders and provide deeper insight into the genetic and environmental interactions associated with complex traits. Mouse models allow for environmental factors including drug exposure to be held constant or systematically varied in order to explore interactions between genotype and environment. Since external factors partially regulate how psychiatric symptoms manifest, utilizing rodents exploits this important source of variability that GWAS are often unable to account for (Hovatta et al. 2008). In addition, almost all human genes known to be associated with disease have a mouse orthologue (Adams et al. 2015; MGSC 2002) and most disease genes identified in mice have also been shown to play a role in human diseases (Aitman et al. 2008). Another advantage of mice is that brain tissue can be obtained under idealized laboratory conditions and used to identify gene expression quantitative trait loci (eQTLs). This is especially important because most causal loci implicated in human GWAS appear to be due to regulatory rather than coding polymorphisms (Albert & Kruglyak 2015). Furthermore, replication of initial results can easily be performed in mice, but have become increasingly more challenging in human GWAS as successively larger sample sizes are needed to detect significant associations (Hunter & Crawford 2008). Finally, the genomes of mice can be easily and directly manipulated through a wide range of techniques, making them an incredibly powerful genetic tool (Thomas & Capecchi 1990; Sander & Joung 2014).
Genetic mapping studies in mice have proven to be successful in part because they permit analysis at the genomic, cellular, pharmacological, physiological, behavioral, and bioinformatics levels (Williams & Lu 2008). However, integrating the many different types of data that can be acquired from mouse models has proven to be a technically demanding approach for gene identification. Phenome, genome, and transcriptome data-sets contain massive amounts of information, and the analysis of the many different levels of data is often beyond the reach of an individual neuroscience laboratory. In this protocol, we describe techniques and tools that reduce the technical burden traditionally associated with genetic mapping in mice and enhance their translational utility to human psychiatric disorders. We provide guidance on choosing the appropriate mapping population, discuss the importance of phenotype, and offer detailed instructions on using the Web-based resource GeneNetwork to aid neuroscientists in better understanding the mechanisms through which genes influence behavior. We believe that the continued development of mouse mapping populations, genetic tools, bioinformatics resources, and statistical methodologies should remain a parallel strategy by which to investigate the genetic and environmental underpinnings of psychiatric disorders in humans.
STRATEGIC PLANNING (optional)
Choosing a quantitative trait: the importance of phenotype
To perform systems genetic analysis or QTL mapping, one starts with an operationally defined quantitative trait, i.e. one that is heritable, varies continuously, and is influenced by multiple genetic and environmental factors. Thus, when choosing a trait to study, it is of the utmost importance that the trait does, in fact, vary across genotypes in the population of mice being studied. While this may be difficult to know ahead of time, one promising (but not essential) indicator that a quantitative trait will vary across genotypes is if the trait differs between progenitor strains in a mapping population. It is also important to choose testing conditions and manipulations that prevent a floor or ceiling effect from occurring across a major proportion of the population, as these might conceal any effects of phenotypic variation due to genotype. Another criterion for the trait under investigation is validity: typically, traits with high construct and face validity are going to be the most informative for the study of human disease. Similarly, one should be vigilant about maintaining phenotyping standards over the course of the experiment to avoid the confounding role of laboratory environment. Ideally, sampling of the population should occur in a manner well randomized with respect to genotype, such that if a population consisting of multiple strains is used, one should attempt to study as many strains as possible and to test replicate members of the strains in independent cohorts, rather than to test small groups of strains sequentially.
Choosing a population
There are many mouse populations to choose from, including recombinant inbred panels (e.g. BXD, AXB/BXA, LXS), common inbred panels (e.g. the Mouse Phenome Project strains), the Hybrid Mouse Diversity Panel (a combination of the former two panels), the new Collaborative Cross, Diversity Outbred or other hybrid populations. Availability, genetic and phenotypic variability, and cost may influence the choice of panel further. Populations consisting of inbred strains enable seamless data integration across multiple studies, and thus have long-term capabilities for extension of findings. In populations consisting of outbred mice, power and precision are limitless, but typically, all measures must be obtained from the same population.
BASIC PROTOCOL 1. BASIC PROTOCOL TITLE: Genetic mapping and systems genetics using GeneNetwork
Introductory paragraph
GeneNetwork (www.genenetwork.org) is a free online resource for systems genetics that stores and analyzes behavioral phenotypes, physiological phenotypes, and large gene expression data-sets with matched genomic data for numerous species, including mice. GeneNetwork can analyze a variety of mouse mapping populations, (including F2 intercrosses, backcrosses, recombinant inbred (RI) panels, heterogeneous stock, and the mouse diversity panel) but is not currently compatible with some complex multi-generation crosses such as advanced intercross lines (AILs) or the Collaborative Cross (CC). It is intended for rapid exploratory analysis by neuroscientists and does not require specialized training in bioinformatics or statistical genetics. Data can be downloaded for more extensive or customized analysis as needed. GeneNetwork includes extensive multivariate statistical tools implemented in Python, C and the R statistical language and can be used to map quantitative trait loci (QTLs) and expression QTLs (eQTLs). It can also be used to examine genetic covariation among large numbers of phenotypes and to perform data mining in genomic regions containing candidates for quantitative trait genes (Chesler et al. 2003; 2005; Andreux et al. 2012; Wang, et al. 2003). Finally, GeneNetwork links to other informatics resources such as NCBI (www.ncbi.nlm.gov), the UCSC genome browser (www.genome.ucsc.edu), the Allen Brain Atlas (www.brain-map.org) and GeneWeaver (www.GeneWeaver.org) to drastically streamline the process of QTL and eQTL mapping, candidate gene identification, and co-expression analyses.
Materials
Here we will provide detailed instructions for using GeneNetwork along with some “worked” examples taken from the recent study of intravenous cocaine self-administration by Dickson et al. (2016) in BXD RI mice. A complete overview of GeneNetwork is beyond the scope of this protocol, but is extensively covered in elsewhere (see Mulligan et al. 2016; Williams & Mulligan 2012 for excellent reviews on GeneNetwork).
A computer with an internet connection and current web browser. See the GeneNetwork.org site for information on supported browser versions.
Method
Entering Data
-
1
Link to http://www.genenetwork.org. To submit multiple phenotypes at the same time, select the option for Batch Submission under the Home tab. This allows users to submit up to 100 traits for analysis by GeneNetwork. Here, select BXD as the cross or RI set to analyze from the first pull-down menu. The phenotype file should follow the format described in the Sample text (http://genenetwork.org/sample.txt). After uploading the appropriate file using the Browse button, enter a name for the file in the Dataset space. The data will be stored in the GeneNetwork server for 24 hours. Click Next.
-
2
Alternatively, one can analyze data for a single phenotype. Select the option to Enter Trait Data under the Home tab. Here, choose BXD from the pull-down menu. Data can be entered either from a file or by copying and pasting multiple trait values into the box provided. In both cases, the values can be on one line separated by spaces or tabs, or they can be on separate lines. Include one value for each progeny individual or recombinant inbred line. Represent missing values with a non-numeric character such as “x”. If you have chosen a recombinant inbred set, your data will be displayed in a form where you can confirm and/or edit them. GeneNetwork provides sample data so that you can ensure you have the correct format. As an example for using both methods, data for a phenotype related to intravenous self-administration (IVSA) of cocaine in 29 BXD RIs is provided below that can be saved and pasted in as:
x x x x 0.093 x x x x −1.183 −1.575 x 0.763 0.402 −1.892 x x x −0.981 x x x x x x 0.23 x 1.113 x 1.235 1.048 −2.734 1.875 x x x x −0.687 −0.722 x x −0.264 x x x x x 0.928 x x x x x 1.76 x x 0.255 x −0.559 x x x 2.019 x x x −1.512 −2.009 x x x x x x −0.694 x 1.071 x x x x x x x x x x 0.902 x x x x 1.278 −0.623 0.464 x x x x x These data represent a principal component associated (see “Multitrait QTL Mapping for additional details) with the number of cocaine infusions on the ascending limb of the dose-response curve (IAL, Dickson et al. 2016) and can also be accessed in GeneNetwork by entering Record ID 18494 in the Get Any space on the Search page and clicking on the Search button. Alternatively, enter data by hand into the designated boxes provided by GeneNetwork. These latter options also allow for the inclusion of trait variance. It is a good idea to name the trait in the box provided. Then click Next, and manually enter the data for each RI strain, F1, and founder strain.
-
3
After entering the data, click on the blue plus sign button called Add. This will add the dataset to the collection where it can be saved for future analyses by clicking on the button Save Collection.
Initial Analyses
-
4
To begin analyzing the data, click on the Basic Statistics tab on the Data Editing page. This provides the number of strains in the dataset, along with measures of central tendency and dispersion. It also contains a Probability Plot that can be used to detect the influence of major effect loci by displaying whether or not the data follows a normal distribution. If the distribution is normal, then the actual values and the predicted values based on a z score will form an approximate straight line. Deviations from normality may indicate probable QTLs. Probability plots can also be used to easily identify outliers, skewness, and kurtosis. Outliers on either tail of the distribution may require special statistical handling (see section on Critical Parameters/Troubleshooting, below). Figure 1 shows that the IAL data are approximately normally distributed. The Bar Graph tabs show the IAL scores for all strains tested arranged by name or by rank.
-
5
Traits that are influenced by similar sets of genes would be expected to be correlated across the RI panel and perhaps functionally related in some way (Rosen et al.2007). GeneNetwork can identify phenotypes that may be functionally related by searching for those whose average trait values are correlated.
Using GeneNetwork, click on the Calculate Correlations tab to assess genetic correlations of the trait of interest with all other records in the database, including BXD published phenotypes, BXD genotypes, and mRNA from various brain regions as well as other tissues. To begin, select BXD Published Phenotypes from the Database pull-down menu and click Compute. The default option returns the top 500 phenotypes associated with the trait of interest, but the Return pull-down bar allows researchers to choose how many results to display. Researchers can also choose between selecting Pearson or Spearman Rank correlations. Use Spearman Rank when the sample size is small (<20) or when there are influential outliers.
As an example, the top 10 phenotypes correlated with the IAL trait are shown in Table 1. The correlation analysis shows that the principal component corresponding to infusions on the ascending limb of the dose-response curve is correlated with cocaine infusions at two different doses of cocaine, as well as the number of active lever presses at a low dose of cocaine. The magnitude, not the direction of the correlation is constant, and a test of the correlation of the principal component with the original trait scores or examination of the factor loadings plot will reveal the polarity of the PC scores. Interestingly, IAL is negatively correlated with time spent in the light side of a light-dark box (Record ID 11645; Philip et al. 2010).
Figure 1.
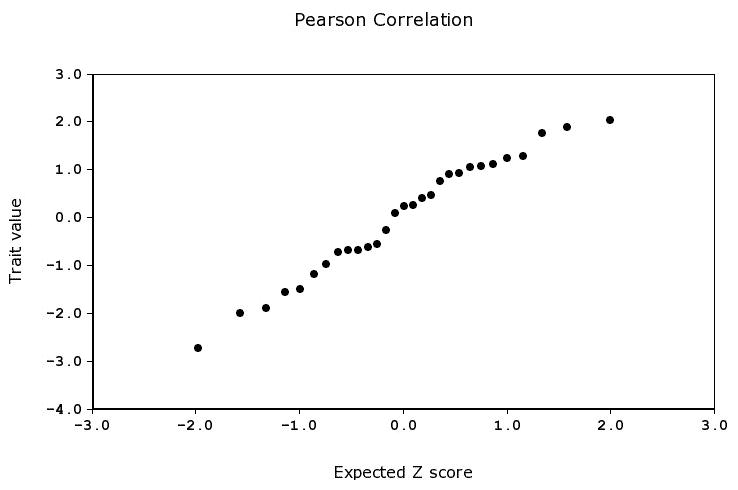
Probability Plot. The normal probability plot evaluates whether data are normally distributed. In this example, the IAL trait values are plotted on the y-axis and the expected Z score value on the x-axis.
Table 1.
Trait Correlation Table. Values of IAL were compared to all 5104 traits in BXD Published Phenotypes database. The top 500 correlations ranked by the Genetic Correlation (Pearson’s r) are displayed.

|
Single trait QTL Mapping
-
6
One particularly valuable function of GeneNetwork is QTL mapping (Wang et al. 2003). QTL mapping seeks to identify genes and/or sequence variants that modulate the trait of interest. It measures the association between SNPs and trait values across the genome. If a SNP appears to be highly correlated with the trait of interest, this indicates that the SNP is physically close to the causative mutation.
On the Data Editing page, the Mapping Tools tab can be used to run a variety of QTL mapping methods. Interval mapping is the standard for almost all non-human populations. It creates linkage maps for the entire genome and the consistency of linkage for a given trait can be evaluated using permutation tests. The permutation test is a method for establishing the significance of the likelihood ratio statistic (LRS) generated by the interval mapping procedure (Churchill & Doerge 1994). In this test, trait values are randomly permuted among the RI strains, destroying any relationship between the trait values and the genotypes of SNP loci. A regression model is fitted for the permuted data at all genomic positions and the maximum LRS is recorded. This procedure is repeated thousands of times, and gives a distribution of likelihood ratio values that would be obtained by chance (if there were no QTL linked to any of the SNP loci). The logarithm of the odds ratio (LOD) score is also provided. Both the LRS and LOD scores give an estimate of the statistical strength of linkage (the LRS is equal to the LOD score multiplied by 4.61).
To perform interval mapping, select All from the Chromosome pull-down menu, choose Megabase from the Mapping Scale pull-down menu, and enter 5000 in the space for Permutations. Then click on the Compute button. This opens a new window that shows the QTL map for the entire genome (Figure 2a). Based on the permutation tests, GeneNetwork will display the exact values for suggestive and significant LOD/LRS scores. In this example, a suggestive LRS = 11.24, and a significant LRS = 18.57. Note that these numbers will change slightly each time you map the trait of interest. A positive additive coefficient is shown by the green line, and indicates that DBA/2J alleles increase trait values. In contrast, a negative additive coefficient is represented by a red line, and indicates that C57BL/6J alleles increase trait values. Thus, one can conclude there is a significant QTL on chromosome 11, and BXD RI mice with DBA/2J alleles at that locus have a decrease in the number of infusions at the lowest three cocaine doses
Zoom in on a particular chromosomal region by selecting the chromosome of interest (say, 11) from the Chr. pull-down menu, and clicking on the button Remap (Figure 2b) or by directly clicking on the chromosome number for the chromosome of interest in the plot. On the new page that opens, click on blue text Download near the top of the page to download the results in a tab-delimited text format. Open the data in an excel spreadsheet to find the exact marker and megabase location of the peak marker by clicking on the Download link. This also provides the genome-wide corrected p-value and additive effect at each marker. Note the megabase positions that define the 2-LOD support interval, which approximately reflects a 95% confidence interval (CI) around the peak locus. The 2-LOD support interval represents the most plausible location for the QTL and where the candidate gene(s) and SNP(s) are most likely to be located. It is calculated by subtracting the number 2 from the peak LOD score, and determining which SNPs are associated with that number on either side of the peak SNP. In this example, observe that the peak locus on Chromosome 11 occurs at 47.436 Mb, with LRS = 24.247 (LOD = 5.26). The 2-LOD interval is 46.03–50.39 Mb, and the nearest listed marker to the QTL peak is rs13481014 located at 47.931 Mb.
Figure 2.

Genome-wide scan of QTLs for IAL in BXD RI mice. (A) The QTL mapping results are shown for the entire mouse genome. The chromosomes are displayed across the top of the x-axis, and the megabase position is displayed along the bottom x-axis. The LRS value is plotted along the y-axis. Grey horizontal lines indicate suggestive QTL and the red horizontal line indicates a significant QTL. A positive additive coefficient (green line) indicates that DBA/2J alleles increase trait values; whereas a negative additive coefficient (red line) indicates that C57BL/6J alleles increase trait values. (B) This box allows the researcher to zoom in on a region of interest. (C) Selected traits to analyze in multi-trait QTL mapping. (D) Matrix correlations used to derive new traits representing principal components for QTL mapping.
Multi-trait QTL Mapping
GeneNetwork has a very useful feature that facilitates QTL mapping of multiple traits. This feature helps address the question of pleiotropy, inherent among many quantitative traits. The feature within GeneNetwork that facilitates such an analysis is based on Principal Component Analysis or PCA. PCA is a dimensionality reduction technique, which identifies the main sources of variation, called principal component, within a multi-trait dataset. These components are identified such that the first principal component is comprised of traits that explain the most amount of variation. Each subsequent principal component identifies groups of traits with lesser amounts of variation. In GeneNetwork, the user first selects the collection of traits that they would like to analyze (Figure 2c). Once selected, the user generates a matrix of correlations by choosing the Matrix tool. Along with correlations, this tool also derives new traits representing the principal components (Figure 2d). The user can add these principal components to their Trait Collection and proceed to perform QTL mapping, as in the case of a single trait QTL mapping. The R/QTL (Broman et al. 2003) and R/CAPE (Tyler et al. 2013) packages can be used for deeper analysis of epistasis and pleiotropy for multiple traits and multiple regulatory loci.
Prioritizing Candidate Genes
-
7
Following the identification of a significant QTL, focus shifts to identifying the particular gene(s) that cause the QTL. QTLminer (Alberts & Schughart 2010) on GeneNetwork can be used to integrate information about the candidate genes within the QTL region in order to prioritize among them. QTLminer automatically generates a list of genes within the interval and retrieves additional information for each gene using publicly available datasets. Not only does QTLminer provide basic annotation data such as gene name, description, and genomic position; it also supplies Gene Ontology (GO) terms and KEGG pathways in which the gene is implicated. In addition, it displays the number of non-synonymous SNPs (nsSNPs) within the gene. These nsSNPs are relevant because they result in amino acid changes in the corresponding protein, which may modify its structure and thus cause the phenotypic differences observed. Furthermore, you can select three GeneNetwork expression datasets. For each dataset, gene expression is included. This displays whether candidate genes are expressed in tissues of interest. Genes that are only expressed in the tissue of interest and not in others might even be better candidates.
Under the Search tab, select QTLminer. Next, use the Chr pull-down menu to select the chromosome under investigation (chromosome 11). Enter the megabase positions that define the 2-LOD support interval in the View spaces (46.03 and 50.39, respectively). Since we are utilizing the BXD RIs, leave C57BL/6J and DBA/2J as the two mouse strains for inclusion of the nsSNP count. Next, select three datasets for inclusion of expression and cis-activity. Given that we are examining a drug-related phenotype in this example, it is appropriate to choose the nucleus accumbens, the midbrain, and the pre-frontal cortex (GeneNetwork study IDs: 44, 141, 36; Wolen et al. 2012; Ye et al. 2014), as these regions have previously been implicated with cocaine IVSA (Bocklisch et al. 2013; Ito et al. 2004; Marinelli et al. 2003; Pettit et al. 1984; Roberts & Koob 1982; Vassoler et al. 2013; Weissenborn et al. 1997; Wise 2009). In all three datasets, choose the Databases associated with naïve or saline conditions on the pull-down menu, as we are interested in resting gene expression levels (Figure 3; midbrain = VU BXD Midbrain Agilent SurePrint C3 Mouse GE (May 12) Quantile, nucleus accumbens = VCU BXD NAc Sal M430 2.0 (Oct07) RMA, prefrontal cortex = VCU BXD PFC Sal M430 2.0 (Dec06) RMA). Click on the Analyze QTL interval button. Of the 68 genes in the QTL interval, 56 were expressed in at least one of the tissues of interest.
-
8
Information about cis-regulation can also help prioritize candidate genes. A gene is cis-regulated if its expression maps close to its own genomic position. Any cis-regulated gene within the QTL interval is an especially promising candidate gene, since cis-regulation indicates a difference in gene expression levels, which may regulate the trait. The results obtained from QTLminer show that of the 56 genes that were expressed in one of the tissues of interest, only two were also cis-regulated: Cyfip2 and Itk. These two genes should be considered priority candidates. Notably, Cyfip2 has been previously shown to play a critical role in behavioral sensitization to cocaine (Kumar et al. 2013). Therefore, the steps below will focus on examining the expression of the Cyfip2 transcript in more detail, as it may be the driver of this QTL.
Click on the Search Databases option under the Search tab. Make sure that Mouse is selected as the Species and BXD as the Group on the pull-down menus. Under Type, select Midbrain mRNA and write Cyfip2 into the Get Any space. Click on the blue Search button (Figure 4a).
In the new window (Figure 4b), click on the blue Record ID (A_55_P1962771). Perform QTL mapping for expression levels of Cyfip2 the same way that was outlined for behavioral traits in step 6a. Under Mapping Tools, enter 5000 in the Permutation space, and then click Compute.
In the new window, there is a significant cis-eQTL (LRS = 62.7) for Cyfip2 as well as a significant trans-eQTL (LRS = 18.8) for Cyfip2 on chromosome 3 (Figure 4c). Notably, the gene Fxr1 resides within this confidence interval (Chr 3 at 33.96 Mb) and is functionally related to Cyfip2 (Schenck et al. 2001).
In order to examine the relationship between gene expression, genotype, and segregation pattern of parental alleles, check the Haplotype Analyst box and change Chr to 11 and View to 46.03 to 50.39. Then click Remap. This shows the inheritance pattern for each BXD RI strain (Figure 5). Similar genotypes across markers define a haplotype and are shown in blocks of green (inherited from the paternal strain) or red (inherited from the maternal strain), with undefined regions shown in grey. Therefore, BXD strains that have inherited the paternal DBA/2J allele (indicated in green) have high expression of Cyfip2 and those strains that have inherited the maternal C57BL/6J allele (indicated in red) have lower expression.
-
9
Candidate genes can be further prioritized by determining if they exhibit expression levels that co-vary with the phenotype of interest in the brain region they are expressed in. On the Trait Data and Analysis page for Record ID A_55_P1962771, expand the Calculate Correlations tab. Select BXD Published Phenotypes from the pull-down menu, and click the Compute button. This opens a new window showing that expression of Cyfip2 has a strong positive correlation (r = .79; p = 0.00022) with IAL (Record ID 18494; Table 2). Thus, without performing any additional experiments, steps 7, 8, and 9 establish that Cyfip2 is expressed in a brain region that is implicated with cocaine IVSA, exhibits a cis- and a trans-eQTL in that brain region, and its expression levels co-vary with the cocaine IVSA phenotype.
Figure 3.
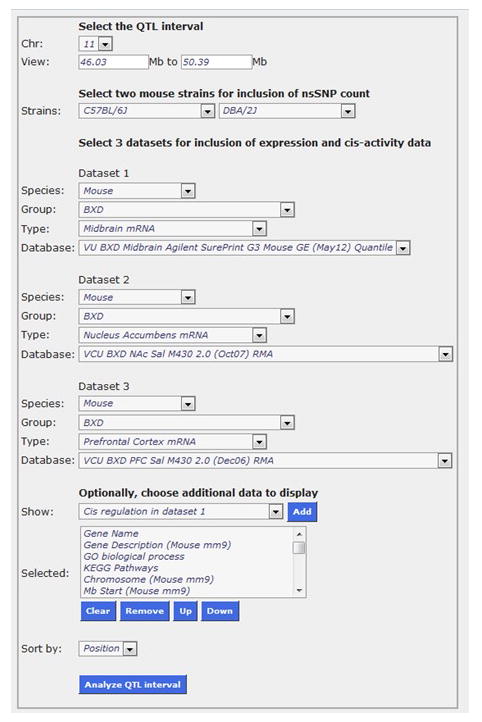
Using QTLminer to prioritize candidate genes. QTLminer performs QTL region analysis. It provides the user with a list of candidate genes located within the QTL interval; as well as annotation data, number of non-synonymous SNPs, GO terms, and KEGG pathways. It also allows the user to select three GeneNetwork expression data sets to gene expression and cis-regulation.
Figure 4.

Cis-regulation of candidate genes. (A) Searching for Cyfip2 gene expression in BXD RI midbrain. (B) Record ID for Cyfip2. (C) eQTL mapping results for Cyfip2 expression in the midbrain.
Figure 5.

Haplotype Analyst. Displayed is the inheritance pattern for each BXD RI strain. The location of the genes is displayed at the top of the plot, and a map of the chromosome for each strain lies below, with the strain IDs on the right y-axis. The trait values are sorted from highest to lowest and the numerical expression value for Cyfip2 is listed to the right of the strain ID. The markers reveal whether that position in the genome is inherited from C57BL/6J or DBA/2J mice, and are indicated in black. Blocks of green are inherited from the paternal strain and blocks of red are inherited from the maternal strain.
Table 2.
Genetic covariation between midbrain expression of Cyfip2 and IAL. Expression of Cyfip2 has a strong positive (r = .79; p = 0.00022) correlation with IAL.

|
Trans-eQTL associated with behavioral QTL
-
10
Genes exhibiting expression levels that map to the behavioral QTL in a brain region with known relevance to trait of interest may be functionally related to the gene(s) underlying those same behavioral QTL. Therefore, it is important to identify genes that exhibit genome-wide significant trans-eQTL (p < 0.05) with a peak located within the 2-LOD support interval of the IAL behavioral QTL.
From the Search tab, select Search Databases. Change Type to Midbrain mRNA and use the default Data Set. Enter the following text into the Combined search box: MEAN = (9 16) LRS = (17 999 Chr11 46.03 50.39) transLRS = (17 999 5) and then click the Search button (Figure 6a). This will retrieve all the genes and transcripts from this particular midbrain data set that have a mean expression between 9 and 16 [(MEAN = 9 16)] with a maximum LRS value between 17 and 999 [transLRS = (17 999)] located near the IAL behavioral QTL interval [LRS = (17 999 Chr11 46.03 50.39)]. This query returns six genes, Fam53b, Mapk12, Lppr5, Chchd7, Serpini1, and Rps6ka6, that exhibit genome-wide significant trans-eQTL located within the support interval of the IAL behavioral QTL on chromosome 11 (Figure 6b). Interestingly, a GWAS of cocaine dependence in humans identified FAM53B as the only candidate (Gelernter et al. 2014) to reach genome-wide significance.
To further explore the relationship between the highest priority candidate gene associated with the IAL QTL (Cyfip2) and Fam53b, we can determine if they are co-expressed genome-wide significantly in the midbrain. From the Search tab, select Search Databases. Select Midbrain mRNA from the Type pull-down menu. Enter Cyfip2 into the Get Any space and click on the Search button. Click on the blue Record ID (A_55_P1962771). Expand the Calculate Correlations tab, and select VU BXD Midbrain Agilent Sureprint G3 Mouse GE (May 12) Quantile from the pull-down menu to analyze midbrain RNA. Select the Spearman Rank button and click Compute. In the list of genes provided, scroll down and click on the correlation highlighted in blue (rho = 0.691) on the row for Fam53b to generate a correlation plot and see that Fam53b and Cyfip2 are co-expressed genome-wide significantly in the midbrain (p = 7.11E-7; Figure 7). This suggests a functional relationship between Cyfip2 and Fam53b in the context of cocaine use.
Figure 6.

Trans-eQTL associated with behavioral QTL. (A) Use the combined search box to retrieve all transcripts from the VU BXD midbrain data set that have a mean expression between 9 and 16 with a maximum LRS value between 17 and 999 located near the IAL behavioral QTL interval. (B) Six genes exhibited genome-wide significant trans-eQTL within the 2-LOD support interval of the IAL QTL.
Figure 7.
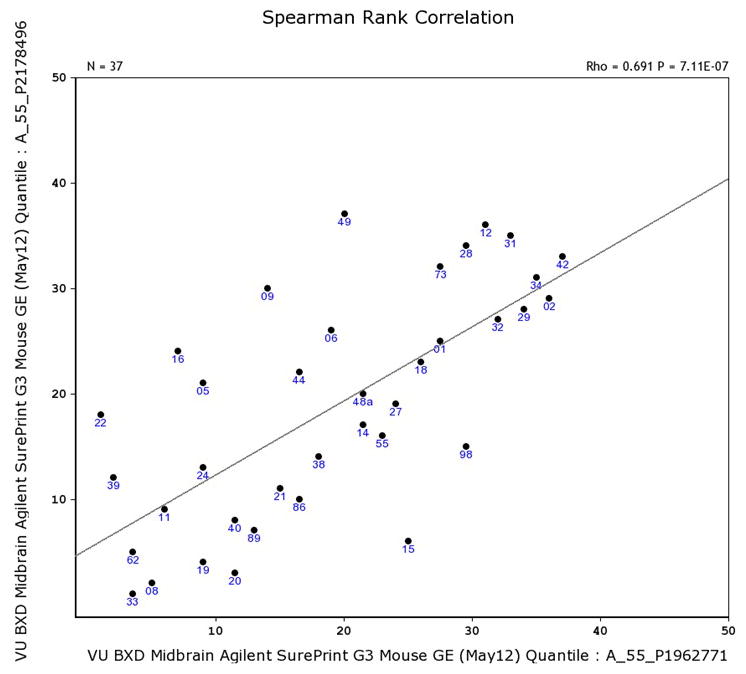
Gene expression correlations. Fam53b (y-axis) and Cyfip2 (x-axis) are co-expressed genome-side significantly in the midbrain.
Genome-wide covariation of phenotypes and gene expression
-
11
Genes exhibiting expression levels that co-vary with a phenotype of interest in a relevant brain region may be part of a larger network involved in driving that trait. Therefore, it is informative to identify all genes across the genome exhibiting expression levels that co-vary genome-wide significantly with cocaine IVSA phenotypes associated with a behavioral QTL. To calculate the genome-wide error rate for each brain region, use the Bonferroni correction (.05/number of probe sets) and exclude probe sets that are not associated with any genes. In this example, Bonferroni-adjusted genome-wide significance levels for the nucleus accumbens, midbrain, and prefrontal cortex are 1.1 x 10⁻⁶, 1.5 x 10⁻⁶, and 1.1 x 10⁻⁶, respectively.
Select Search Databases from the Search tab. Choose BXD from the pull-down menu for Group, Phenotypes from the pull-down menu for Type, and enter IAL in the Get Any space. Click on the Search button. In the new page that opens, click on the blue Record ID (Record ID 18494). Alternatively, enter or upload the data using the procedure described in step 2.
Expand the Calculate Correlations tab, and select VU BXD Midbrain Agilent Sureprint G3 Mouse GE (May 12) Quantile from the pull-down menu to analyze midbrain RNA. Click Compute. In the new page that opens, GeneNetwork provides a table showing all the genes and transcripts and their correlations with IAL. No transcripts expressed in the midbrain meet the criteria for genome-wide significance. Return to the Trait Data and Analysis page and select VCU BXD PFC Sal M430 2.0 (Dec06) RMA from the Database pull-down menu to analyze prefrontal cortex RNA. Click Compute. The expression of one gene in the prefrontal cortex, Rpl31, co-varied genome-wide significantly with IAL. Return to the Trait Data and Analysis page a final time and select VCU BXD NAc Sal M430 2.0 (Oct07) RMA from the Database pull-down menu to analyze nucleus accumbens RNA and then click Compute. In the new page that opens, the table shows that Hist3h2a and Skp1a reached genome-wide statistical significance. This demonstrated that a total of three genes had expression values that significantly co-varied with the trait of interest.
SUPPORT PROTOCOL TITLE
Composite Interval Mapping
QTLs underlying complex traits may act independently, may be linked to another QTL, or may interact epistatically with other QTLs (Doerge 2002). Researchers are often interested in identifying interacting QTL, as they indicate genomic regions that might not otherwise be identified using an interval mapping approach. However, locating multiple, interacting QTL can be computationally demanding due to the large number of statistical tests that are required for this approach. Composite interval mapping (Zeng 1993; 1994) reduces the number of statistical tests by including additional marker loci as cofactors in order to remove any variation associated with other linked QTL. These markers are generally chosen because they are the peak marker located near a significant QTL. By controlling for a single background marker, GeneNetwork factors out a portion of the genetic variance produced by the major QTL and allows users to detect secondary QTLs.
Materials
Protocol steps—Step annotations
Here we will provide detailed instructions for composite interval mapping in GeneNetwork using an example taken from Crusio et al. (2016) who recently reanalyzed data from behavioral phenotyping of 64 BXD RI strains in the presence of morphine (Philip et al. 2010).
On the search page, select Mouse from the Species pull-down menu, BXD from the Group pull-down menu, Phenotypes from the Type pull-down menu, and BXD Published Phenotypes from the Data Set pull-down menu. In the Get Any space, enter the 11852. This is the Record ID for distance traveled in the open field following 50 mg/kg morphine (Philip et al. 2010). Click on the Search button.
On the new page, click on the blue Record ID 11852 to open up the Trait Data and Analysis page.
Marker regression computes and displays LRS values for individual markers. Determine which marker has the highest LRS value by expanding the Mapping Tools tab and clicking on the Marker Regression tab. Check the Display all LRS box, and click Compute. The genome-wide mapping results for morphine response are displayed. There is a highly significant QTL on chromosome 10, but no other QTLs reach significance (Figure 8). Scroll down the page to see the names and locations of markers ranked by LRS score. The SNP marker rs3721803 located at 3.342585 Mb on chromosome 10 is ranked highest, with an LRS of 31.591. The last column displays the additive effect value. This represents half the difference in the mean phenotype of all cases that are homozygous for one parental allele at this marker minus the mean of all cases that are homozygous for the other parental allele at this marker. Here, a positive additive effect indicates that DBA/2J alleles increase trait values, while negative additive effects indicate that C57BL/6J alleles increase trait values. In this example, C57BL/6J alleles increase morphine sensitivity at the rs3721803 marker.
Return to the Trait Data and Analysis page and click on the Composite tab under Mapping Tools. In the Control Locus box, enter rs3721803 into the space provided and click Compute (Figure 9a).
In the page that opens, the genome-wide mapping results now show a significant QTL on chromosome 7 (Figure 9b). Thus, composite interval mapping in the BXD RI panel resulted in the detection of an additional QTL for morphine-induced locomotor activity.
Figure 8.

Marker regression. Genome-wide mapping for morphine sensitivity using marker regression shows a significant QTL on chromosome 10. Each dot represents a genetic marker. The chromosomes are displayed across the top of the x-axis, and the megabase position is displayed along the bottom x-axis. The LRS value is plotted along the y-axis. Grey horizontal lines indicate suggestive QTL and the red horizontal line indicates a significant QTL.
Figure 9.

Composite interval mapping. (A) This box allows researchers to include the peak marker (rs3721803) from the chromosome 11 QTL as a cofactor. (B) Genome-wide mapping using the composite interval approach identifies a novel QTL on chromosome 7 associated with morphine sensitivity.
COMMENTARY
Background Information
Recombinant inbred panels are genetic reference populations that allow for well-powered and moderately precise QTL mapping. They are a key resource for the study of complex traits because genotyping is only required once. RI panels are homozygous at each locus throughout their entire genomes. Thus, each RI line consists of an inbred strain that can be infinitely replicated in large numbers. This makes them particularly useful for neuroscientific studies that require replication across individuals, treatment conditions, environments, and time. Importantly, the ability to resample individuals can boost heritability by reducing non-genetic variance (Belknap 1998).
The utility of RIs as a mapping population is dependent in part upon the availability of a sufficiently large panel that provides enough power to detect QTLs with small effect sizes (Gora-Maslak et al. 1991). Classical two-parent RI panels are created by crossing two inbred strains to produce the F1 generation. This is followed by a minimum of 20 consecutive generations of brother × sister matings to obtain the different RI strains of mice. Currently, there are at least 10 different traditional RI panels, including BXD, AXB/BXA, AKXD, BXH, BRX58N, CXB, LXS, LGXSM, NXSM, and SWXJ.
The BXD RI panel is the most frequently used RI panel, and was initially derived through inbreeding the offspring of an intercross of C57BL/6J and DBA/2J mice (Taylor et al. 1977). Additional lines were created over the next 30 years (Taylor et al. 1999), including lines derived from an advanced intercross to increase mapping precision (Peirce et al. 2004). Today, the BXD RI panel consists of ~150 strains available from the Jackson Laboratory (Bar Harbor, ME) and the University of Tennessee Health Science Center (Memphis, TN). One significant advantage of BXD RIs is that both parental strains have been sequenced and differ at ~1.8 million SNPs across the genome. Combining this information with the BXD RI genotyping data makes it possible to determine the source of polymorphic alleles (either C57BL/6J or DBA/2J) throughout the genomes of BXD RI strains of mice (Hsu et al. 2007)
These RI strains have higher amounts of recombination as compared to backcrosses and F2 intercrosses, but lower amounts of recombination as compared to heterogeneous stock mice, Diversity Outbred mice, commercially available outbred mice, most advanced intercross lines, and the Collaborative Cross RI panel. In addition, traditional two-parent RI panels segregate for only a fraction of all known polymorphisms. Thus, one can only study the alleles that segregate between the two founder strains, rather than the total number of alleles that segregate among laboratory or wild mice. For example, the BXD panel segregates ~5.2 million sequence variants, which represents only 44% of common variants among standard inbred strains (Roberts et al. 2007). Blindspots may be present in some regions of the genome that are identical-by-descent (Yang et al. 2007), and those regions will not contribute to trait variance (but see Li et al. 2010). The current BXD panel allows for mapping of QTL that are approximately 1–2 Mb in size and account for approximately 10% of the phenotypic variance (Peirce et al. 2004). Although this lower precision and diversity appear to be drawbacks, it should be noted that they also stabilize background variation, epistasis and GXE, possibly providing greater power to detect small effect loci in a cross of the RI panel. A caveat is that the earliest set of BXD RI lines was derived before the introduction of the genetic stability program and therefore, may harbor some loci that have since mutated in the founder stock. This can introduce sub-population effects (Philip et al. 2010).
Critical Parameters & Troubleshooting
Sex balance
Male and female mice should be used in roughly equal numbers and concurrently. This is important for several reasons. On a purely pragmatic level, NIH is mandating the inclusion of female subjects in biomedical research through program oversight, review, and through collaboration with publishers. Research may be less likely to be funded or even published if both sexes are not included. From a scientific perspective, results obtained by evaluating sex differences can improve the translational utility of mouse studies and provide mechanistic insight (for examples see Voskuhl & Palaszynski 2001; Wisdom et al. 2013; Fox et al. 2014). Currently, GeneNetwork does not allow sex to be treated as an interactive covariate. Instead, users can perform QTL mapping on each sex individually to identify sex-specific QTLs. Genetic analysis of the residuals from the regression of males against females will reveal sex specific effects.
Batch effects
To control for confounding batch effects, avoid using a single litter for each genotype. Instead, interleave phenotyping to test 10–15 different RI strains with 1–2 individuals per sex for the first phase of the experiment, and repeat cycles until the desired number of strains is obtained. If an interleaved design is not possible, at a minimum one should periodically re-phenotype a well-characterized strain to check whether litter or batch effects are contributing to phenotypic variation or drift.
Sample size
Genetic mapping studies rely on both the appropriate number of unique genotypes (i.e., strains) that are phenotyped as well as the number of replicates per genotype (Andreux et al. 2012; Belknap 1998). Increasing the number of total genotypes tested has a larger effect on power to detect QTLs than increasing the number of replicates (Belknap 1998). However, increasing the number of replicates within a strain can boost heritability by reducing non-genetic variance (Belknap 1998). Therefore, determining the appropriate number of genotypes and replicates depends in part on the heritability of the trait under investigation. Because the effect size of individual QTLs is not generally known in advance, it is difficult to provide concrete guidelines about the sample size needed for genotypes and replicates. Two replicates per sex per strain is generally accepted, although this approach is unlikely to identify sex differences within any single strain. Therefore, some consider at 6 – 8 replicates per group to be optimal (Williams & Williams 2016).
Outliers
Outliers can have large, unwanted effects on correlations and QTL mapping results. GeneNetwork identifies all outliers in the Trait Data and Analysis window by highlighting them in yellow. Four options for dealing with outliers are: 1) include the outliers, 2) delete the outliers, 3) transform the data, or 4) Winsorize the outliers. Outliers will have the largest effects on results when the sample size is small or the outliers particularly extreme. It is recommended that if the obtained results depend on just one or two outliers, it is best to delete or Winsorize them.
Time Considerations
The computational steps described in this protocol are expected to take 1–2 hours to execute.
Significance Statement.
Despite recent successes in discovery of natural variation in biological mechanisms driving disease susceptibility, human genome-wide association studies (GWAS) are limited due to practical and financial concerns. Systems genetics in mice uses rigorous genetic and environmental control to offer a complementary approach for discovery of disease biology that has efficiency and versatility. Brain genomic analysis can be used to identify gene networks driving quantitative traits. Mouse genomes can be readily manipulated; consequently, enabling rapid, cost-effective validation. Mouse genetic reference populations are a powerful experimental system for neuroscientists wishing to study the molecular mechanisms underlying sophisticated, complex behavioral or neurobiological traits. Existing publicly available data resources make analyses in these populations facile, and all that is required is the quantification of traits of interest. Using recently published examples, this protocol demonstrates the process of systems genetic analysis in the mouse and its relevance to a human genetic variant.
Acknowledgments
C.C.P. is supported by NIH P20GM103449 and NIH R15DA041618. E.J.C. and P.E.D. are supported by NIH R01DA037927 and NIH P50DA039841. V.M.P is supported by NIH P50DA039841.
Footnotes
INTERNET RESOURCES
http://genenetwork.org/webqtl/main.py
GeneNetwork is a free scientific web resource used to study relationships between differences in genes, environmental factors, phenotypes, and disease risk.
LITERATURE CITED
- Adams DJ, Doran AG, Lilue J, Keane TM. The Mouse Genomes Project: a repository of inbred laboratory mouse strain genomes. Mammalian Genome: Official Journal of the International Mammalian Genome Society. 2015;26:403–412. doi: 10.1007/s00335-015-9579-6. [DOI] [PubMed] [Google Scholar]
- Aitman TJ, Critser JK, Cuppen E, Dominiczak A, Fernandez-Suarez XM, Flint J, Gauguier D, Geurts AM, Gould M, Harris PC, et al. Progress and prospects in rat genetics: a community view. Nature Genetics. 2008;40:516–522. doi: 10.1038/ng.147. [DOI] [PubMed] [Google Scholar]
- Albert FW, Kruglyak L. The role of regulatory variation in complex traits and disease. Nature Reviews. Genetics. 2015;16:197–212. doi: 10.1038/nrg3891. [DOI] [PubMed] [Google Scholar]
- Alberts R, Schughart K. QTLminer: identifying genes regulating quantitative traits. BMC bioinformatics. 2010;11:516. doi: 10.1186/1471-2105-11-516. [DOI] [PMC free article] [PubMed] [Google Scholar]
- Andreux PA, Williams EG, Koutnikova H, Houtkooper RH, Champy MF, Henry H, Schoonjans K, Williams RW, Auwerx J. Systems genetics of metabolism: the use of the BXD murine reference panel for multiscalar integration of traits. Cell. 2012;150:1287–1299. doi: 10.1016/j.cell.2012.08.012. [DOI] [PMC free article] [PubMed] [Google Scholar]
- Belknap JK. Effect of within-strain sample size on QTL detection and mapping using recombinant inbred mouse strains. Behavior Genetics. 1998;28:29–38. doi: 10.1023/a:1021404714631. [DOI] [PubMed] [Google Scholar]
- Bocklisch C, Pascoli V, Wong JCY, House DRC, Yvon C, de Roo M, Tan KR, Lüscher C. Cocaine disinhibits dopamine neurons by potentiation of GABA transmission in the ventral tegmental area. Science (New York, NY ) 2013;341:1521–1525. doi: 10.1126/science.1237059. [DOI] [PubMed] [Google Scholar]
- Broman KW, Wu H, Sen S, Churchill GA. R/qtl: QTL mapping in experimental crosses. Bioinformatics. 2003;19:889–890. doi: 10.1093/bioinformatics/btg112. [DOI] [PubMed] [Google Scholar]
- Chesler EJ, Lu L, Shou S, Qu Y, Gu J, Wang J, Hsu HC, Mountz JD, Baldwin NE, Langston MA, et al. Complex trait analysis of gene expression uncovers polygenic and pleiotropic networks that modulate nervous system function. Nature Genetics. 2005;37:233–242. doi: 10.1038/ng1518. [DOI] [PubMed] [Google Scholar]
- Chesler EJ, Wang J, Lu L, Qu Y, Manly KF, Williams RW. Genetic correlates of gene expression in recombinant inbred strains: a relational model system to explore neurobehavioral phenotypes. Neuroinformatics. 2003;1:343–357. doi: 10.1385/NI:1:4:343. [DOI] [PubMed] [Google Scholar]
- Churchill GA, Doerge RW. Empirical threshold values for quantitative trait mapping. Genetics. 1994;138:963–971. doi: 10.1093/genetics/138.3.963. [DOI] [PMC free article] [PubMed] [Google Scholar]
- Crusio WE, Dhawan E, Chesler EJ, Delprato A. Analysis of morphine responses in mice reveals a QTL on Chromosome 7. F1000Research. 2016;5:2156. doi: 10.12688/f1000research.9484.1. [DOI] [PMC free article] [PubMed] [Google Scholar]
- Dickson PE, Miller MM, Calton MA, Bubier JA, Cook MN, Goldowitz D, Chesler EJ, Mittleman G. Systems genetics of intravenous cocaine self-administration in the BXD recombinant inbred mouse panel. Psychopharmacology. 2016;233:701–714. doi: 10.1007/s00213-015-4147-z. [DOI] [PMC free article] [PubMed] [Google Scholar]
- Doerge RW. Mapping and analysis of quantitative trait loci in experimental populations. Nature Reviews Genetics. 2002;3:43–52. doi: 10.1038/nrg703. [DOI] [PubMed] [Google Scholar]
- Fox HC, Morgan PT, Sinha R. Sex differences in guanfacine effects on drug craving and stress arousal in cocaine-dependent individuals. Neuropsychopharmacology: Official Publication of the American College of Neuropsychopharmacology. 2014;39:1527–1537. doi: 10.1038/npp.2014.1. [DOI] [PMC free article] [PubMed] [Google Scholar]
- Gelernter J. Genetics of complex traits in psychiatry. Biological Psychiatry. 2015;77:36–42. doi: 10.1016/j.biopsych.2014.08.005. [DOI] [PMC free article] [PubMed] [Google Scholar]
- Gelernter J, Sherva R, Koesterer R, Almasy L, Zhao H, Kranzler HR, Farrer L. Genome-wide association study of cocaine dependence and related traits: FAM53B identified as a risk gene. Molecular Psychiatry. 2014;19:717–723. doi: 10.1038/mp.2013.99. [DOI] [PMC free article] [PubMed] [Google Scholar]
- Gora-Maslak G, McClearn GE, Crabbe JC, Phillips TJ, Belknap JK, Plomin R. Use of recombinant inbred strains to identify quantitative trait loci in psychopharmacology. Psychopharmacology. 1991;104:413–424. doi: 10.1007/BF02245643. [DOI] [PubMed] [Google Scholar]
- Hovatta I, Barlow C. Molecular genetics of anxiety in mice and men. Annals of Medicine. 2008;40:92–109. doi: 10.1080/07853890701747096. [DOI] [PubMed] [Google Scholar]
- Hsu HC, Lu L, Yi N, Van Zant G, Williams RW, Mountz JD. Quantitative trait locus (QTL) mapping in aging systems. Methods in Molecular Biology (Clifton, NJ ) 2007;371:321–348. doi: 10.1007/978-1-59745-361-5_23. [DOI] [PubMed] [Google Scholar]
- Hunter KW, Crawford NPS. The future of mouse QTL mapping to diagnose disease in mice in the age of whole-genome association studies. Annual Review of Genetics. 2008;42:131–141. doi: 10.1146/annurev.genet.42.110807.091659. [DOI] [PubMed] [Google Scholar]
- Ito R, Robbins TW, Everitt BJ. Differential control over cocaine-seeking behavior by nucleus accumbens core and shell. Nature Neuroscience. 2004;7:389–397. doi: 10.1038/nn1217. [DOI] [PubMed] [Google Scholar]
- Kapp MB. Ethical and legal issues in research involving human subjects: do you want a piece of me? Journal of Clinical Pathology. 2006;59:335–339. doi: 10.1136/jcp.2005.030957. [DOI] [PMC free article] [PubMed] [Google Scholar]
- Kumar V, Kim K, Joseph C, Kourrich S, Yoo SH, Huang HC, Vitaterna MH, de Villena FPM, Churchill G, Bonci A, et al. C57BL/6N mutation in cytoplasmic FMRP interacting protein 2 regulates cocaine response. Science (New York, NY ) 2013;342:1508–1512. doi: 10.1126/science.1245503. [DOI] [PMC free article] [PubMed] [Google Scholar]
- Li Z, Mulligan MK, Wang X, Miles MF, Lu L, Williams RW. A transposon in Comt generates mRNA variants and causes widespread expression and behavioral differences among mice. PloS One. 2010;5:e12181. doi: 10.1371/journal.pone.0012181. [DOI] [PMC free article] [PubMed] [Google Scholar]
- Manolio TA. Bringing genome-wide association findings into clinical use. Nature Reviews Genetics. 2013;14:549–558. doi: 10.1038/nrg3523. [DOI] [PubMed] [Google Scholar]
- Manolio TA, Brooks LD, Collins FS. A HapMap harvest of insights into the genetics of common disease. The Journal of Clinical Investigation. 2008;118:1590–1605. doi: 10.1172/JCI34772. [DOI] [PMC free article] [PubMed] [Google Scholar]
- Marinelli M, Cooper DC, Baker LK, White FJ. Impulse activity of midbrain dopamine neurons modulates drug-seeking behavior. Psychopharmacology. 2003;168:84–98. doi: 10.1007/s00213-003-1491-1. [DOI] [PubMed] [Google Scholar]
- Montalvo-Ortiz JL, Gelernter J, Hudziak J, Kaufman J. RDoC and translational perspectives on the genetics of trauma-related psychiatric disorders. American Journal of Medical Genetics. Part B, Neuropsychiatric Genetics: The Official Publication of the International Society of Psychiatric Genetics. 2016;171B:81–91. doi: 10.1002/ajmg.b.32395. [DOI] [PMC free article] [PubMed] [Google Scholar]
- Mouse Genome Sequencing Consortium. Waterston RH, Lindblad-Toh K, Birney E, Rogers J, Abril JF, Agarwal P, Agarwala R, Ainscough R, Alexandersson M, et al. Initial sequencing and comparative analysis of the mouse genome. Nature. 2002;420:520–562. doi: 10.1038/nature01262. [DOI] [PubMed] [Google Scholar]
- Mulligan MK, Mozhui K, Prins P, Williams RW. GeneNetwork - A toolbox for systems genetics. In: Schughart K, Williams R, editors. Systems Genetics, Methods in Molecular Biology. Humana Press; In press. [DOI] [PMC free article] [PubMed] [Google Scholar]
- Peirce JL, Lu L, Gu J, Silver LM, Williams RW. A new set of BXD recombinant inbred lines from advanced intercross populations in mice. BMC genetics. 2004;5:7. doi: 10.1186/1471-2156-5-7. [DOI] [PMC free article] [PubMed] [Google Scholar]
- Pettit HO, Ettenberg A, Bloom FE, Koob GF. Destruction of dopamine in the nucleus accumbens selectively attenuates cocaine but not heroin self-administration in rats. Psychopharmacology. 1984;84:167–173. doi: 10.1007/BF00427441. [DOI] [PubMed] [Google Scholar]
- Philip VM, Duvvuru S, Gomero B, Ansah TA, Blaha CD, Cook MN, Hamre KM, Lariviere WR, Matthews DB, Mittleman G, et al. High-throughput behavioral phenotyping in the expanded panel of BXD recombinant inbred strains. Genes, Brain, and Behavior. 2010;9:129–159. doi: 10.1111/j.1601-183X.2009.00540.x. [DOI] [PMC free article] [PubMed] [Google Scholar]
- Roberts DC, Koob GF. Disruption of cocaine self-administration following 6-hydroxydopamine lesions of the ventral tegmental area in rats. Pharmacology, Biochemistry, and Behavior. 1982;17:901–904. doi: 10.1016/0091-3057(82)90469-5. [DOI] [PubMed] [Google Scholar]
- Rosen GD, Chesler EJ, Manly KF, Williams RW. An informatics approach to systems neurogenetics. Methods in Molecular Biology (Clifton, NJ ) 2007;401:287–303. doi: 10.1007/978-1-59745-520-6_16. [DOI] [PubMed] [Google Scholar]
- Sander JD, Joung JK. CRISPR-Cas systems for editing, regulating and targeting genomes. Nature Biotechnology. 2014;32:347–355. doi: 10.1038/nbt.2842. [DOI] [PMC free article] [PubMed] [Google Scholar]
- Schizophrenia Working Group of the Psychiatric Genomics Consortium. Biological insights from 108 schizophrenia-associated genetic loci. Nature. 2014;511:421–427. doi: 10.1038/nature13595. [DOI] [PMC free article] [PubMed] [Google Scholar]
- Taylor BA, Bedigian HG, Meier H. Genetic studies of the Fv-1 locus of mice: linkage with Gpd-1 in recombinant inbred lines. J Virology. 1977;23:106–109. doi: 10.1128/jvi.23.1.106-109.1977. [DOI] [PMC free article] [PubMed] [Google Scholar]
- Taylor BA, Wnek C, Kotlus BS, Roemer N, MacTaggart T, Phillips SJ. Genotyping new BXD recombinant inbred mouse strains and comparison of BXD and consensus maps. Mammalian Genome: Official Journal of the International Mammalian Genome Society. 1999;10:335–348. doi: 10.1007/s003359900998. [DOI] [PubMed] [Google Scholar]
- Thomas KR, Capecchi MR. Targeted disruption of the murine int-1 proto-oncogene resulting in severe abnormalities in midbrain and cerebellar development. Nature. 1990;346:847–850. doi: 10.1038/346847a0. [DOI] [PubMed] [Google Scholar]
- Tyler AL, Lu W, Hendrick JJ, Philip VM, Carter GW. CAPE: an R package for combined analysis of pleiotropy and epistasis. PLoS Computational Biology. 2013;(10):e1003270. doi: 10.1371/journal.pcbi.1003270. [DOI] [PMC free article] [PubMed] [Google Scholar]
- Vassoler FM, White SL, Schmidt HD, Sadri-Vakili G, Pierce RC. Epigenetic inheritance of a cocaine-resistance phenotype. Nature Neuroscience. 2013;16:42–47. doi: 10.1038/nn.3280. [DOI] [PMC free article] [PubMed] [Google Scholar]
- Voskuhl RR, Palaszynski K. Sex hormones in experimental autoimmune encephalomyelitis: implications for multiple sclerosis. The Neuroscientist: A Review Journal Bringing Neurobiology, Neurology and Psychiatry. 2001;7:258–270. doi: 10.1177/107385840100700310. [DOI] [PubMed] [Google Scholar]
- Wang J, Williams RW, Manly KF. WebQTL: web-based complex trait analysis. Neuroinformatics. 2003;1:299–308. doi: 10.1385/NI:1:4:299. [DOI] [PubMed] [Google Scholar]
- Weissenborn R, Robbins TW, Everitt BJ. Effects of medial prefrontal or anterior cingulate cortex lesions on responding for cocaine under fixed-ratio and second-order schedules of reinforcement in rats. Psychopharmacology. 1997;134:242–257. doi: 10.1007/s002130050447. [DOI] [PubMed] [Google Scholar]
- Williams RW, Lu L. Integrative genetic analysis of alcohol dependence using the GeneNetwork Web resources. Alcohol Research & Health: The Journal of the National Institute on Alcohol Abuse and Alcoholism. 2008;31:275–277. [PMC free article] [PubMed] [Google Scholar]
- Williams RW, Mulligan MK. Genetic and Molecular Network Analysis of Behavior. International review of neurobiology. 2012;104:135–157. doi: 10.1016/B978-0-12-398323-7.00006-9. [DOI] [PMC free article] [PubMed] [Google Scholar]
- Williams RW, Williams EG. Systems Genetics, Methods in Molecular Biology. Humana Press; Resources for systems genetics. In press. [Google Scholar]
- Wisdom AJ, Cao Y, Itoh N, Spence RD, Voskuhl RR. Estrogen receptor-β ligand treatment after disease onset is neuroprotective in the multiple sclerosis model. Journal of Neuroscience Research. 2013;91:901–908. doi: 10.1002/jnr.23219. [DOI] [PMC free article] [PubMed] [Google Scholar]
- Wise RA. Roles for nigrostriatal--not just mesocorticolimbic--dopamine in reward and addiction. Trends in Neurosciences. 2009;32:517–524. doi: 10.1016/j.tins.2009.06.004. [DOI] [PMC free article] [PubMed] [Google Scholar]
- Wolen AR, Phillips CA, Langston MA, Putman AH, Vorster PJ, Bruce NA, York TP, Williams RW, Miles MF. Genetic dissection of acute ethanol responsive gene networks in prefrontal cortex: functional and mechanistic implications. PloS One. 2012;7:e33575. doi: 10.1371/journal.pone.0033575. [DOI] [PMC free article] [PubMed] [Google Scholar]
- Yang H, Bell TA, Churchill GA, Pardo-Manuel de Villena F. On the subspecific origin of the laboratory mouse. Nature Genetics. 2007;39:1100–1107. doi: 10.1038/ng2087. [DOI] [PubMed] [Google Scholar]
- Ye R, Carneiro AMD, Airey D, Sanders-Bush E, Williams RW, Lu L, Wang J, Zhang B, Blakely RD. Evaluation of heritable determinants of blood and brain serotonin homeostasis using recombinant inbred mice. Genes, Brain, and Behavior. 2014;13:247–260. doi: 10.1111/gbb.12092. [DOI] [PMC free article] [PubMed] [Google Scholar]
- Zeng ZB. Precision mapping of quantitative trait loci. Genetics. 1994;136:1457–1468. doi: 10.1093/genetics/136.4.1457. [DOI] [PMC free article] [PubMed] [Google Scholar]
- Zeng ZB. Theoretical basis for separation of multiple linked gene effects in mapping quantitative trait loci. Proceedings of the National Academy of Sciences of the United States of America. 1993;90:10972–10976. doi: 10.1073/pnas.90.23.10972. [DOI] [PMC free article] [PubMed] [Google Scholar]
KEY REFERENCE (optional)
- Williams RW, Williams EG. Systems Genetics, Methods in Molecular Biology. Humana Press; Resources for systems genetics. In press. [Google Scholar]
- This is an excellent review that is intended to guide researchers through the process of designing mapping experiments and choosing appropriate mapping populations given the type of question under investigation.