In both animal models and human liver biopsy samples, elevated myeloperoxidase (MPO) activity can be imaged noninvasively with the molecular MR imaging probe MPO with gadolinium chelate, which suggested that MPO may be an imaging biomarker for inflammatory and oxidative disease activity in nonalcoholic fatty liver disease.
Abstract
Purpose
To test whether MPO-Gd, an activatable molecular magnetic resonance (MR) imaging agent specific for myeloperoxidase (MPO) activity, could detect MPO activity in nonalcoholic steatohepatitis (NASH) mouse models and human liver biopsy samples.
Materials and Methods
In this study, 20 leptin receptor–deficient and three MPO knockout mice were injected with endotoxin (lipopolysaccharide) or fed a methionine and choline–deficient (MCD) diet to induce experimental NASH and underwent MR imaging with MPO-Gd. Saline-injected and control diet–fed leptin receptor–deficient mice were used as respective controls. MPO protein and activity measurements and histologic analyses were performed. Eleven human liver biopsy samples underwent MPO-Gd–enhanced MR imaging ex vivo and subsequent histologic evaluation. Results were compared with Student t test or Mann-Whitney U test.
Results
With endotoxin, a significantly increased contrast-to-noise ratio (CNR) was found compared with sham (mean CNR, 1.81 [95% confidence interval {CI}: 1.53, 2.10] vs 1.02 [95% CI: 0.89, 1.14]; P = .03) at MPO-Gd MR imaging. In the diet-induced NASH model, an increased CNR was also found compared with sham mice (mean CNR, 1.33 [95% CI: 1.27, 1.40] vs 0.98 [95% CI: 0.83, 1.12]; P = .008). Conversely, CNR remained at baseline in NASH mice imaged with gadopentetate dimeglumine and in MPO knockout NASH mice with MPO-Gd, which proves specificity of MPO-Gd. Ex vivo molecular MR imaging of liver biopsy samples from NASH and control patients confirmed results from animal studies (mean CNR for NASH vs control patients, 2.61 [95% CI: 1.48, 3.74] vs 1.29 [95% CI: 1.06, 1.52]; P = .004).
Conclusion
MPO-Gd showed elevated MPO activity in NAFLD mouse models and human liver biopsy samples.
© RSNA, 2017
An earlier incorrect version of this article appeared online. This article was corrected on April 6, 2017.
Introduction
Nonalcoholic fatty liver disease (NAFLD) is the most common liver disease in the world, with prevalence between 14% and 45% (1), and it continues to increase as the prevalence of diabetes and obesity increases. NAFLD is a spectrum of disease that ranges from steatosis to nonalcoholic steatohepatitis (NASH) and cirrhosis. Whereas steatosis appears to be relatively benign (only 1.5% of patients progress to fibrosis or cirrhosis) (2), 30%–50% of patients with NASH progress eventually (3). Despite its widespread prevalence, there is no imaging technique to differentiate NASH from steatosis (4,5), and no laboratory test is yet clinically available or recommended (5,6). Diagnosis in patients suspected of having NASH requires a liver biopsy (6), which is an expensive and invasive procedure. In addition, complications (7), sampling error (8), and lack of interobserver agreement (9) are important concerns.
Inflammation and oxidative stress are key features of NASH and have been found to be crucial for fibrogenesis (10,11). Myeloperoxidase (MPO) is the most abundant proinflammatory and highly oxidizing inflammatory enzyme contained in neutrophil and monocyte granules (12). Both monocytes and neutrophils are increased in NASH (13,14). In an environment with high levels of hepatocyte-derived hydrogen peroxide and other reactive oxidative species, secreted MPO could potentiate oxidative stress and tissue damage. It was recently reported that human livers with NASH contain higher amounts of MPO compared with steatotic specimens (14) and that mice with an MPO-deficient hematopoietic system have decreased inflammation and fibrosis in a high-fat-diet–induced disease model of NASH (15). These results suggest that MPO could be a suitable biomarker to distinguish NASH from steatosis and also to evaluate disease activity.
Our aim was to test whether MPO-Gd (bis-5-hydroxytryptamide-diethylenetriaminepentaacetate-gadolinium), an activatable molecular magnetic resonance (MR) imaging agent specific for MPO, could detect MPO activity in NASH mouse models and human liver biopsy samples.
Materials and Methods
Induction of NASH and Animal Protocol
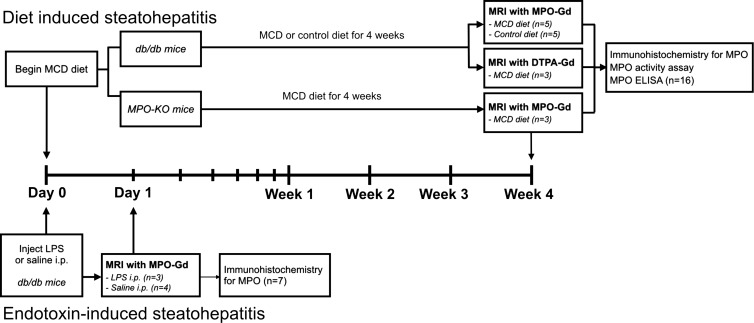
The protocol for animal experiments was approved by the Institutional Animal Care and Use Committee. The animal study flowchart can be seen in Figure 1 (n = 23). We used 20 8–10-week-old female leptin receptor–deficient db/db mice and three MPO knockout mice (Jackson Laboratories, Bar Harbor, Me). Db/db mice develop obesity and steatosis early in their life, but progression to NASH requires a second hit, such as low doses of lipopolysaccharide (LPS) (16) or MCD diet (17). Three db/db mice were intraperitoneally injected with 10 μg LPS (Sigma, St Louis, Mo) (16), and four db/db mice were injected with saline as control. Eight db/db mice were fed an MCD diet (Teklad Harlan, Indianapolis, Ind) for 4 weeks to induce NASH (17), and five mice were fed a control diet. Three MPO knockout mice were fed MCD diet for 4 weeks to induce NASH. Two different mouse models were used to replicate different aspects of the two-hit NASH hypothesis (18) (endotoxemia [19] and dysfunctional hepatic very low density lipoprotein secretion [20]). The body weight of all mice was measured once a week.
Figure 1:
Animal study flowchart. Seven leptin receptor–deficient (db/db) mice were either injected intraperitoneally (i.p.) with lipopolysaccharid (n = 3) or saline (n = 4) to study endotoxin-induced steatohepatitis. Molecular MR imaging with MPO-Gd performed 18 hours after injection. Livers were then harvested for immunohistochemistry against MPO. For diet-induced hepatitis, 13 db/db mice were fed methionine and choline-deficient (MCD, n = 8)) or control diet (n = 5) for 4 weeks. Then, MR imaging with MPO-Gd or gadopentetate dimeglumine was performed, and livers harvested for immunohistochemistry against MPO, MPO activity assay, and MPO enzyme-linked immmunosorbent assay. Also, three MPO knockout mice were fed MCD diet for 4 weeks and imaged with MPO-Gd.
Molecular MR Imaging
The mice were imaged with a 4.7-T small animal MR unit (Bruker, Cambridge, Mass) by using a 6-cm transmit-and-receive coil with a fat-suppressed respiratory gated rapid acquisition with relaxation enhancement T1-weighted examination (rapid acquisition with relaxation enhancement factor, 4; echo time [msec]/repetition time [msec], 8.48/873; effective echo time, 16.96; 12 signals acquired; 256 × 256 [0.16 mm × 0.16 mm]; 18 sections; section thickness, 1 mm) both before injection and at four time points (0–15, 15–30, 30–45, and 45–60 minutes) after injection of MPO-Gd (0.2 mmol/kg). MPO-Gd, which can detect extracellular MPO activity in vivo (21,22), was synthetized as described before (23). Activation of MPO-Gd by MPO increases molecular size and the activated sensor can bind to proteins, which results in increased and prolonged high signal intensity in areas of elevated MPO activity (23). To demonstrate specificity of the imaging agent, we also imaged three db/db NASH mice with gadopentetate dimeglumine (0.2 mmol/kg). Compared with MPO-Gd, gadopentetate dimeglumine is a conventional MR imaging agent structurally similar to MPO-Gd but without the MPO-sensing moieties, and thus cannot be activated by MPO. To further confirm specificity of MPO-Gd, we imaged three MPO knockout mice fed a MCD diet for 4 weeks with MPO-Gd.
MR Image Quantification
Regions of interests were drawn on precontrast and 60-minute postcontrast images to segment the entire liver and spinal cord (G.W., with 10 years of experience with MR imaging analysis). We used spinal cord to calculate the contrast-to-noise ratio (CNR) because there is no uptake of contrast agent because of the blood–spinal cord barrier. CNRs were then normalized to the CNR of a C57BL/6J control mouse. Liver CNR maps were also created on a voxel-by-voxel basis with the abovementioned method, and CNR maps were superimposed on T1 images to better view the MPO activity.
Immunohistochemistry
Fresh-frozen or paraffin-embedded livers were cut to 5-μm thickness and stained with purified anti-MPO (Ab-1; Fisher Scientific, Waltham, Mass). Biotinylated secondary antibodies followed by a Vectastain reagent (Vector Laboratories, Burlingame, Mass) were applied, and red reaction products were produced by 3-amino-9-ethylcarbazole (Dako, Carpinteria, Calif). Hematoxylin-eosin staining was performed for overall morphologic analysis. Quantification of MPO-positive cells and steatosis was performed by a blinded reviewer (B.P., with 6 years of experience). To allow for better viewing of positive cells at low magnification for whole liver lobes, MPO positively stained cells were also quantified by applying a color threshold with software (ImageJ; http://rsb.info.nih.gov/ij/). The NAFLD activity score was evaluated by two independent, blinded reviewers (B.P. and M.A., with 6 and 2 years of experience with histologic analysis, respectively) (24).
MPO Enzyme-linked Immmunosorbent Assay and Antibody-captured Activity Assay
Liver aliquots were homogenized in cetyltrimethylammonium bromide buffer (50 mmol/L potassium phosphate at pH 6.0 with 50 mmol/L cetyltrimethylammonium bromide), sonicated for 30 seconds, and centrifuged at 13 000 rotations per minute for 15 minutes. Supernatant was used for protein analysis with a bicinchoninic acid protein assay kit (Thermo Scientific, Waltham, Mass). A specific MPO antibody capture assay was used as previously described (25). Sandwich MPO enzyme-linked immunosorbent assay was performed according to the manufacturer’s protocol (category number HK210; Hycult Biotech, Plymouth Meeting, Pa).
Ex Vivo Imaging and Immunohistochemical Analysis of Human Liver Biopsy Samples
The protocol to collect and analyze human liver samples was approved by our institutional review board and a waiver of consent was granted. The study was conducted in accordance with the Declaration of Helsinki and compliant with the Health Insurance Portability and Accountability Act.
Five liver samples from patients with NASH and six samples from control patients were obtained. All patients underwent percutaneous liver biopsies. Core biopsy samples not used for imaging were evaluated for NASH by a blinded pathologist (R.M., with 3 years of experience) using the NAFLD activity score (24). Exclusion criteria were a history of other liver disease and a history of alcohol abuse (defined as >20 g alcohol per day). NASH was defined as an NAFLD activity score of 5 or greater (24). Clinical characteristics are in the Table. Biopsied liver samples were incubated in Dulbecco’s modified Eagle’s medium (Corning Life Sciences, Corning, NY). Precontrast MR imaging was performed with a 4.7-T MR imager (Pharmascan; Bruker) by using a 3.5-cm transmit-and-receive coil with T1 fast low-angle shot three-dimensional sequence with chemical-shift fat suppression (2.27/50; flip angle, 60°; four signals acquired; matrix, 210 × 210 × 210; 130-μm isotropic voxels). Glucose oxidase (as a hydrogen peroxide donor, considering that hydrogen peroxide has a very short biologic half-life; Affymetrix, Santa Clara, Calif) at a concentration of 1.4 ng/mL and MPO-Gd at a concentration of 1 mg/mL were added, and samples were incubated for 2 hours. Samples were then washed for 60 minutes, and MR images were acquired after administration of contrast agent. MPO-specific signal was calculated by two independent blinded reviewers (B.P. and M.W.Z., with 6 and 1 years of experience with MR imaging analysis, respectively) as CNR after divided by CNR before (CNR post/CNR pre). After imaging, samples were paraffin embedded, cut to 5-μm thickness, and stained for MPO by using the procedure previously mentioned. Clusters of MPO-positive cells per section were counted on at least three sections per patient by one blinded reviewer (B.P., with 6 years of experience). Few single MPO-positive cells were found in samples from both control and NASH patients. These were attributed to MPO expressing myeloid cells in the sinusoids, and thus not counted.
Clinical Characteristics and NAFLD Activity Score of Patients
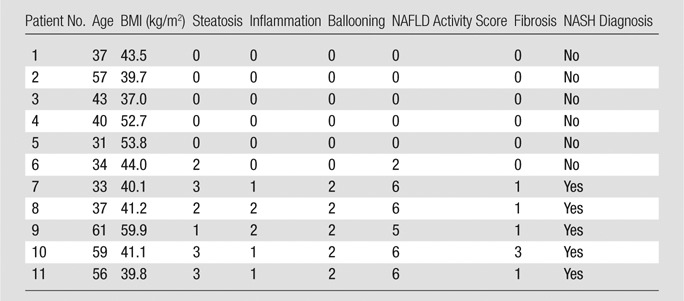
Note.—BMI = body mass index.
Statistical Analysis
Statistical analysis of the data was performed by using statistical software (GraphPad Prism; GraphPad Software, La Jolla, Calif). Results were expressed as mean and 95% confidence interval (CI). Median and interquartile range was used for NAFLD activity score. Statistical tests included Student t test (for normally distributed data) and Mann-Whitney U test (for nonnormally distributed data). Graphs were presented as scatterplots with standard error of the mean error bars. Body weights over the study period were shown as connected box plots with standard error of the mean error bars. A scatterplot with correlation line was shown for CNR and NAFLD activity score, and R 2 assuming independent, normally distributed, and noncontrolled variables was calculated. Spearman ρ was also calculated. A P value equal or less than .05 was considered to indicate statistical significance.
Results
MPO Activity Elevated in an Endotoxin-induced Steatohepatitis Model
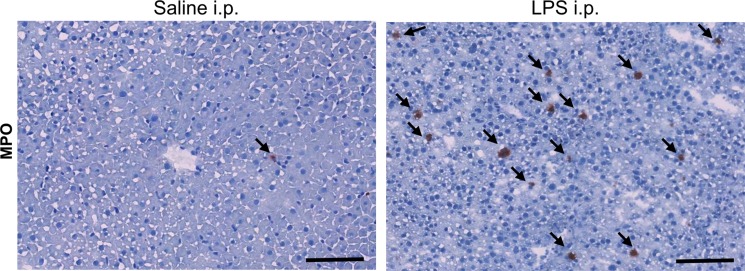
In db/db mice injected with LPS, we detected elevated MPO activity at 15 minutes and more so on images acquired 60 minutes after administration of contrast agent and as viewed on CNR maps (Fig 2a, 2b). Voxel-by-voxel image quantification confirmed that the CNR values acquired 60 minutes after contrast agent administration (referred to here as 60-minute CNRs) were significantly elevated in the livers of LPS-injected mice compared with the CNR values of saline-injected mice (CNR, 1.81 [95% CI: 1.53, 2.10] vs 1.02 [95% CI: 0.89, 1.14]; P = .03, Mann-Whitney U test; Fig 2c). Continued MPO-Gd activation over time with inflammation but without steatosis (ie, the saline group) is observed at time-intensity analysis (Fig E1a [online]). MPO upregulation in mice injected with LPS was also confirmed by immunohistochemistry for MPO, which showed numerous MPO-positive cells accumulating in the liver parenchyma (Fig 2d). Thus, these data reveal that MPO is elevated and can be observed noninvasively in livers of mice with endotoxemia-induced liver injury.
Figure 2a:
Molecular MR imaging of LPS-induced steatohepatitis. (a, b) Precontrast, 15 minutes and 60 minutes after MPO-Gd injection T1-weighted MR images, and CNR maps of db/db mice injected with LPS (a) or saline (b) demonstrate increased signal at 15 and even more at 60 minutes after contrast agent injection, and this is confirmed on CNR maps and voxel-by-voxel quantification of MPO-Gd MR imaging (c). (d) Immunohistochemistry demonstrates increase in MPO-positive cells with LPS compared with control (arrows; bar = 100 μm). All data are mean ± standard error of the mean. * P < .05. i.p. = intraperitoneal.
Figure 2b:
Molecular MR imaging of LPS-induced steatohepatitis. (a, b) Precontrast, 15 minutes and 60 minutes after MPO-Gd injection T1-weighted MR images, and CNR maps of db/db mice injected with LPS (a) or saline (b) demonstrate increased signal at 15 and even more at 60 minutes after contrast agent injection, and this is confirmed on CNR maps and voxel-by-voxel quantification of MPO-Gd MR imaging (c). (d) Immunohistochemistry demonstrates increase in MPO-positive cells with LPS compared with control (arrows; bar = 100 μm). All data are mean ± standard error of the mean. * P < .05. i.p. = intraperitoneal.
Figure 2c:
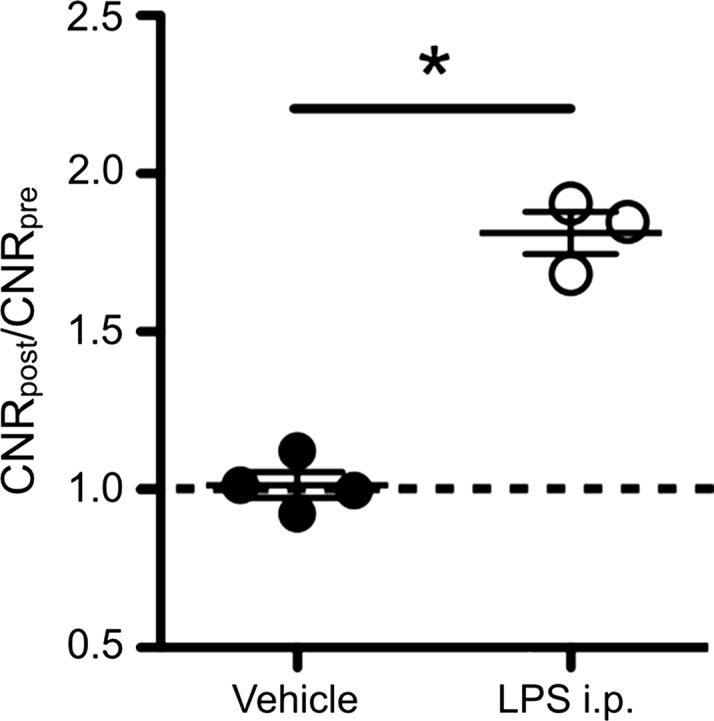
Molecular MR imaging of LPS-induced steatohepatitis. (a, b) Precontrast, 15 minutes and 60 minutes after MPO-Gd injection T1-weighted MR images, and CNR maps of db/db mice injected with LPS (a) or saline (b) demonstrate increased signal at 15 and even more at 60 minutes after contrast agent injection, and this is confirmed on CNR maps and voxel-by-voxel quantification of MPO-Gd MR imaging (c). (d) Immunohistochemistry demonstrates increase in MPO-positive cells with LPS compared with control (arrows; bar = 100 μm). All data are mean ± standard error of the mean. * P < .05. i.p. = intraperitoneal.
Figure 2d:
Molecular MR imaging of LPS-induced steatohepatitis. (a, b) Precontrast, 15 minutes and 60 minutes after MPO-Gd injection T1-weighted MR images, and CNR maps of db/db mice injected with LPS (a) or saline (b) demonstrate increased signal at 15 and even more at 60 minutes after contrast agent injection, and this is confirmed on CNR maps and voxel-by-voxel quantification of MPO-Gd MR imaging (c). (d) Immunohistochemistry demonstrates increase in MPO-positive cells with LPS compared with control (arrows; bar = 100 μm). All data are mean ± standard error of the mean. * P < .05. i.p. = intraperitoneal.
MPO Activity Elevated in a Diet-induced Steatohepatitis Model
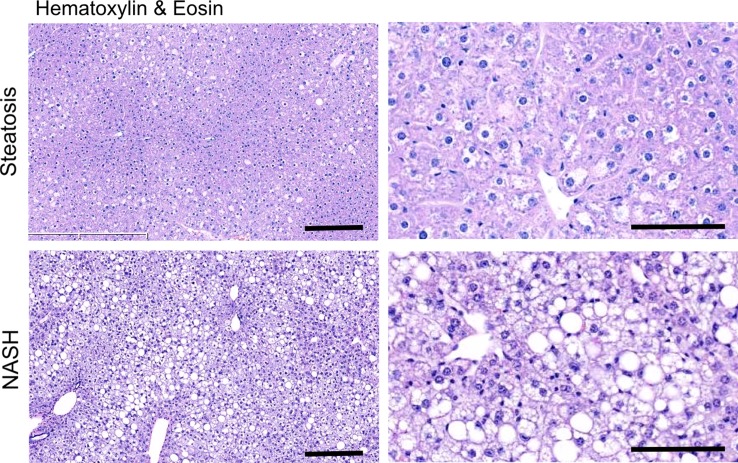
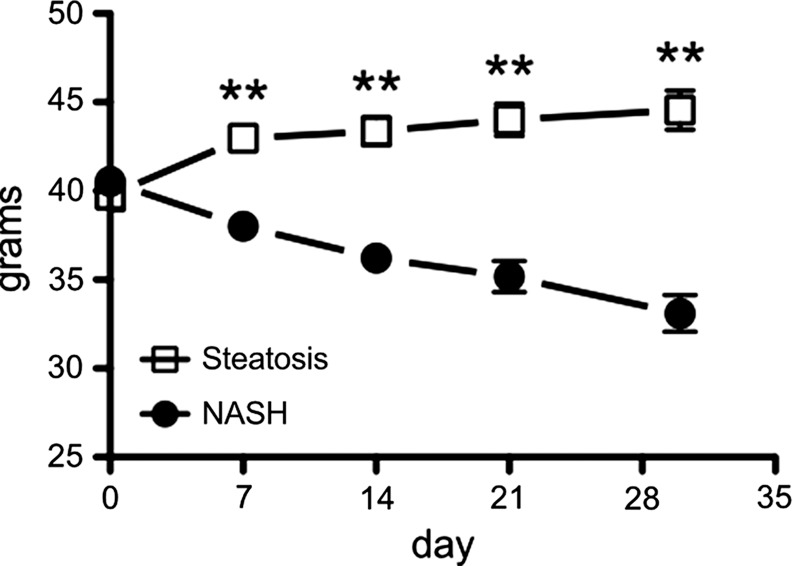
After 4 weeks of feeding db/db mice an MCD diet, we found a marked increase in steatosis at histologic analysis compared with db/db mice fed a control diet (mean steatosis, 32.0% [95% CI: 20.7%, 43.3%] vs 5.9% [95% CI: 2.8%, 8.9%], respectively; P = .007, t test; Fig 3a, 3b). In addition, we found a steady decrease in body weight, which was first significant at 1 week (mean, 38.0 g [95% CI: 36.2, 39.8] vs 43.0 g [95% CI: 41.1, 44.8], respectively; P = .002, Mann-Whitney U test) and continued to decrease over the study period (mean decrease at 4 weeks, 33.1 g [95% CI: 30.5, 35.8] vs 44.6 g [95% CI: 41.7, 47.4], respectively; P = .002, Mann-Whitney U test; Fig 3c). Liver weight after 4 weeks was also markedly reduced for the db/db mice fed an MCD diet versus those who were fed the control diet (mean, 752 mg [95% CI: 664, 839] vs 1472 mg [95% CI: 1291, 1653], respectively; P < .001, t test; Fig 3d). At histologic analysis, we detected higher NAFLD activity scores in mice fed with MCD diet for 4 weeks (median score, 7.7 [interquartile range, 7.0–9.0] vs 1.7 [interquartile range, 1.0–3.0], respectively; P = .003, t test; Fig 3d), with destruction of normal liver architecture and infiltrating inflammatory cells (Fig 3a). Overall, these results confirm successful induction of NASH after 4 weeks of MCD diet in these mice.
Figure 3a:
Db/db mice fed MCD diet developed NASH per histologic criteria. (a) Hematoxylin-eosin–stained liver sections show markedly increased steatosis, lobular inflammation, and hepatocyte ballooning in NASH compared with steatosis (left: 50×, bar = 250 μm; and right: 200× magnification, bar = 100 μm). (b) Histologic quantification of steatosis in NASH compared with steatosis. (c) Body weight decreased continuously on MCD diet, whereas control mice gained weight over the 4-week study period. (d) Liver weight decreased in these mice. (e) NAFLD activity score was higher in mice fed MCD diet compared with control mice. ** P < .01, *** P < .001. All data are mean ± standard error of the mean.
Figure 3b:
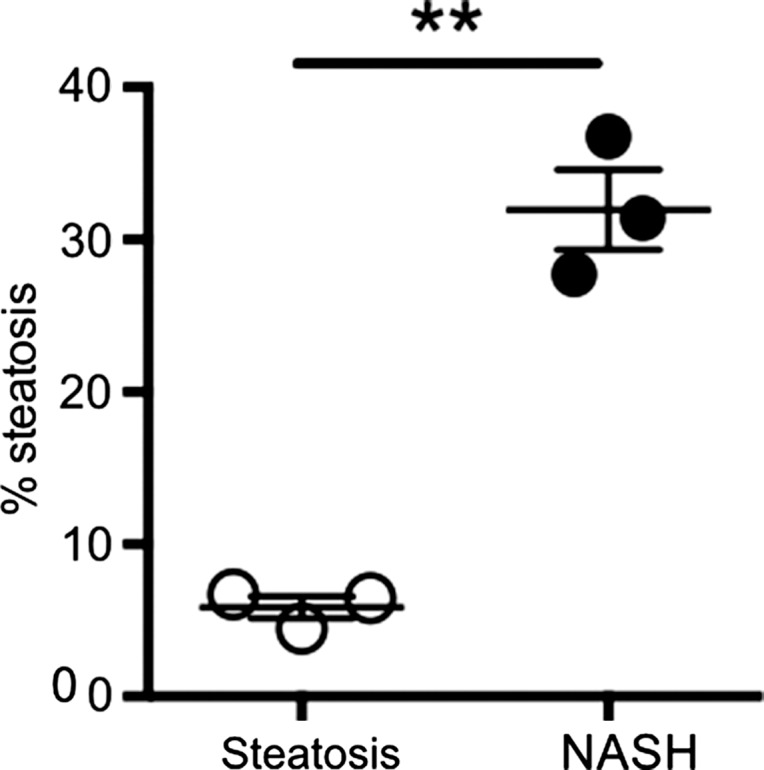
Db/db mice fed MCD diet developed NASH per histologic criteria. (a) Hematoxylin-eosin–stained liver sections show markedly increased steatosis, lobular inflammation, and hepatocyte ballooning in NASH compared with steatosis (left: 50×, bar = 250 μm; and right: 200× magnification, bar = 100 μm). (b) Histologic quantification of steatosis in NASH compared with steatosis. (c) Body weight decreased continuously on MCD diet, whereas control mice gained weight over the 4-week study period. (d) Liver weight decreased in these mice. (e) NAFLD activity score was higher in mice fed MCD diet compared with control mice. ** P < .01, *** P < .001. All data are mean ± standard error of the mean.
Figure 3c:
Db/db mice fed MCD diet developed NASH per histologic criteria. (a) Hematoxylin-eosin–stained liver sections show markedly increased steatosis, lobular inflammation, and hepatocyte ballooning in NASH compared with steatosis (left: 50×, bar = 250 μm; and right: 200× magnification, bar = 100 μm). (b) Histologic quantification of steatosis in NASH compared with steatosis. (c) Body weight decreased continuously on MCD diet, whereas control mice gained weight over the 4-week study period. (d) Liver weight decreased in these mice. (e) NAFLD activity score was higher in mice fed MCD diet compared with control mice. ** P < .01, *** P < .001. All data are mean ± standard error of the mean.
Figure 3d:
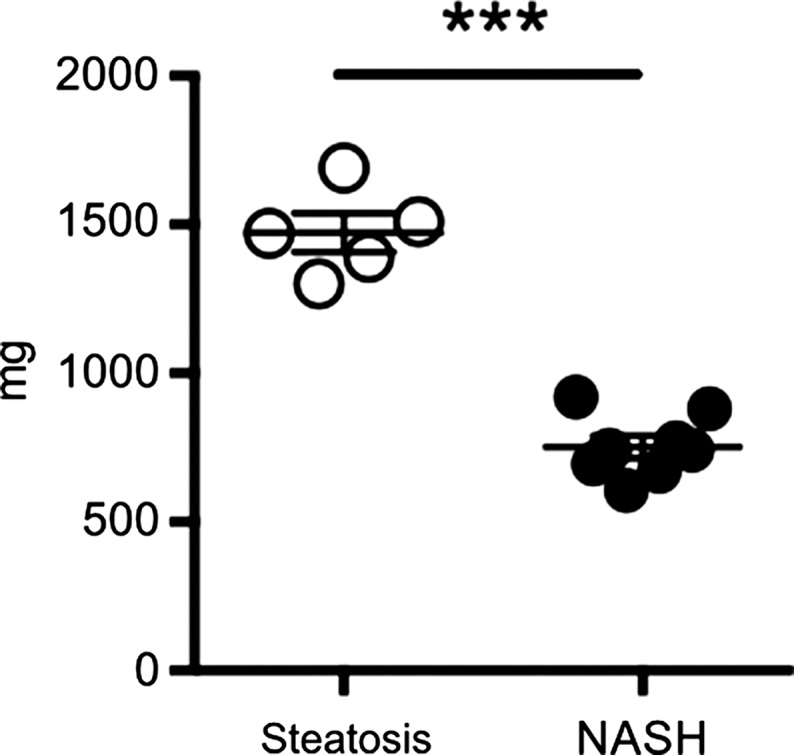
Db/db mice fed MCD diet developed NASH per histologic criteria. (a) Hematoxylin-eosin–stained liver sections show markedly increased steatosis, lobular inflammation, and hepatocyte ballooning in NASH compared with steatosis (left: 50×, bar = 250 μm; and right: 200× magnification, bar = 100 μm). (b) Histologic quantification of steatosis in NASH compared with steatosis. (c) Body weight decreased continuously on MCD diet, whereas control mice gained weight over the 4-week study period. (d) Liver weight decreased in these mice. (e) NAFLD activity score was higher in mice fed MCD diet compared with control mice. ** P < .01, *** P < .001. All data are mean ± standard error of the mean.
Figure 3e:
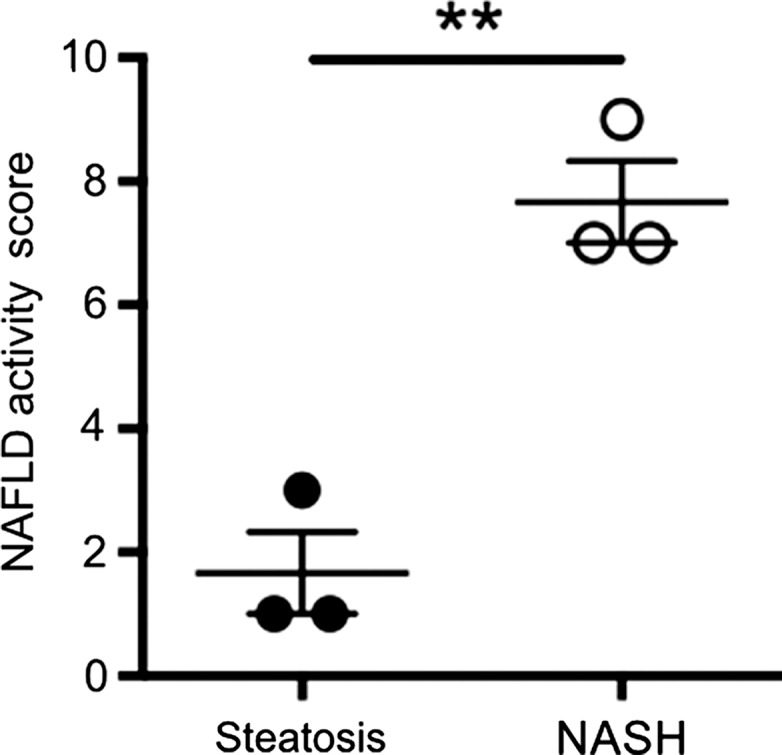
Db/db mice fed MCD diet developed NASH per histologic criteria. (a) Hematoxylin-eosin–stained liver sections show markedly increased steatosis, lobular inflammation, and hepatocyte ballooning in NASH compared with steatosis (left: 50×, bar = 250 μm; and right: 200× magnification, bar = 100 μm). (b) Histologic quantification of steatosis in NASH compared with steatosis. (c) Body weight decreased continuously on MCD diet, whereas control mice gained weight over the 4-week study period. (d) Liver weight decreased in these mice. (e) NAFLD activity score was higher in mice fed MCD diet compared with control mice. ** P < .01, *** P < .001. All data are mean ± standard error of the mean.
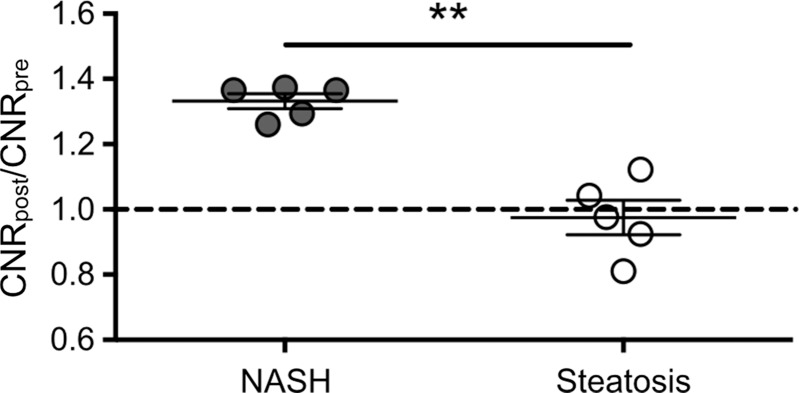
Similar to the LPS-injected mice, we detected elevated MPO activity observed by enhancement on 15- and 60-minutes postcontrast MPO-Gd images (Fig 4a, 4b). Voxel-by-voxel image quantification demonstrated that the 60-minute CNRs were indeed elevated in db/db NASH mice compared with steatotic db/db mice on the control diet imaged with MPO-Gd (mean CNR, 1.33 [95% CI: 1.27, 1.40] vs 0.98 [95% CI: 0.83, 1.12], respectively; P = .008, Mann-Whitney U test; Fig 4c). While MPO-specific enhancement could be observed with MPO-Gd at 15 minutes and more so at 60 minutes after injection of contrast agent, we did not observe enhancement in db/db NASH mice imaged with gadopentetate dimeglumine or in MPO knockout NASH mice imaged with MPO-Gd(Fig E2a–E2c [online]). Voxel-by-voxel image quantification confirmed elevated CNR in db/db NASH mice imaged with MPO-Gd, while CNR remained at baseline in MPO knockout NASH mice (mean CNR, 0.97 [95% CI: 0.66, 1.29] vs 0.98 [95% CI: 0.83, 1.12]; P = .68, Mann-Whitney U test) and also in db/db NASH mice imaged with gadopentetate dimeglumine (mean CNR, 0.99 [95% CI: 0.74, 1.23] vs 0.98 [95% CI: 0.83, 1.12], respectively; P = 1.0, Mann-Whitney U test; Fig E2d [online]). Compared with db/db NASH mice imaged with gadopentetate dimeglumine and MPO knockout NASH mice imaged with MPO-Gd, CNRs were elevated in db/db NASH mice imaged with MPO-Gd (mean CNR, 0.99 [95% CI: 0.74, 1.23] vs 0.98 [95% CI: 0.83, 1.12] vs 1.33 [95% CI: 1.27, 1.40], respectively; P = .04 and .04, respectively, Mann-Whitney U test). Continued MPO-Gd activation over time with inflammation but not control groups is observed at time-intensity analysis (Fig E1b [online]). These data demonstrate that MPO-Gd–enhanced molecular MR imaging is specific to MPO and can help to view MPO activity to distinguish between steatosis and NASH in this diet-induced NASH model.
Figure 4a:
Molecular MPO-Gd–enhanced MR imaging depicted inflammatory activity in diet-induced NASH. (a, b) Precontrast, 15 minutes, and 60 minutes after MPO-Gd injection on T1-weighted MR images, and CNR maps of mice with diet-induced NASH (a) and steatosis (b). An increased signal was seen at 60 minutes after injection of contrast agent (a), which reflected elevated in vivo MPO activity. This was also demonstrated by the CNR map (higher values represent higher MPO activity). In mice with steatosis, no enhancement was observed at 15 or 60 minutes after MPO-Gd injection, indicating absence of MPO activity and thus inflammation. (c) MR imaging of whole-liver voxel-by-voxel quantification showed sensitivity of MPO-Gd in NASH and steatosis. ** P < .01. All data are mean ± standard error of the mean.
Figure 4b:
Molecular MPO-Gd–enhanced MR imaging depicted inflammatory activity in diet-induced NASH. (a, b) Precontrast, 15 minutes, and 60 minutes after MPO-Gd injection on T1-weighted MR images, and CNR maps of mice with diet-induced NASH (a) and steatosis (b). An increased signal was seen at 60 minutes after injection of contrast agent (a), which reflected elevated in vivo MPO activity. This was also demonstrated by the CNR map (higher values represent higher MPO activity). In mice with steatosis, no enhancement was observed at 15 or 60 minutes after MPO-Gd injection, indicating absence of MPO activity and thus inflammation. (c) MR imaging of whole-liver voxel-by-voxel quantification showed sensitivity of MPO-Gd in NASH and steatosis. ** P < .01. All data are mean ± standard error of the mean.
Figure 4c:
Molecular MPO-Gd activity in diet-induced NASH. (a, b) Precontrast, 15 minutes, and 60 minutes after MPO-Gd injection on T1-weighted MR images, and CNR maps of mice with diet-induced NASH (a) and steatosis (b). An increased signal was seen at 60 minutes after injection of contrast agent (a), which reflected elevated in vivo MPO activity. This was also demonstrated by the CNR map (higher values represent higher MPO activity). In mice with steatosis, no enhancement was observed at 15 or 60 minutes after MPO-Gd injection, indicating absence of MPO activity and thus inflammation. (c) MR imaging of whole-liver voxel-by-voxel quantification showed sensitivity of MPO-Gd in NASH and steatosis. ** P < .01. All data are mean ± standard error of the mean.
MPO Activity and Protein Expression Elevation in Diet-induced NASH versus Steatosis
With MPO enzyme-linked immunosorbent assay and MPO activity assays, we detected in livers of NASH mice compared with livers of mice with steatosis a significant increase of MPO protein (mean, 17.9 ng/mg [95% CI: 14.2, 21.5] vs 2.5 ng/mg [95% CI: −0.35, 5.5], respectively; P = .002, Mann-Whitney U test) and MPO activity (mean, 0.0818 U/mg [95% CI: 0.068, 0.096] vs 0.0009 U/mg [95% CI: 0.0001, 0.002], respectively; P = .002, Mann-Whitney U test) (Fig E3c [online]). At immunohistochemistry analysis, we detected an increase in MPO-positive cells (mean cells per high-power field, 14.7 [95% CI: 5.9, 23.4] vs 0.3 [95% CI: −1.1, 1.8], respectively; P = .002, t test). In addition, 60-minute CNR at MPO imaging strongly correlated with the NAFLD activity score (R 2, 0.91 [P = .03]; Spearman ρ, 0.88 [P = .04]; n = 6; Fig E3d [online]). These results confirmed the imaging findings that MPO is elevated in diet-induced NASH.
MPO-Gd Molecular MR Imaging Detection of Elevated MPO Activity in Human Liver Biopsy Samples ex Vivo
Clinical and histologic characteristics of patients with biopsy-proven NASH and control patients are provided in the Table. There was no difference regarding age (mean age, NASH vs control patients, 49.2 years [95% CI: 32.9, 65.5] vs 40.3 years [95% CI: 30.7, 50.0]; P = .22, t test) or body mass index (mean, 44.4 kg/m2 [95% CI: 33.7, 55.2] vs 45.1 kg/m2 [95% CI: 38.0, 52.3]; P = .88, t test). As expected, NASH patients had higher NAFLD activity subscores in steatosis (median, 3 [interquartile range, 1.5–3] vs 0 [interquartile range, 0–0.5], respectively), inflammation (median, 1 [interquartile range, 1.5–3] vs 0 [interquartile range, 0–0], respectively), fibrosis (median, 1 [interquartile range, 1–2] vs 0 [interquartile range, 0–0], respectively), and hepatocyte ballooning (median, 2 [interquartile range, 2–2] vs 0 [interquartile range, 0–0], respectively) and a higher total NAFLD activity score (median, 6 [interquartile range, 5.5–6] vs 0 [interquartile range, 0–0.5], respectively; P = .004, Mann-Whitney U test; Table).
Ex vivo molecular MR imaging with MPO-Gd demonstrated a significant increase in CNR in samples from NASH patients versus control (mean, 2.61 [95% CI: 1.48, 3.74] vs 1.29 [95% CI: 1.06, 1.52]; P = .004, Mann-Whitney U test; Fig 5a–5c). Correlating with these results, we found more clusters of MPO-positive cells at histologic analysis in samples from NASH versus control patients (mean, 5.60 [95% CI: 3.72, 7.48] vs 1.00 [95% CI: 0.06, 1.94]; P = .002, Mann-Whitney U test; Fig 5d). These data demonstrate feasibility of imaging human tissue with MPO-Gd and confirm the presence of MPO in patients with NASH.
Figure 5a:
Molecular MPO-Gd enhanced MR imaging shows MPO activity in liver biopsy samples of NASH patients. (a, b) Pseudo-colored images of liver biopsy samples before and after contrast enhancement from NASH (top row) and control patients (middle row); the biopsy sample is outlined with dashed line. Increased signal after incubation with MPO-Gd is seen on samples from NASH patients, but not control patients, and this is confirmed at voxel-by-voxel image quantification (c). (d) Immunohistochemistry for MPO in liver biopsy samples from NASH (middle) and control patients (left) (bar = 100 μm) demonstrated clusters of MPO-expressing cells in samples from NASH patients but not in samples from control patients. Quantification (d, right) confirms increased number of MPO-positive cell clusters in NASH versus control patients. ** P < .01. All data are mean ± standard error of the mean.
Figure 5c:
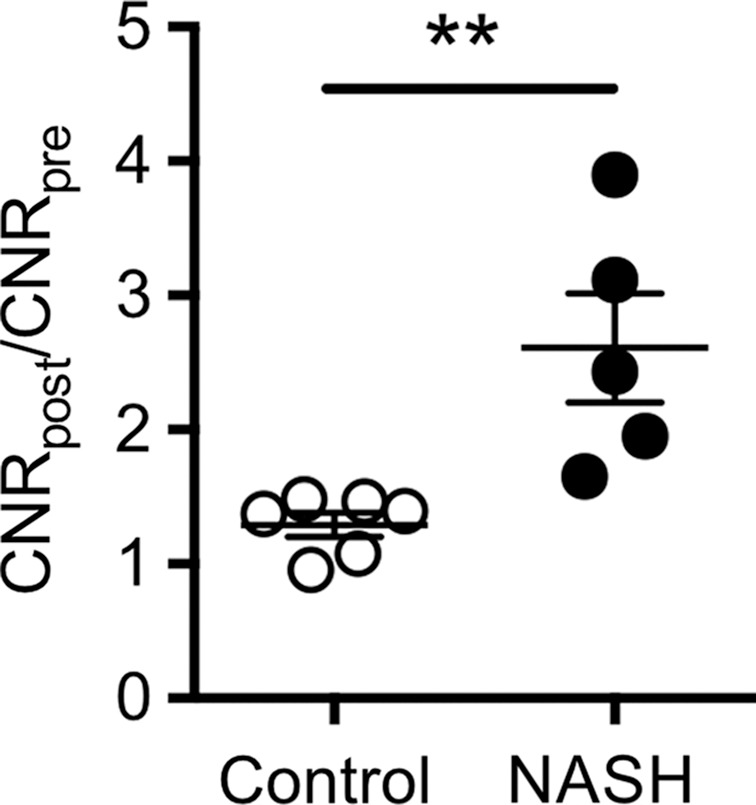
Molecular MPO-Gd enhanced MR imaging shows MPO activity in liver biopsy samples of NASH patients. (a, b) Pseudo-colored images of liver biopsy samples before and after contrast enhancement from NASH (top row) and control patients (middle row); the biopsy sample is outlined with dashed line. Increased signal after incubation with MPO-Gd is seen on samples from NASH patients, but not control patients, and this is confirmed at voxel-by-voxel image quantification (c). (d) Immunohistochemistry for MPO in liver biopsy samples from NASH (middle) and control patients (left) (bar = 100 μm) demonstrated clusters of MPO-expressing cells in samples from NASH patients but not in samples from control patients. Quantification (d, right) confirms increased number of MPO-positive cell clusters in NASH versus control patients. ** P < .01. All data are mean ± standard error of the mean.
Figure 5d:
Molecular MPO-Gd enhanced MR imaging shows MPO activity in liver biopsy samples of NASH patients. (a, b) Pseudo-colored images of liver biopsy samples before and after contrast enhancement from NASH (top row) and control patients (middle row); the biopsy sample is outlined with dashed line. Increased signal after incubation with MPO-Gd is seen on samples from NASH patients, but not control patients, and this is confirmed at voxel-by-voxel image quantification (c). (d) Immunohistochemistry for MPO in liver biopsy samples from NASH (middle) and control patients (left) (bar = 100 μm) demonstrated clusters of MPO-expressing cells in samples from NASH patients but not in samples from control patients. Quantification (d, right) confirms increased number of MPO-positive cell clusters in NASH versus control patients. ** P < .01. All data are mean ± standard error of the mean.
Figure 5b:
Molecular MPO-Gd enhanced MR imaging shows MPO activity in liver biopsy samples of NASH patients. (a, b) Pseudo-colored images of liver biopsy samples before and after contrast enhancement from NASH (top row) and control patients (middle row); the biopsy sample is outlined with dashed line. Increased signal after incubation with MPO-Gd is seen on samples from NASH patients, but not control patients, and this is confirmed at voxel-by-voxel image quantification (c). (d) Immunohistochemistry for MPO in liver biopsy samples from NASH (middle) and control patients (left) (bar = 100 μm) demonstrated clusters of MPO-expressing cells in samples from NASH patients but not in samples from control patients. Quantification (d, right) confirms increased number of MPO-positive cell clusters in NASH versus control patients. ** P < .01. All data are mean ± standard error of the mean.
Discussion
Our study establishes MPO as an imaging biomarker that noninvasively distinguishes NASH from steatosis in two different murine models of NAFLD. Unlike quantification of fibrosis or steatosis, this provides information on the inflammatory activity and oxidative stress in the liver at the time of imaging. Upon translation, this could enable noninvasive diagnosis of NASH and identification of patients with high disease activity for whom treatment could be helpful. Lastly, imaging could be used to assess treatment effects because lack of suitable biomarkers hampers clinical trials and drug development in NAFLD.
We used two well-established mouse models of NAFLD and NASH and translated our findings from these animal studies to humans by performing ex vivo imaging of liver biopsy samples. First, LPS injection into obese mice has been found to trigger steatohepatitis (16), and endotoxemia has been shown to be important in NASH patients (26). Rats with bacterial overgrowth show signs of hepatic inflammation (27), and patients have developed NASH after intestinal bypass that responds to antibiotics (28). Twenty-four hours after LPS injection, we detected infiltration of MPO-secreting cells on liver sections, and high liver MPO activity in vivo, which demonstrates that MPO-Gd can measure inflammation in endotoxemia-induced steatohepatitis. Second, we fed obese db/db mice an MCD diet for 4 weeks, which has been shown to efficiently trigger inflammation and early fibrotic changes (17). In our study, we detected inflammation and high levels of MPO protein and enzymatic activity and were able to confirm this noninvasively in vivo by using MPO-Gd molecular MR imaging. Importantly, both models of NAFLD are thought to recapitulate the two- or multiple-hit hypothesis of NAFLD (29). Db/db mice develop steatosis early in their life but do not progress to steatohepatitis without a so-called second hit, which was endotoxemia or MCD diet in our study.
MR imaging is a useful tool for liver disease characterization because it is noninvasive, has deep tissue penetration and high spatial resolution, is able to examine the entire organ, and does not involve ionizing radiation. However, liver biopsy, the current reference standard for diagnosis of NASH (6), is an invasive procedure with associated risks (7). Furthermore, inflammatory foci tend to be heterogeneously distributed in the liver parenchyma and only a small sample of the liver can be evaluated. Therefore, for patients in need of biopsy, MPO-Gd imaging could also guide biopsy to avoid sampling error by revealing the areas of elevated inflammation.
Steatosis can be detected and quantified with several imaging techniques, including ultrasonography, CT, MR imaging, and MR spectroscopy (30), and cirrhosis can also be identified on these modalities (31). However, steatosis grade is not predictive of progression (3), and cirrhosis is generally seen as the end stage of the disease spectrum with limited therapeutic options. A few preclinical (32) and clinical studies (33,34) were conducted on NAFLD. However, these methods do not directly image inflammation but rather parenchyma stiffness, which is a surrogate marker for liver fibrosis (33), and therefore lack sensitivity to detect early inflammation in NASH. Also, direct detection of liver collagen is likely less sensitive in early disease stages compared with inflammation or oxidative stress. An approach (34) that used phosphorus MR spectroscopy to evaluate hepatocellular metabolism showed only modest success in distinguishing NASH from steatosis and used a technique not widely available, and the importance of the measured markers in NAFLD are unclear at this time. Studies regarding imaging inflammation are even more sparse (35,36) and rely on microbubble retention (35) or iron oxide phagocytosis (36) as surrogate markers for inflammation. Therefore, to our knowledge, none of these methods has been recommended for clinical use at this time (6). Inflammation and oxidative stress are key features of NASH and have been found to be crucial for fibrogenesis (10,11). Our results indicate that MPO-Gd is capable of assessing activity of the inflammatory enzyme MPO noninvasively. This allows tracking of inflammatory and oxidative disease activity in NAFLD, and therefore differentiation of steatosis from steatohepatitis at a time when little fibrosis is present. Considering that mouse MPO is only about 10%–20% as active as human MPO (37), the MR signal would likely be even stronger at translation to humans. Compatible with this, we found a CNR of 2.6 in human liver biopsy samples compared with 1.3–1.8 in mouse experiments, but differences in the experimental setup (in vivo animal vs ex vivo biopsy sample imaging) may also contribute to this difference. Signal specific to MPO also correlated positively with the NAFLD activity score, which may allow for further noninvasive stratification of NASH patients by inflammatory activity. However, this may be limited by the dichotomized animal model (inflammation vs no inflammation) used and will require further validation.
Limitations of our study include that no NASH model entirely replicates all human pathologic features because the pathogenesis remains incompletely understood. However, we have addressed this shortcoming by using two different animal models that mimic different aspects of the disease (16,17) and by confirming results in human biopsy samples. In addition, specificity is a crucial aspect of molecular imaging agents. Specificity of MPO-Gd in vivo has been demonstrated previously in myocardial infarction (38) and stroke (22). MPO-Gd is an activatable probe that is oxidized by MPO. The oxidized form can combine to form oligomers and bind to proteins, all of which results in shortening of the proton T1 and increased T1 signal in MR imaging, as well as prolonged enhancement because of probe retention (23). In our study, to further confirm specificity of MPO-Gd in liver disease, we performed two additional experiments. We injected a group of NASH mice with gadopentetate dimeglumine, which cannot be activated by MPO. While we found increased CNR on delayed images with MPO-Gd, no such increase was observed with gadopentetate dimeglumine. In addition, we also did not detect increased CNR in MPO knockout mice with NASH injected with MPO-Gd, which further confirms the specificity of MPO-Gd. It should be noted, however, that while MPO-Gd is specific for MPO activity in vivo, elevated MPO activity can be observed in a variety of liver diseases, including viral hepatitis (39) and alcoholic steatohepatitis (40).
In conclusion, we demonstrated that MPO was elevated in two mouse models of steatohepatitis and in human liver biopsies of NASH patients, while it was not in obese mice with simple steatosis or control patients. In both the animal models and human liver biopsy samples, elevated MPO activity could be imaged noninvasively with the molecular MR imaging probe MPO-Gd, which suggested that MPO may be an imaging biomarker for inflammatory and oxidative disease activity in NAFLD.
Advances in Knowledge
■ Myeloperoxidase (MPO) activity is elevated in both endotoxin and diet-induced animal models of nonalcoholic steatohepatitis (NASH) and can be detected at molecular MR imaging with MPO-Gd (mean contrast-to-noise ratio [CNR] for endotoxin vs saline injection, 1.81 [95% confidence interval {CI}: 1.53, 2.10] vs 1.02 [95% CI: 0.89, 1.14]; P = .03; mean CNR for methionine and choline deficient diet vs control diet, 1.33 [95% CI: 1.27, 1.40] vs 0.98 [95% CI: 0.83, 1.12]; P = .007).
■ No increased MR signal was detected in mice with NASH that underwent conventional gadolinium chelate–enhanced MR imaging (mean CNR, 0.99; 95% CI: 0.74, 1.22) or in mice with MPO knockout NASH imaged with MPO-Gd (mean CNR, 0.97; 95% CI: 0.66, 1.29), which proved the specificity of MPO-Gd.
■ Ex vivo MPO-Gd–enhanced molecular MR imaging of liver biopsy samples from patients with NASH and control patients also demonstrated increased MPO activity in vivo (mean CNR, 2.61 [95% CI: 1.48, 3.74] vs 1.29 [95% CI: 1.06, 1.52]; P = .004), which confirmed results from animal studies.
Implication for Patient Care
■ By considering that inflammation and oxidative stress are key features of NASH and have been found to be crucial for fibrogenesis, MPO imaging could allow for noninvasive detection of oxidative or inflammatory disease activity in patients with nonalcoholic fatty liver disease upon clinical translation.
SUPPLEMENTAL FIGURES
Received March 9, 2016; revision requested May 2; revision received October 5; accepted November 11; final version accepted January 18, 2017.
K.E.C. supported by National Institutes of Health (K23-099422). B.P. supported by National Natural Science Foundation (postdoctoral fellowship grant) and Ernst Schering Foundation (doctoral fellowship grant). J.W.C. supported by National Institute of Neurologic Disorders and Stroke (R01-NS070835, R01-NS072167).
Disclosures of Conflicts of Interest: B.P. disclosed no relevant relationships. G.W. disclosed no relevant relationships. Y.I. disclosed no relevant relationships. M.A. disclosed no relevant relationships. M.W.Z. disclosed no relevant relationships. L.B. disclosed no relevant relationships. C.W. disclosed no relevant relationships. Y.C. disclosed no relevant relationships. R.M. disclosed no relevant relationships. A.R.G. Activities related to the present article: disclosed consulting fees or honoraria from Phillips and Siemens; disclosed support for travel to meetings for the study or other purposes from Phillips. Activities not related to the present article: disclosed expert testimony for the U.S. Department of Justice and Rice, Dolan, Kershaw; received payment from Siemens for lectures. Other relationships: disclosed no relevant relationships. K.E.C. disclosed no relevant relationships. J.W.C. Activities related to the present article: disclosed no relevant relationships. Activities not related to the present article: disclosed issued patent for Imaging Enzymatic Activity. Other relationships: disclosed no relevant relationships.
Abbreviations:
- CI
- confidence interval
- CNR
- contrast-to-noise ratio
- LPS
- lipopolysaccharide
- MCD
- methionine and choline deficient
- MPO
- myeloperoxidase
- NAFLD
- nonalcoholic fatty liver disease
- NASH
- nonalcoholic steatohepatitis
References
- 1.Bellentani S, Marino M. Epidemiology and natural history of non-alcoholic fatty liver disease (NAFLD). Ann Hepatol 2009;8(Suppl 1):S4–S8. [PubMed] [Google Scholar]
- 2.Adams LA, Lymp JF, St Sauver J, et al. The natural history of nonalcoholic fatty liver disease: a population-based cohort study. Gastroenterology 2005;129(1):113–121. [DOI] [PubMed] [Google Scholar]
- 3.Ekstedt M, Franzén LE, Mathiesen UL, et al. Long-term follow-up of patients with NAFLD and elevated liver enzymes. Hepatology 2006;44(4):865–873. [DOI] [PubMed] [Google Scholar]
- 4.Saadeh S, Younossi ZM, Remer EM, et al. The utility of radiological imaging in nonalcoholic fatty liver disease. Gastroenterology 2002;123(3):745–750. [DOI] [PubMed] [Google Scholar]
- 5.Dowman JK, Tomlinson JW, Newsome PN. Systematic review: the diagnosis and staging of non-alcoholic fatty liver disease and non-alcoholic steatohepatitis. Aliment Pharmacol Ther 2011;33(5):525–540. [DOI] [PMC free article] [PubMed] [Google Scholar]
- 6.Chalasani N, Younossi Z, Lavine JE, et al. The diagnosis and management of non-alcoholic fatty liver disease: practice guideline by the American Gastroenterological Association, American Association for the Study of Liver Diseases, and American College of Gastroenterology. Gastroenterology 2012;142(7):1592–1609. [DOI] [PubMed] [Google Scholar]
- 7.Cadranel JF, Rufat P, Degos F. Practices of liver biopsy in France: results of a prospective nationwide survey. For the Group of Epidemiology of the French Association for the Study of the Liver (AFEF). Hepatology 2000;32(3):477–481. [DOI] [PubMed] [Google Scholar]
- 8.Ratziu V, Charlotte F, Heurtier A, et al. Sampling variability of liver biopsy in nonalcoholic fatty liver disease. Gastroenterology 2005;128(7):1898–1906. [DOI] [PubMed] [Google Scholar]
- 9.Merriman RB, Ferrell LD, Patti MG, et al. Correlation of paired liver biopsies in morbidly obese patients with suspected nonalcoholic fatty liver disease. Hepatology 2006;44(4):874–880. [DOI] [PubMed] [Google Scholar]
- 10.Bataller R, Brenner DA. Liver fibrosis. J Clin Invest 2005;115(2):209–218. [DOI] [PMC free article] [PubMed] [Google Scholar]
- 11.Browning JD, Horton JD. Molecular mediators of hepatic steatosis and liver injury. J Clin Invest 2004;114(2):147–152. [DOI] [PMC free article] [PubMed] [Google Scholar]
- 12.Klebanoff SJ. Myeloperoxidase: friend and foe. J Leukoc Biol 2005;77(5):598–625. [DOI] [PubMed] [Google Scholar]
- 13.Tosello-Trampont AC, Landes SG, Nguyen V, Novobrantseva TI, Hahn YS. Kuppfer cells trigger nonalcoholic steatohepatitis development in diet-induced mouse model through tumor necrosis factor-α production. J Biol Chem 2012;287(48):40161–40172. [DOI] [PMC free article] [PubMed] [Google Scholar]
- 14.Rensen SS, Slaats Y, Nijhuis J, et al. Increased hepatic myeloperoxidase activity in obese subjects with nonalcoholic steatohepatitis. Am J Pathol 2009;175(4):1473–1482. [DOI] [PMC free article] [PubMed] [Google Scholar]
- 15.Rensen SS, Bieghs V, Xanthoulea S, et al. Neutrophil-derived myeloperoxidase aggravates non-alcoholic steatohepatitis in low-density lipoprotein receptor-deficient mice. PLoS One 2012;7(12):e52411. [DOI] [PMC free article] [PubMed] [Google Scholar]
- 16.Yang SQ, Lin HZ, Lane MD, Clemens M, Diehl AM. Obesity increases sensitivity to endotoxin liver injury: implications for the pathogenesis of steatohepatitis. Proc Natl Acad Sci U S A 1997;94(6):2557–2562. [DOI] [PMC free article] [PubMed] [Google Scholar]
- 17.Sahai A, Malladi P, Pan X, et al. Obese and diabetic db/db mice develop marked liver fibrosis in a model of nonalcoholic steatohepatitis: role of short-form leptin receptors and osteopontin. Am J Physiol Gastrointest Liver Physiol 2004;287(5):G1035–G1043. [DOI] [PubMed] [Google Scholar]
- 18.Day CP, James OF. Steatohepatitis: a tale of two “hits”? Gastroenterology 1998;114(4):842–845. [DOI] [PubMed] [Google Scholar]
- 19.Siebler J, Galle PR, Weber MM. The gut-liver-axis: endotoxemia, inflammation, insulin resistance and NASH. J Hepatol 2008;48(6):1032–1034. [DOI] [PubMed] [Google Scholar]
- 20.Fujita K, Nozaki Y, Wada K, et al. Dysfunctional very-low-density lipoprotein synthesis and release is a key factor in nonalcoholic steatohepatitis pathogenesis. Hepatology 2009;50(3):772–780. [DOI] [PubMed] [Google Scholar]
- 21.Chen JW, Breckwoldt MO, Aikawa E, Chiang G, Weissleder R. Myeloperoxidase-targeted imaging of active inflammatory lesions in murine experimental autoimmune encephalomyelitis. Brain 2008;131(Pt 4):1123–1133. [DOI] [PMC free article] [PubMed] [Google Scholar]
- 22.Breckwoldt MO, Chen JW, Stangenberg L, et al. Tracking the inflammatory response in stroke in vivo by sensing the enzyme myeloperoxidase. Proc Natl Acad Sci U S A 2008;105(47):18584–18589. [DOI] [PMC free article] [PubMed] [Google Scholar]
- 23.Chen JW, Querol Sans M, Bogdanov A, Jr, Weissleder R. Imaging of myeloperoxidase in mice by using novel amplifiable paramagnetic substrates. Radiology 2006;240(2):473–481. [DOI] [PubMed] [Google Scholar]
- 24.Kleiner DE, Brunt EM, Van Natta M, et al. Design and validation of a histological scoring system for nonalcoholic fatty liver disease. Hepatology 2005;41(6):1313–1321. [DOI] [PubMed] [Google Scholar]
- 25.Pulli B, Ali M, Forghani R, et al. Measuring myeloperoxidase activity in biological samples. PLoS One 2013;8(7):e67976. [DOI] [PMC free article] [PubMed] [Google Scholar]
- 26.Wigg AJ, Roberts-Thomson IC, Dymock RB, McCarthy PJ, Grose RH, Cummins AG. The role of small intestinal bacterial overgrowth, intestinal permeability, endotoxaemia, and tumour necrosis factor alpha in the pathogenesis of non-alcoholic steatohepatitis. Gut 2001;48(2):206–211. [DOI] [PMC free article] [PubMed] [Google Scholar]
- 27.Lichtman SN, Sartor RB, Keku J, Schwab JH. Hepatic inflammation in rats with experimental small intestinal bacterial overgrowth. Gastroenterology 1990;98(2):414–423. [DOI] [PubMed] [Google Scholar]
- 28.Drenick EJ, Fisler J, Johnson D. Hepatic steatosis after intestinal bypass–prevention and reversal by metronidazole, irrespective of protein-calorie malnutrition. Gastroenterology 1982;82(3):535–548. [PubMed] [Google Scholar]
- 29.Tilg H, Moschen AR. Evolution of inflammation in nonalcoholic fatty liver disease: the multiple parallel hits hypothesis. Hepatology 2010;52(5):1836–1846. [DOI] [PubMed] [Google Scholar]
- 30.Schwenzer NF, Springer F, Schraml C, Stefan N, Machann J, Schick F. Non-invasive assessment and quantification of liver steatosis by ultrasound, computed tomography and magnetic resonance. J Hepatol 2009;51(3):433–445. [DOI] [PubMed] [Google Scholar]
- 31.Murakami T, Mochizuki K, Nakamura H. Imaging evaluation of the cirrhotic liver. Semin Liver Dis 2001;21(2):213–224. [DOI] [PubMed] [Google Scholar]
- 32.Polasek M, Fuchs BC, Uppal R, et al. Molecular MR imaging of liver fibrosis: a feasibility study using rat and mouse models. J Hepatol 2012;57(3):549–555. [DOI] [PMC free article] [PubMed] [Google Scholar]
- 33.Chen J, Talwalkar JA, Yin M, Glaser KJ, Sanderson SO, Ehman RL. Early detection of nonalcoholic steatohepatitis in patients with nonalcoholic fatty liver disease by using MR elastography. Radiology 2011;259(3):749–756. [DOI] [PMC free article] [PubMed] [Google Scholar]
- 34.Abrigo JM, Shen J, Wong VW, et al. Non-alcoholic fatty liver disease: spectral patterns observed from an in vivo phosphorus magnetic resonance spectroscopy study. J Hepatol 2014;60(4):809–815. [DOI] [PubMed] [Google Scholar]
- 35.Moriyasu F, Iijima H, Tsuchiya K, Miyata Y, Furusaka A, Miyahara T. Diagnosis of NASH using delayed parenchymal imaging of contrast ultrasound. Hepatol Res 2005;33(2):97–99. [DOI] [PubMed] [Google Scholar]
- 36.Tomita K, Tanimoto A, Irie R, et al. Evaluating the severity of nonalcoholic steatohepatitis with superparamagnetic iron oxide-enhanced magnetic resonance imaging. J Magn Reson Imaging 2008;28(6):1444–1450. [DOI] [PubMed] [Google Scholar]
- 37.Rausch PG, Moore TG. Granule enzymes of polymorphonuclear neutrophils: A phylogenetic comparison. Blood 1975;46(6):913–919. [PubMed] [Google Scholar]
- 38.Nahrendorf M, Sosnovik D, Chen JW, et al. Activatable magnetic resonance imaging agent reports myeloperoxidase activity in healing infarcts and noninvasively detects the antiinflammatory effects of atorvastatin on ischemia-reperfusion injury. Circulation 2008;117(9):1153–1160. [DOI] [PMC free article] [PubMed] [Google Scholar]
- 39.Takai S, Kimura K, Nagaki M, Satake S, Kakimi K, Moriwaki H. Blockade of neutrophil elastase attenuates severe liver injury in hepatitis B transgenic mice. J Virol 2005;79(24):15142–15150. [DOI] [PMC free article] [PubMed] [Google Scholar]
- 40.Wieser V, Adolph TE, Enrich B, et al. Reversal of murine alcoholic steatohepatitis by pepducin-based functional blockade of interleukin-8 receptors. Gut 2016 Feb 8. [Epub ahead of print] [DOI] [PMC free article] [PubMed] [Google Scholar]
Associated Data
This section collects any data citations, data availability statements, or supplementary materials included in this article.


