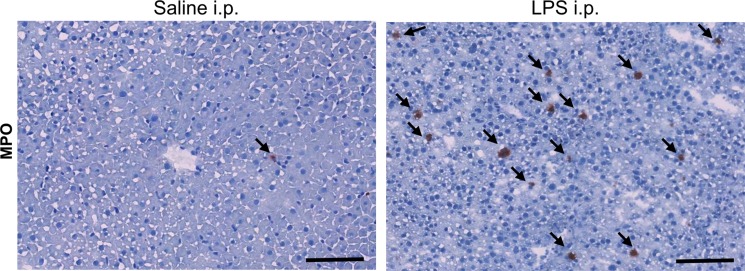
Figure 2d:
Molecular MR imaging of LPS-induced steatohepatitis. (a, b) Precontrast, 15 minutes and 60 minutes after MPO-Gd injection T1-weighted MR images, and CNR maps of db/db mice injected with LPS (a) or saline (b) demonstrate increased signal at 15 and even more at 60 minutes after contrast agent injection, and this is confirmed on CNR maps and voxel-by-voxel quantification of MPO-Gd MR imaging (c). (d) Immunohistochemistry demonstrates increase in MPO-positive cells with LPS compared with control (arrows; bar = 100 μm). All data are mean ± standard error of the mean. * P < .05. i.p. = intraperitoneal.

