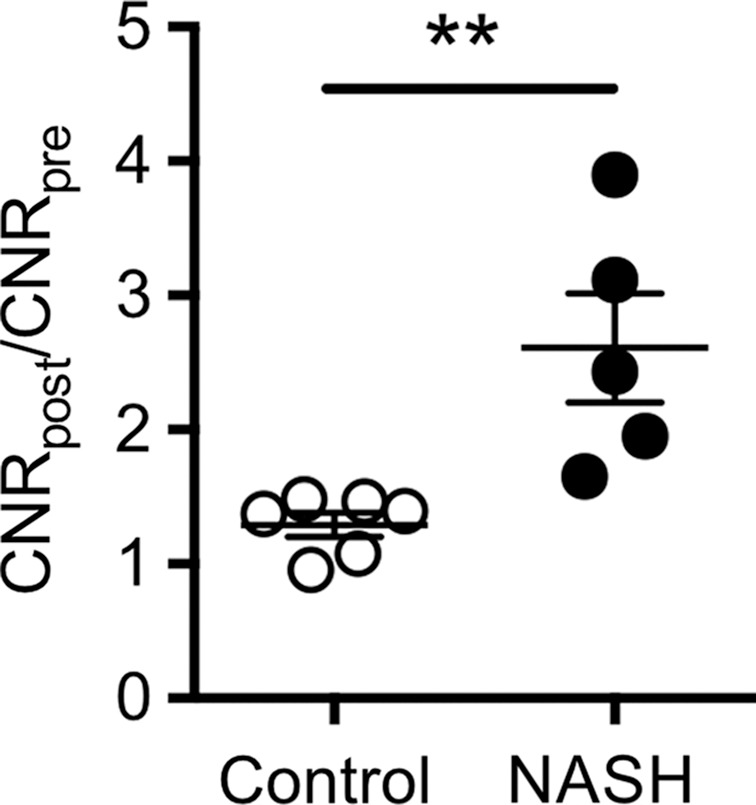
Figure 5c:

Molecular MPO-Gd enhanced MR imaging shows MPO activity in liver biopsy samples of NASH patients. (a, b) Pseudo-colored images of liver biopsy samples before and after contrast enhancement from NASH (top row) and control patients (middle row); the biopsy sample is outlined with dashed line. Increased signal after incubation with MPO-Gd is seen on samples from NASH patients, but not control patients, and this is confirmed at voxel-by-voxel image quantification (c). (d) Immunohistochemistry for MPO in liver biopsy samples from NASH (middle) and control patients (left) (bar = 100 μm) demonstrated clusters of MPO-expressing cells in samples from NASH patients but not in samples from control patients. Quantification (d, right) confirms increased number of MPO-positive cell clusters in NASH versus control patients. ** P < .01. All data are mean ± standard error of the mean.
