

Abstract
Children with autism vary widely in their language abilities, yet the neural correlates of this language variability remain unclear, especially early in development. Diffusion tensor imaging (DTI) was used to examine diffusivity measures along the length of 18 major fiber tracts in 104 preschool-aged boys with autism spectrum disorder (ASD). The boys were assigned to subgroups according to their level of language development (Low: no/low language, Middle: small vocabulary, High: large vocabulary and grammar), based on their raw scores on the expressive language (EL) and receptive language (RL) sections of the Mullen Scales of Early Learning (MSEL). Results indicate that the subgroups differed in fractional anisotropy (FA), mean diffusivity (MD), and radial diffusivity (RD) along the inferior longitudinal fasciculus (ILF) in both hemispheres. Moreover, FA correlated significantly with Mullen EL and RL raw scores, but not ADOS severity score, along the left and right ILF. Subgroups also differed in MD (but not FA) along the left superior longitudinal fasiculus and left corticospinal tract, but these differences were not correlated with language scores. These findings suggest that white matter microstructure in the left and right ILF varies in relation to lexical development in young males with ASD. The findings also support the use of raw scores on language-relevant standardized tests for assessing early language-brain relationships.
Keywords: DTI, brain imaging, language development, preschoolers
Introduction
Autism Spectrum Disorder (ASD) is a neurodevelopmental disorder usually diagnosed during the preschool years, and characterized by deficits in social interaction and excessive restricted and repetitive behaviors (DSM-5, APA 2014). Language and communication deficits are not considered core features, because while some individuals with ASD present with delayed and/or impaired language profiles others appear to learn and use language consistent with their chronological age [Eigsti, Bennetto, & Dadlani, 2007; Tager-Flusberg, Paul, & Lord, 2005; Tek, Mesite, Fein, & Naigles, 2014]. However, heterogeneous language performance is evident among children with ASD from diagnosis onward [Groen, Zwiers, van der Gaag, & Buitelaar, 2008; Kjelgaard & Tager-Flusberg, 1998; Naigles & Chin, 2015; Tager-Flusberg, 2006], and better language skills early in development have been consistent predictors of better language outcomes [Ben Itzchak et al., 2014; Munson, Faja, Meltzoff, Abbott, & Dawson, 2008; Rapin, Dunn, Allen, Stevens, and Fein, 2009; Sigman & McGovern, 2005).
One avenue to understanding the origins of language heterogeneity involves investigating its neurobiological underpinnings (Kuhl et al., 2013; Verhoeven, Rommel, & Prodi, 2012; Wolff, et al., 2012). Recent evidence suggests that there is substantial heterogeneity in the neural characteristics of ASD, as well as multiple neurophenotypes [Nordahl, Lange et al., 2011, Nordahl, Scholz et al., 2012, Ohta et al., 2016]. Thus, it becomes essential to investigate associations between variability in brain structure and connectivity and variability in language behavioral characteristics, within ASD. Such associations remain understudied, and very few studies have investigated young children closer to the onset of ASD and of language development. In the current study, we evaluated the underlying neural correlates of early language in a cohort of preschool-aged children with ASD. Children were divided into subgroups based on their language development and associations with diffusion properties of major white matter tracts were examined.
While recent studies have investigated correlates between variability in language performance and variability in brain structure and connectivity in children with ASD, findings are thus far inconsistent. Some studies have reported that school-age children and adolescents with ASD with higher language scores manifest greater left-lateralized asymmetry in gray matter volume or white matter connectivity in language-related cortical regions (e.g., superior temporal gyrus, inferior frontal gyrus) [deFosse et al., 2004; Nagae, Zarnow, & Blaskey, 2012; Sharda et al., 2016]. Other studies have found that higher language performance in these age groups is associated with higher functional connectivity in both hemispheres [Verly et al., 2013] or with increased right-ward asymmetry [Joseph, et al., 2014] of the language-related cortical regions. A third group of studies has reported the absence of significant relationships between brain areas or activation and language levels in children with ASD [Bigler et al., 2007; Joseph et al., 2014; Knaus, et al., 2010; Mills et al., 2013; Verhoeven et al., 2012]. Only two imaging studies that we know of have included children at or near the onset of language development, again with mixed results. Eyler, Pierce, and Courchesne [2012] found no association between degree of left superior temporal gyrus activation and standardized language scores in 2-year-olds with ASD. More recently, Lombardo et al. [2015] reported neural activation during fMRI concentrated in left superior temporal cortex for toddlers with high standardized language scores, but more diffuse right hemisphere activation for toddlers with low scores.
In the current study, we extend previous DTI studies by expanding investigations beyond the language-relevant brain tracts to include all major fiber tracts, based on reports that a blunted neurodevelopmental trajectory has been observed for infants with ASD in a number of brain regions [Wolff et al., 2012], and that brain-language relationships have been observed in typically developing (TD) infants outside of the usual language-relevant tracts (e.g., the left inferior cerebellar peduncle [Deniz Can, Richards, & Kuhl, 2013]). Moreover, we take seriously Eyler et al.’s [2012] concern that the usual measures of early language may be unstable and unreliable in the ASD population, such that the standardized scores usually used may not accurately reflect the children’s level of linguistic knowledge [Naigles & Chin, 2015]. Therefore, we use raw scores, which more closely approximate this group’s relative levels of language development.
To elaborate, the typical indexes of language ability that are correlated with neural measures are drawn from standardized tests. The Mullen Scales of Early Learning (MSEL) [Mullen, 1995] are usually employed with children under the age of 6 years, and a wider range of tests (e.g., the Peabody Picture Vocabulary Test (PPVT) [Dunn & Dunn, 1997] is administered to school-age children and adolescents. Generally, standard/age-adjusted scores are calculated for investigating relationships with brain activation and/or development, so that the child is ranked on the degree to which his or her functioning matches expectations for his or her chronological age. However, language knowledge increases exponentially over the preschool years [Hoff, 2013], and language-brain relationships might be based, at least partially, on children’s current level of language development rather than on the degree of difference they demonstrate from a reference group. Further, specific neural indicators such as the N400 emerge in TD preschoolers as their lexicons develop [Friederici & Skeide, 2015], and early- vs. late-acquired words may also be differentially represented in the cerebral cortex [Fiebach, Friederici, Müller, von Cramon, & Hernandez, 2003]. To date, however, there have been no studies of young children with ASD that rank them on their actual progress or status in language development rather than on their degree of age-appropriate language. Because of their language delay, and the vast heterogeneity of language in the ASD population, children who are ranked by standardized scores may not really be commensurate with others with the same scores.
To make this more tangible, consider four children in our dataset. Two had T-scores of 20 on the MSEL-RL, but showed different levels of raw performance: A (30 months) had a raw score of 13, indicating understanding of several familiar names and inhibitory words (see Methods for more details about this coding); B (41 months) had a raw score of 24, indicating much greater understanding of language, including understanding of spatial terms. Both children had the same standardized score yet had very different levels of language development and knowledge of language (based on their raw scores). Two additional children, C and D, earned the same raw score on the MSEL-EL; namely, 26, showing that they had the same level of language usage. Yet, their T-scores were drastically different (one had a 29, 2 SDs below the norm of 50 and the other a 63, more than 1 SD above the norm), due to their different chronological ages (41 months, 24 months). If their T scores had been used to represent their language ability, they would be considered to have very different language levels; however, their language skills are very similar. If brain development proceeds at least partially in step with actual language development [Friederici & Skeide, 2015], then for the purposes of discovering brain-language relationships, one needs to focus on children’s levels of language development rather than their degree of difference from a normative sample. Corroborating this rationale, Landa, Gross, Stuart, and Faherty [2013] see also Perryman et al. [2013] describe a similar approach: because they were interested in actual changes in attested behaviors over developmental time, they analyzed raw EL and RL scores of children with ASD at several intervals between 6 and 36 months of age. This enabled them to discover that these children showed gains in raw scores—demonstrating increasingly more sophisticated language behaviors—over time (see also Mervis’ [2004] rationale for preferring raw over age-equivalent scores).
Thus, in the current study we investigated the degree to which variability in levels of language development of children with ASD corresponded to variability in their brain development. We know that synaptic plasticity and myelination may provide mechanisms that enable the maturation of language-related brain circuits [Brauer, Anwander, & Friederici, 2011; Markham & Greenough, 2004; Skeide, Brauer, & Friederici, 2016]. We collected concurrent diagnostic and language data from 104 preschoolers with ASD, and our innovation was to rank the children according to their raw scores on the MSEL. We also collected diffusion-weighted MRI data from these children, and evaluated diffusion properties in a wide range of tracts as possible language-relevant neural correlates. We hypothesized that the heterogeneous language profiles would map onto differences in white matter tract profiles. For the current study, our focus is specifically on children with ASD; their documented heterogeneity with respect to language development allows us to investigate language-brain relationships while holding chronological age (also an important factor in brain development) relatively constant.
Method
Participants
Participants were recruited through the MIND (Medical Investigation of Neurodevelopmental Disorders) Institute of the University of California, Davis (UCD), as part of the Autism Phenome Project. For the current analysis, behavioral and diffusion imaging data were utilized from young (mean age at MRI acquisition = 37 months) male children with ASD (mean ADOS severity = 7.90; see Tables 1 and 2 for participant descriptors). Diagnostic assessments were conducted by licensed clinical psychologists using the Autism Diagnostic Observation Schedule-Generic (ADOS-G) [Lord, Rutter, DiLavore, & Risi, 1999] and the Autism Diagnostic Interview-Revised (ADI-R) [LeCouteur et al., 2008]. Diagnostic criteria for ASD were derived from the Collaborative Programs of Excellence in Autism (CPEA) network. Participants met ADOS-G cutoff scores for autism or ASD, were above the cutoff score for autism on either the social or communication subscale of the ADI-R and were within two points of the autism cutoff for all other subscales on the ADI-R. An ADOS severity score was calculated [Gotham, Pickles, & Lord, 2009], which allows for comparison of autism severity across participants tested with different ADOS-G modules. Additional exclusion criteria involved only physical contraindications for MRI. All children were native English speakers, were ambulatory, and without suspected vision or hearing problems. One child with a history of abnormal EEGs was excluded. Handedness was assessed by means of behavioral examination. This study was approved by the UCD IRB, and informed consent was obtained from each participant’s parent or guardian.
Table 1.
Age, Cognitive, and Social Descriptors of Participants
| Total | Low language | Middle language | High language | |
|---|---|---|---|---|
| N | 104 | 50 | 22 | 32 |
| Age at MRI | 36.80 (5.91) | 36.00 (6.10) | 35.423 (5.83) | 38.98 (5.19) |
| Age at Mullen | 34.37 (5.80) | 33.58 (5.97) | 34.11 (6.11) | 35.79 (5.19) |
| VR Raw Score | 26.59 (7.17) | 22.22 (4.18) | 26.14 (3.34) | 33.72 (7.22) |
| RL Raw Score | 19.20 (8.16) | 12.62 (2.29) | 20.86 (4.77) | 28.34 (6.29) |
| EL Raw Score | 18.45 (8.49) | 11.74 (3.48) | 19.23 (4.50) | 28.41 (5.56) |
| VR T Score | 32.51 (15.36) | 24.20 (6.39) | 31.05 (10.06) | 46.50 (18.33) |
| RL T Score | 28.76 (13.05) | 20.00 (0) | 30.00 (10.73) | 41.59 (13.90) |
| EL T Score | 29.12 (13.23) | 20.68 (1.80) | 27.59 (9.09) | 43.34 (13.98) |
| VR Age Equivalent | 25.11 (9.42) | 19.58 (4.70) | 23.95 (3.99) | 34.53 (10.36) |
| RL Age Equivalent | 19.25 (10.49) | 11.00 (2.70) | 21.18 (5.40) | 30.81 (9.16) |
| EL Age Equivalent | 19.35 (10.36) | 11.36 (3.95) | 19.86 (5.26) | 31.47 (7.63) |
| ADOS Severity | 7.90 (1.72) | 8.64 (1.56) | 7.23 (1.90) | 7.19 (1.33) |
Table 2.
Handedness and Ethnicity of Participants
| Total | Low language | Middle language | High language | |
|---|---|---|---|---|
| Handedness | ||||
| Left | 16 | 10 | 2 | 4 |
| Right | 72 | 31 | 17 | 24 |
| Undetermined | 16 | 9 | 3 | 4 |
| Race | ||||
| Caucasian | 63 | 28 | 13 | 22 |
| Asian | 9 | 5 | 3 | 1 |
| African-American | 10 | 6 | 1 | 3 |
| Pacific-Islander | 2 | 2 | 0 | 0 |
| American-Indian | 1 | 1 | 0 | 0 |
| Other | 19 | 8 | 5 | 6 |
Measures
The Autism Diagnostic Observation Schedule (ADOS-G) [Lord et al. 1999] is a structured and play-based assessment for the diagnosis of ASD.
The Autism Diagnostic Interview-Revised (ADI-R) [LeCouteur et al., 2008] is a structured interview conducted with the parents of the children with ASD, and measures behavior in the domains of reciprocal social interaction, language and communication, and overall behavioral patterns.
The Mullen Scales of Early Learning (MSEL) [Mullen 1995] provide measures of development, including items that measure visual perception, expressive and receptive language (EL, RL), and motor development, for children from birth to 5.67 years. The MSEL gives raw scores, T scores (average of 50, SD of 10), and age equivalents for each domain. The MSEL was administered to all children in this sample.
The MacArthur Communicative Development Inventory (CDI) [Fenson et al., 1993] is a standardized parent reporting instrument that assesses children’s early language development. The infant (words and gestures) version was filled out by the parents of a subset of the children in this sample; the 396-word vocabulary checklist was analyzed for this study.
The Peabody Picture Vocabulary Test-Third Edition (PPVT) [Dunn & Dunn, 1997], which assesses receptive vocabulary knowledge, was successfully administered to a subset (N = 44) of the children in this sample, primarily those in the middle and high language groups (see below).
Language Group Assignment
Language groups were based primarily on the children’s scores on the MSEL, because all children who participated in this study had completed this measure. Children were placed into one of three groups. Low: language only just beginning or not yet begun (n = 50), with RL and EL raw scores of 16 or below (understanding and producing up to 3–6 familiar object labels, possibly including some body parts). Middle: language included a stable lexicon of nouns, with RL and EL raw scores up to but not beyond 26 (RL) or 27 (EL; n = 10). An additional 12 children were assigned to this group because they had highly uneven scores; six had receptive scores much higher than expressive, and six had expressive scores much higher than receptive (generating T-score differentials of 10 or more on either the MSEL or the PPVT). High: language included a large vocabulary plus some grammar (n = 32), with RL raw scores over 23, indicating (at least) understanding of action words and prepositions and EL raw scores over 23, indicating (at least) the ability to use two-word phrases and map words onto varied pictorial representations. For this group, we also accessed the children’s CDI scores if these had been collected (n = 16); these vocabulary scores needed to exceed 100 words, with parents also reporting some word combinations or use of grammatical morphology. One child did not fit this profile with his MSEL scores and had no CDI data, but was placed into this group because his PPVT standard score was higher than 80.
The mean MSEL VR, EL, and RL scores for each group are presented in Table 1. One-way ANOVAs were performed on the children’s raw scores, as well as T-scores, to confirm that the groups were significantly different; all Fs(2,103) > 30, ps < .001. Post hoc pairwise comparisons were all significantly different (ps < .01) except for the comparison of the Low vs. Middle Language VR T-scores, which approached but did not reach significance (P = .088). One-way ANOVAs were also performed comparing the groups by age at MSEL administration [F(2,103) = 1.45, P = .24] and age at brain scan [F(2,103) = 3.38, P = .038]. Although the latter ANOVA yielded an overall group effect, none of the pairwise comparisons reached significance (ps > .15). Finally, we conducted a one-way ANOVA to compare the groups by ADOS severity score, yielding a significant group effect (F(2, 103) = 10.92, P < .001); while the Low Language group had higher severity scores than both the Middle (P < .01) and High (P < .001) Language groups, these latter two groups did not differ from each other (P > .8)
Imaging Procedures
MRI scans were acquired during natural, nocturnal sleep at the UC Davis Imaging Research Center using a 3T Siemens Trio whole-body MRI system (Siemens Healthcare, Inc., Erlangen, Germany) equipped with an 8-channel head coil (Invivo, Inc., Gainesville, FL). We used a child-friendly scanning approach that has proven highly successful in young children [Nordahl, Simon et al., 2008]. Earplugs and/or headphones were used to attenuate scanner noise and children were closely monitored during scanning.
For all participants, images were obtained using a three-dimensional T1-weighted MPRAGE sequence (TR 2170 ms; TE 4.86 ms; matrix 256 × 256; 192 slices in the sagittal direction, 1.0 mm isotropic voxels, scan time: 8 m 6 s) and a diffusion-weighted, spin echo, echo planar imaging sequence (“ep2d_diff”, number of slices: 72, slice thickness: 1.9 mm, slice gap: 0.0, matrix size: 128 × 128, voxel size: 1.9 mm isotropic, phase encoding direction: anterior to posterior (A ≫ P), phase partial Fourier: 5/8, TR: 11500, TE: 91, scan time: 6 m 56 s), with effective b-value 700 mm2/s, 30 gradient diffusion directions, and five b = 0 images acquired at equally spaced intervals over the scan time. All structural scans were reviewed by a pediatric neuroradiologist and screened for significant clinical findings.
Images were acquired from October 2007 to June 2011. In August 2009, the Siemens 3T Trio MRI system was upgraded to a Trio Total Imaging Matrix (TIM) MRI System, and all sequences were upgraded and mapped to the original sequences. Importantly, for the diffusion-weighted sequence, the spatial resolution, b-value, and gradient directions were preserved following the MRI system upgrade. While the diffusion-weighted parameters were not directly changed, there may be differences in diffusion-weighted measures in regions with reduced geometric distortion. To control for these differences, we included scanner upgrade status (preupgrade vs. postupgrade) as a nuisance variable in the model for all statistical analyses. This approach has been used successfully in prior analyses from this cohort [Johnson et al., 2014; Nordahl, Iosif et al., 2015]. In the current analysis, 47 scans were acquired before the scanner upgrade and 57 scans were acquired afterwards, and the ratios of each language subgroup were balanced across this nuisance variable (Chi-square statistic = 0.50, P = 0.78).
Image Processing and Diffusion Tensor Calculation
T1-weighted structural image preprocessing followed Nordahl et al. [2011] and included removal of nonbrain tissue [Smith, 2002] and correction of inhomogeneities [Sled, Zijdenbos, & Evans, 1998]. Diffusion-weighted data were processed using the Vistalab (Stanford Vision and Imaging Science and Technology) diffusion MRI software suite. Raw dicoms were converted to 4-D nifti format. Images were visually inspected, and any volumes with signal dropout (i.e., motion artifact) were excluded. Subjects with more than 6 volumes (20% of total diffusion directions) with motion were excluded from further processing and analysis (n = 11). The remaining 104 scans were included in the analyses. Because images were acquired during natural sleep, there was very little motion artifact in this dataset. Of the 104 children, 75% had no volumes with motion artifact and 13% had one diffusion direction excluded. This most frequently occurred at the beginning of the sequence when some children would startle in their sleep at the onset of the noises. Two to three diffusion directions were excluded in 10% of the cohort and 2% had four or five diffusion directions excluded. Importantly, there were no group differences in the number of volumes excluded (chi square P = .19). Diffusion-weighted images were aligned to the motion-corrected mean of the b = 0 images using a rigid body algorithm and resampled to 2-mm isotropic voxels with eddy-current and motion correction using a seventh-order b-spline algorithm based on SPM5. Vistalab image processing software is available as part of the open-source mrDiffusion package available at http://github.com/vistalab/vistasoft. Diffusion tensors were fitted to the resampled diffusion-weighted data using the RESTORE algorithm that also removed outliers from the tensor estimation [Chang, Jones, & Pierpaoli, 2005].
Automatic Fiber Quantification
We used Automatic Fiber Quantification (AFQ) software tools [Yeatman, Dougherty, Myall, Wandell, & Feldman, 2012] to segment 18 major fiber tracts from the total white matter skeleton in each participant’s brain. Tracts identified include the left and right anterior thalamic radiations, left, and right cingulate portion of the cingulum, left and right inferior fronto-occipital fasciculus, left and right superior longitudinal fasciculus, left and right inferior longitudinal fasciculus, and left and right uncinate fasciculus, the left and right corticospinal tracts, and the forceps major and minor. AFQ is described in detail in Yeatman et al. [2012] and consists primarily of three steps: (1) whole-brain fiber tractography; (2) ROI-based fiber tract segmentation; and (3) fiber tract cleaning and quantification. AFQ calculates diffusion properties at a series of fixed intervals or “nodes” along each tract between two defining ROIs. Resulting data provide a tract profile describing diffusion properties, including radial diffusivity (RD), axial diffusivity (AD), mean diffusivity (MD) and fractional anisotropy (FA), along the length of each tract. Axial diffusivity (AD) describes diffusion parallel to the principle diffusion direction (i.e., along the long axis of an axon) and has been related to changes in axon integrity such as during axonal degeneration [Kim et al., 2007; Song et al., 2003]. Radial diffusivity describes diffusion perpendicular to the principle diffusion direction and is decreased with reduced axonal myelination or axon fiber density [Song et al., 2002; Zhang et al., 2009]. Mean diffusivity (MD) and fractional anisotropy (FA) are summative measures that describe average total diffusion and a normalized standard deviation of the three diffusion directions, respectively. FA has been associated with axonal membrane circumference and possibly also axonal density and myelin thickness [Concha, Livy, Beaulieu, Wheatley, & Gross, 2010]. We used 99 nodes per fiber tract in the current analysis. AFQ tractography yields fiber bundles similar to those seen in other reports in this participant age range [Huang et al., 2006; Trivedi et al., 2009; Wolff et al., 2012]. AFQ is freely available for download at https://github.com/jyeatman/AFQ.
Differential Analysis Plan for DTI Data
For each participant, axial diffusivity (AD), radial diffusivity (RD), mean diffusivity (MD), and fractional anisotropy (FA) were calculated at 99 nodes between the two defining ROIs for each fiber bundle. For all differential analyses, three-way mixed-design analyses of co-variance (ANCOVA) were conducted for the dependent variables (AD, RD, MD, FA). Nodes were used as repeated measures and language group served as the between-group variable. Participant age was included as a continuous covariate while handedness and scanner status were controlled. Mauchly’s test [Mauchly, 1940] was used to test for violations of sphericity and the Huyhn-Felt correction was applied when sphericity was violated.
For each tract in the analysis a structured hypothesis testing approach was used. First, differences in language groups (Low, Middle, High) were assessed using two significance tests: one for the hypothesis that average diffusion scores for the tract differed between diagnostic groups (H0: low language average diffusion for tract = mid language average diffusion for tract = high language average diffusion for the tract) and a second for the hypothesis that the relationship between diffusion parameters and diagnostic group is not constant along the tract length (H0: low language tract diffusion profile = mid language tract diffusion profile = high language tract diffusion profile). Importantly, only if one of these omnibus null hypotheses was rejected, was a tract examined any further. For tracts in which either omnibus null hypothesis was rejected, we sought to illustrate the location of diagnostic differences with additional analyses. We used one-way ANCOVAs and Sidak-corrected pairwise comparisons to identify the location of group differences along a tract’s length. These additional analyses were conducted only on tracts which had already passed the more stringent omnibus hypothesis testing. For all analyses, results are expressed as mean ±SEM (standard error of the mean), and a P-value less than 0.05 was considered statistically significant.
Results
Approximately half of the children’s MSEL scores indicated little to no language (Low group), just under one-quarter of the children had a small lexicon of object words (Middle group), and just over one-quarter of children were the furthest along in language development, with a large lexicon and some grammar (High group, see Table 1).
DTI analyses revealed four white matter tracts with diffusion differences between these language groups: the left inferior longitudinal fasciculus (L-ILF), right inferior longitudinal fasciculus (R-ILF), left superior longitudinal fasciculus (L-SLF), and the left corticospinal tract (L-CST). Figures 1 and 2 present the effects in the L-ILF, where there was an overall difference in FA between language subgroups (main effect of group: F = 3.890, P = 0.024), and group differences along the tract length for MD (nodes by group interaction: F = 1.962, P = 0.047, Figure 2) and RD (nodes by group interaction: F = 1.861, P = 0.048, Figure 2). Overall, the tracts with lowest FA, especially towards the occipital end, were the tracts in the children in the Low language group. Figure 3 shows the effects in the R-ILF, where there was an overall difference in FA as well, and in the same direction as the L-ILF (main effect of group: F = 1.764, P = 0.034).
Figure 1.
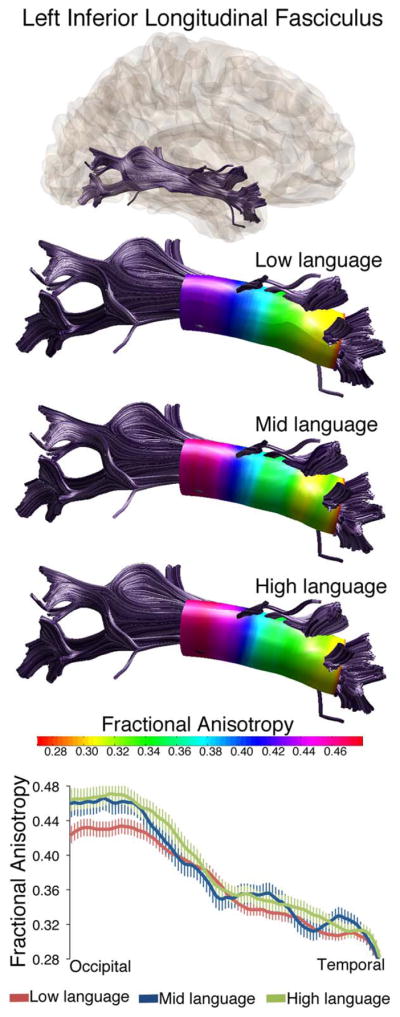
Fractional anisotropy values differ along the length of the left inferior longitudinal fasciculus in three language subgroups within ASD. Tractography reconstructions of the left ILF are shown in gray. Overlaid on three tract reconstructions are profiles displaying the sampling area (colored tube) and FA at each node for low language, mid language and high language subgroups. FA values along the tract length are also shown in all three groups in the line graph at bottom. Values are group means ± SEM.
Figure 2.

Radial diffusivity and mean diffusivity differ along the length of the left inferior longitudinal fasciculus in three language subgroups within ASD. RD values along the tract length are shown in all three groups in the top line graph. MD values along the tract length are shown in all three groups in the bottom line graph. Values are group means ± SEM.
Figure 3.
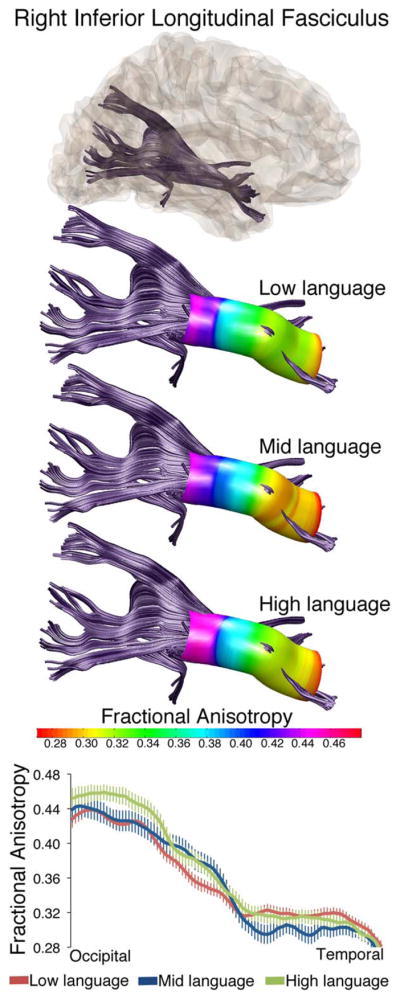
Fractional anisotropy values differ along the length of the right inferior longitudinal fasciculus in three language subgroups within ASD. Tractography reconstructions of the right ILF are shown in gray. Overlaid on three tract reconstructions are profiles displaying the sampling area (colored tube) and FA at each node for low language, mid language and high language subgroups. FA values along the tract length are also shown in all three groups in the line graph at bottom. Values are group means ± SEM.
Partial correlations controlling for scanner upgrade status and age at MRI were calculated between FA in the left and right ILF, and three behavioral measures: ADOS severity score, MSEL EL raw score, and MSEL RL raw score. To minimize the number of comparisons being made, we a priori limited our correlations to FA. Determining the relationships between FA and the behavioral measures at each node along the tracts’ length allowed us to increase anatomical precision and identify which portions of the ILF were or were not related to language performance. As Figure 4 shows, FA in occipital portions of the left ILF was highly correlated with both expressive and receptive language in young males with ASD (Fig. 4, left panel). This relationship was not simply a proxy measure of overall impairment, as ADOS severity scores were not correlated with FA in the left ILF (Figure 4). A similar pattern was seen in the right ILF (Figure 4, right panel) although FA at a few locations along the right ILF was also related to ADOS severity. Because it is possible that these relationships with RL and EL derived from the children’s overall cognitive levels, we conducted a second set of partial correlations in which their raw MSEL VR scores were also controlled. The same pattern of significant effects displayed in Figure 4 was obtained, with a few scattered nodes dropping below significance for the FA-Receptive Language relationships in both R-ILF and L-ILF, and for the FA-Expressive Language relationships in the L-ILF tract. Interestingly, the relationships between R-ILF FA and MSEL-Expressive Language were the most susceptible, with only one node maintaining the significant positive relationship once VR was controlled.
Figure 4.

Fractional anisotropy in the left ILF is not related to ASD severity but is related to expressive and receptive language scores on the MSEL. In all three graphs, location along the left ILF is on the horizontal axis. Red lines belong to the left vertical axis and depict correlation strength (r-value) and direction (positive or negative) between FA and the behavioral measure noted. Blue vertical bars belong to the right axis and depict the significance (P-values) of the each correlation along the length of the tract. The top graph displays correlations between expressive language scores and tract FA. The middle graph displays correlations between receptive language scores and tract FA. The bottom graph displays correlations between ADOS severity and tract FA. Values are group means ± SEM.
Finally, Figure 5 presents the MD measures for the left corticospinal tract, which differed between language groups (nodes by group interaction: F = 2.27, P = 0.025). MD also differed between language groups along the left superior longitudinal fasciculus (nodes by group interaction: F = 2.73, P = 0.014). Interestingly, it was the Middle language group that differed with these tracts, showing higher MD at the ventral (corticospinal) and frontal (L-SLF) ends.
Figure 5.

Mean diffusivity values differ along the length of the left corticospinal and left superior longitudinal fasciculus across the three language groups. Tractography reconstructions for each tract are depicted on top, and MD values along the length of each tract are depicted in the line graphs on the bottom. Values are group means ± SEM.
Discussion
We classified young preschool-aged males with ASD into Low, Middle or High language groups to capture the heterogeneity in language ability regularly seen in ASD populations. We compared diffusion measures in 18 major white matter tracts in the brains of each language group and found 4 tracts with significant differences between the language groups. Moreover, having identified language group differences in the FA profiles of the left and right ILF we asked if FA in these tracts was related to language performance overall. We examined correlations between receptive and expressive language and FA along the length of each tract and found that differences in both the left and right, occipital regions of the tract were highly related to both language measures (Figure 4), but not to autism severity.
These findings are suggestive of a role for ILF maturation in children with ASD’s early language development. The language variability we observed in children with ASD was primarily vocabulary-related; as assessed by the MSEL, the children varied from having no speech at all (Low), to having some words, all of which were for objects or parts of objects (e.g., nose; Middle), to having a large vocabulary, most of which were words for concrete objects and actions (High). Given that the children’s variability centered around quantity of words for concrete objects, part-objects, and actions, an association with the ILF is logical: To learn words for concrete objects and actions, children must be able to connect what they see with what they hear. The ILF connects the occipital lobe, where visual processing takes place, with the temporal lobe, where auditory processing occurs. Indeed, children in our study with higher FA and lower MD in their ILF tracts had, in essence, larger vocabularies than children with lower FA and higher MD/RD in their ILF tracts. During development, FA generally increases with age, and MD decreases [Cascio, Gerig, & Piven, 2007]. In children with autism, there is evidence that FA in multiple white matter tracts, including the ILF, is higher at 6 months of age, but increases at a slower rate thereafter such that by 24 months of age, FA is lower [Wolff et al., 2012]. Although our study did not include a comparison to TD controls, our results do suggest that there is variability in diffusion properties of the ILF within the ASD group related to language ability.
We considered the possibility that the ILF-language relationships were primarily attributable to overall cognitive level, by controlling for Mullen VR scores. This was not borne out, though, as the receptive language-ILF relationships remained stable, as did the expressive language-L-ILF relationship. Controlling for nonverbal cognition did diminish the strength of the expressive-language- R-ILF relationship, which suggests that some aspects of vocabulary production are more tightly linked to nonverbal cognition than others. The presence of six boys in the dataset whose expressive language scores were higher than their receptive language scores might also be playing a role, as these boys might be hyperlexic and thus producing words learned via rote memorization rather than via connecting what they see and hear; such behavior might be more prevalent in children with lower nonverbal cognitive functioning [Cardoso-Martins & da Silva, 2010] Overall, though, the vocabulary-ILF relationships we have documented seem relatively independent of nonverbal cognition.
This association between vocabulary development and ILF maturation is supported by two studies of individuals with lesions in their left temporo-occipital junction. One individual performed a naming task during surgery, and generated the most errors, especially object-recognition ones, when the ILF was stimulated [Mandonnet, Gatignol, & Duffau, 2009]. A second individual was twice scanned and performed object naming tasks, 6 months apart; her object naming score decreased dramatically at the second scan, when her tumor had invaded the ILF; her other abilities remained stable [Shinoura et al., 2010]. Both articles conclude that the ILF plays a critical role in object naming ability. Finally, Fiebach et al. [2003] assessed neural activation of early- vs. later-acquired words and observed that early learned words were represented in a sensory manner in the vicinity of both auditory and visual cortices. Collectively, these findings are consistent with our interpretation of an association between ILF maturity and increasing vocabulary in our children with ASD. Our findings support a role for the ILF as part of a ventral semantic language pathway involving the ILF, uncinate fasciculus, and inferior fronto-occipital fasciculus [Saur et al. 2008, 2010].
Our effects involving the L-SLF emerged only with the MD measure, and most strongly differentiated the Middle and High language groups (Figure 5). Given the well-documented role for the SLF in language use in older children and adults [Joseph et al., 2014; Nagae et al., 2012], we conjecture that maturation of this tract, which connects superior tempero/parietal areas with caudal frontal cortical areas, may be associated with more advanced language development, including grammar as well as lexicon [Skeide et al., 2016]. The High language group was further along in grammatical development than the Middle group, and this difference may be what is reflected in the DTI measure. It is potentially important that the ILF effects were bilateral whereas the SLF effect was confined to the left hemisphere.
Effects involving the corticospinal tract also emerged only with the MD measure [Nagae et al., 2012], but the exact role of corticospinal alterations in ASD language subgroups is currently unclear [e.g., Northam et al., 2012]. One possibility is that the ROIs above and below the internal capsule used to segment the corticospinal tract may also capture some corticobulbar neurons, which innervate cranial nerves responsible for speech articulation. The corticospinal and corticobulbar pathways travel in close proximity as they pass through the internal capsule towards their subcortical targets and are sometimes difficult to distinguish using tractography [Pan, Peck, Young, & Holodny, 2012; Yim et al., 2013]. However, averaged cortical termination maps for the left corticospinal tract from our data do not demonstrate substantial overlap with the more ventral corticobulbar targets. Further research is needed to clarify the potential role of corticospinal tract alterations in language development in ASD.
Limitations
One consequence of our focus on the “actual” language levels of the children with ASD is that the TD controls from the Autism Phenome Project, who were also scanned at approximately three years of age, were much more advanced in overall functioning, including language, than the children with ASD [Nordahl et al., 2011]. As expected [Hoff, 2013], the TD preschoolers were all producing both single-clause and multiple-clause sentences and had large vocabularies whereas only about one-third of the ASD group had reached this level of language (see Table 1). Given our hypothesis that variability in actual language level would be related to variability in neural maturation, this TD group was not an appropriate control for the current study. The conclusions we are able to draw in this study, therefore, are restricted to children with ASD. Further investigations with children who are language-matched to this group with ASD will be necessary to ascertain whether the language-brain relationships we have observed are unique to children with ASD or whether they might also apply more generally to TD children early in language development, or to children with other disorders that affect language development [see Deniz Can et al., 2013, for one recent study]. Additional studies that include a comparison group of children with specific language impairment without autism are also likely necessary to determine whether the observed effects are specific to autism or are common to broader language impairment. A second limitation is that only males were included in the current study, as we did not have enough females in the original dataset to provide sufficient power for any gender by language subgroup comparisons.
Conclusions
We introduced two significant innovations in this study. First, we used raw scores from the MSEL expressive and receptive language tests to rate 104 young boys with ASD on their actual level of language development, and we assigned them to three subgroups: Low: No/Low Language, Middle: Small Vocabulary, High: Large Vocabulary and Grammar. Second, we compared the three groups on diffusivity measures in all major tracts in their brains. We found that level of language development correlated significantly with FA in both the left and right ILF, while ADOS severity did not. In sum, our results suggest that these correlations reflect the children’s developing lexical abilities as they link objects with their labels, and that using children’s actual level of language development might be a useful correlate of neural development.
Acknowledgments
This research was funded by NIMH 1R01MH089626-01, U24MH081810, R00MH085099-01A1, U54 HD079125 to the UC Davis MIND Institute, and F32MH099699 to R. Johnson, as well as by a sabbatical grant from the University of Connecticut to L. Naigles. We are extremely grateful to the children and parents who participated in the study, and to all of the research staff who have contributed to the Autism Phenome Project. The authors state that they have no conflicts of interest to declare.
References
- American Psychiatric Association, editor. Diagnostic and statistical manual of mental disorders. 5. Washington, DC: American Psychiatric Publishing; 2013. https://doi.org/10.1176/appi.books.9780890425596.893619. [Google Scholar]
- Ben-Itzchak E, Watson L, Zachor D. Cognitive ability is associated with different outcome trajectories in ASD. Journal of Autism and Developmental Disorders. 2014;44:2221–2229. doi: 10.1007/s10803-014-2091-0. [DOI] [PubMed] [Google Scholar]
- Bigler E, Mortensen S, Neelyey E, Ozonoff S, Krasny L, Johnson M, … Lainhart J. Superior temporal gyrus, language function, and autism. Developmental Neuropsychology. 2007;31:217–238. doi: 10.1080/87565640701190841. [DOI] [PubMed] [Google Scholar]
- Brauer J, Anwander A, Friederici AD. Neuroanatomical prerequisites for language functions in the maturing brain. Cerebral Cortex. 2011;21:459–466. doi: 10.1093/cercor/bhq108. [DOI] [PubMed] [Google Scholar]
- Cardoso-Martins C, Da Sliva JR. Cognitive and language correlates of hyperlexia: evidence from children with autism spectrum disorders. Reading and Writing. 2010;23:129–145. [Google Scholar]
- Cascio CJ, Gerig G, Piven J. Diffusion tensor imaging: application to the study of the developing brain. Journal of the American Academy of Child and Adolescent Psychiatry. 2007;46:213–223. doi: 10.1097/01.chi.0000246064.93200.e8. [DOI] [PubMed] [Google Scholar]
- Chang LC, Jones DK, Pierpaoli C. RESTORE: robust estimation of tensors by outlier rejection. Magnetic Resonance in Medicine. 2005;53:1088–1095. doi: 10.1002/mrm.20426. [DOI] [PubMed] [Google Scholar]
- Concha L, Livy DJ, Beaulieu C, Wheatley BM, Gross DW. In vivo diffusion tensor imaging and histopathology of the fimbria-fornix in temporal lobe epilepsy. Journal of Neuroscience. 2010;30:996–1002. doi: 10.1523/JNEUROSCI.1619-09.2010. [DOI] [PMC free article] [PubMed] [Google Scholar]
- De Fossé L, Hodge SM, Makris N, Kennedy DN, Caviness VS, Jr, McGrath L, … Harris GJ. Language-association cortex asymmetry in autism and specific language impairment. Annals of Neurology. 2004;56:757–766. doi: 10.1002/ana.20275. [DOI] [PubMed] [Google Scholar]
- Deniz Can D, Richards T, Kuhl P. Early gray-matter and white-matter concentration in infancy predict later language skills: a whole brain voxel-based morphometry study. Brain & Language. 2013;124:34–44. doi: 10.1016/j.bandl.2012.10.007. [DOI] [PMC free article] [PubMed] [Google Scholar]
- Dunn LM, Dunn LM. Examiner’s manual for the PPVT-III peabody picture vocabulary test: form IIIA and form IIIB. AGS 1997 [Google Scholar]
- Eigsti IM, Bennetto L, Dadlani M. Beyond pragmatics: morphosyntactic development in autism. Journal of Autism and Developmental Disorders. 2007;37:1007–1023. doi: 10.1007/s10803-006-0239-2. [DOI] [PubMed] [Google Scholar]
- Eyler LT, Pierce K, Courchesne E. A failure of left temporal cortex to specialize for language is an early emerging and fundamental property of autism. Brain. 2012;135:949–960. doi: 10.1093/brain/awr364. [DOI] [PMC free article] [PubMed] [Google Scholar]
- Fenson L, Dale PS, Reznick JS, Thal D, Bates E, Hartung JP, … Elizabeth B. The MacArthur communicative development inventories: user’s guide and technical manual. Baltimore: Paul H. Brokes Publishing Co; 1993. [Google Scholar]
- Fiebach C, Friederici A, Müller K, von Cramon DY, Hernandez A. Distinct brain representations for early and late learned words. NeuroImage. 2003;19:1627–1637. doi: 10.1016/s1053-8119(03)00227-1. [DOI] [PubMed] [Google Scholar]
- Friederici A, Skeide M. Neurocognition of language development. In: Bavin E, Naigles L, editors. Cambridge Handbook of Child Language. 2. Cambridge: CUP; 2015. pp. 61–88. [Google Scholar]
- Gotham K, Pickles A, Lord C. Standardizing ADOS scores for ameasure of severity in autism spectrum disorders. Journal of Autism and Developmental Disorders. 2009;39:693–705. doi: 10.1007/s10803-008-0674-3. https://doi.org/10.1007/s10803-008-0674-3. [DOI] [PMC free article] [PubMed] [Google Scholar]
- Groen WB, Zwiers MP, van der Gaag RJ, Buitelaar JK. The phenotype and neural correlates of language in autism: an integrative review. Neuroscience and Behavioral Reviews. 2008;32:1416–1425. doi: 10.1016/j.neubiorev.2008.05.008. [DOI] [PubMed] [Google Scholar]
- Hoff E. Language development. Cengage Learning 2013 [Google Scholar]
- Huang H, Zhang J, Wakana S, Zhang W, Ren T, Richards LJ, … Mori S. White and gray matter development in human fetal, newborn and pediatric brains. Neuroimage. 2006;33:27–38. doi: 10.1016/j.neuroimage.2006.06.009. [DOI] [PubMed] [Google Scholar]
- Johnson RT, Yeatman JD, Wandell BA, Buonocore MH, Amaral DG, Nordahl CW. Diffusion properties of major white matter tracts in young, typically developing children. Neuroimage. 2014;88:143–154. doi: 10.1016/j.neuroimage.2013.11.025. [DOI] [PMC free article] [PubMed] [Google Scholar]
- Joseph R, Fricker Z, Fenoglio A, Lindgren KA, Knaus TA, Tager-Flusberg H. Structural asymmetries of language-related gray and white matter and their relationship to language function in young children with ASD. Brain Imaging and Behavior. 2014;8:60–72. doi: 10.1007/s1168,2-013-9245-0. [DOI] [PubMed] [Google Scholar]
- Kim JH, Loy DN, Liang HF, Trinkaus K, Schmidt RE, Song SK. Noninvasive diffusion tensor imaging of evolving white matter pathology in a mouse model of acute spinal cord injury. Magnetic Resonance in Medicine. 2007;58:253–260. doi: 10.1002/mrm.21316. [DOI] [PubMed] [Google Scholar]
- Kjelgaard M, Tager-Flusberg H. An investigation of language impairment in autism: implications for genetic subgroups. Language & Cognitive Processes. 2001;16:287–308. doi: 10.1080/01690960042000058. [DOI] [PMC free article] [PubMed] [Google Scholar]
- Knaus TA, Silver AM, Kennedy M, Lindgren KA, Dominick KC, … Tager-Flusberg H. Language laterality in autism spectrum disorder and typical controls: a functional, volumetric, and diffusion tensor MRI study. Brain and Language. 2010;112:113–120. doi: 10.1016/j.bandl.2009.11.005. [DOI] [PMC free article] [PubMed] [Google Scholar]
- Kuhl PK, Coffey-Corina S, Padden D, Munson J, Estes A, Dawson G. Brain responses to words in 2-year-olds with autism predict developmental outcomes at age 6. PloS One. 2013;8:e64967. doi: 10.1371/journal.pone.0064967. [DOI] [PMC free article] [PubMed] [Google Scholar]
- Landa R, Gross A, Stuart E, Faherty A. Developmental trajectories in children with and without autism spectrum disorders: the first 3 years. Child Development. 2013;84:429–442. doi: 10.1111/j.1467-8624.2012.01870.x. [DOI] [PMC free article] [PubMed] [Google Scholar]
- LeCouteur A, Haden G, Hammal D, McConachie H. Diagnosing autism spectrum disorders in pre-school children using two standardised assessment instruments: the ADI-R and the ADOS. Journal of Autism and Developmental Disorders. 2008;38:362–372. doi: 10.1007/s10803-007-0403-3. [DOI] [PubMed] [Google Scholar]
- Lombardo M, Pierce K, Eyler L, Barnes C, Ahrens-Barbeau C, Solso K, … Courchesne E. Different functional neural substrates for good and poor language outcomes in autism. Neuron. 2015;86:1–11. doi: 10.1016/j.neuron.2015.03.023. [DOI] [PMC free article] [PubMed] [Google Scholar]
- Lord C, Rutter M, DiLavore PC, Risi S. Autism diagnostic observation schedule—WPS (ADOS-WPS) Los Angeles: Western Psychological Services; 1999. [Google Scholar]
- Mandonnet E, Gatignol P, Duffau H. Evidence for an occipito-temporal tract underlying visual recognition in picture naming. Clinical Neurology and Neurosurgery. 2009;111:601–605. doi: 10.1016/j.clineuro.2009.03.007. [DOI] [PubMed] [Google Scholar]
- Markham JA, Greenough WT. Experience-driven brain plasticity: beyond the synapse. Neuron Glia Biology. 2004;1:351–363. doi: 10.1017/s1740925x05000219. [DOI] [PMC free article] [PubMed] [Google Scholar]
- Mauchly JW. Significance test for sphericity of a normal n-variate distribution. The Annals of Mathematical Statistics. 1940;11:204–209. [Google Scholar]
- Mervis C. Cross-etiology comparisons of cognitive and language development. In: Rice M, Warren S, editors. Developmental language disorders: from phenotypes to etiologies. Hillsdale, NJ: Erlbaum; 2004. pp. 153–186. [Google Scholar]
- Mills BD, Lai J, Brown TT, Erhart M, Halgren E, Reilly J, … Moses P. Gray matter structure and morphosyntax within a spoken narrative in TD children and children with HFA. Developmental Neuropsychology. 2013;38:461–480. doi: 10.1080/87565641.2013.820306. [DOI] [PubMed] [Google Scholar]
- Mullen EM. Mullen scales of early learning. Circle Pine, MN: American Guidance Service, Inc; 1995. [Google Scholar]
- Munson J, Faja S, Meltzoff A, Abbott R, Dawson G. Neuro-cognitive predictors of social and communicative developmental trajectories in preschoolers with ASD. Journal of the International Neuropsychological Society. 2008;14:956–966. doi: 10.1017/S1355617708081393. [DOI] [PMC free article] [PubMed] [Google Scholar]
- Nagae LM, Zarnow DM, Blaskey L, Dell J, Khan SY, Qasmieh S, … Roberts TP. Elevated mean diffusivity in the left hemisphere superior longitudinal fasciculus in autism spectrum disorders increases with more profound language impairment. AJNR. American Journal of Neuroradiology. 2012;33:1720–1725. doi: 10.3174/ajnr.A3037. [DOI] [PMC free article] [PubMed] [Google Scholar]
- Naigles LR, Chin I. Language development in children with autism. In: Bavin E, Naigles L, editors. Cambridge Handbook of Child Language. 2. Cambridge: CUP; 2015. pp. 637–658. [Google Scholar]
- Nordahl CW, Iosif AM, Young GS, Perry LM, Dougherty R, Lee A, … Amaral DG. Sex differences in the corpus callosum in preschool-aged children with autism spectrum disorder. Molecular Autism. 2015;6:26. doi: 10.1186/s13229-015-0005-4. [DOI] [PMC free article] [PubMed] [Google Scholar]
- Nordahl CW, Lange N, Li DD, Barnett LA, Lee A, Buonocore MH, … Amaral DG. Brain enlargement is associated with regression in preschool-age boys with autism spectrum disorders. Proceedings of the National Academy of Sciences of the United States of America. 2011;108:20195–20200. doi: 10.1073/pnas.1107560108. [DOI] [PMC free article] [PubMed] [Google Scholar]
- Nordahl CW, Scholz R, Yang X, Buonocore MH, Simon T, Rogers S, Amaral DG. Increased rate of amygdala growth in children aged 2 to 4 years with autism spectrum disorders. A Longitudinal Study. Archives of General Psychiatry. 2012;69:53–61. doi: 10.1001/archgenpsychiatry.2011.145. [DOI] [PMC free article] [PubMed] [Google Scholar]
- Nordahl CW, Simon TJ, Zierhut C, Solomon M, Rogers SJ, Amaral DG. Brief report: methods for acquiring structural MRI data in very young children with autism without the use of sedation. Journal of Autism and Developmental Disorders. 2008;38:1581–1590. doi: 10.1007/s10803-007-0514-x. [DOI] [PMC free article] [PubMed] [Google Scholar]
- Northam GB, Liégeois F, Chong WK, Baker K, Tournier JD, Wyatt JS, … Morgan A. Speech and oromotor outcome in adolescents born preterm: relationship to motor tract integrity. The Journal of Pediatrics. 2012;160:402–408. e1. doi: 10.1016/j.jpeds.2011.08.055. [DOI] [PMC free article] [PubMed] [Google Scholar]
- Ohta H, Nordahl CW, Iosif AM, Lee A, Rogers S, Amaral DG. Increased surface area, but not cortical thickness, in a subset of young boys with autism spectrum disorder. Autism Research. 2016;9:232–248. doi: 10.1002/aur.1520. [DOI] [PMC free article] [PubMed] [Google Scholar]
- Pan C, Peck KK, Young RJ, Holodny AI. Somatotopic organization of motor pathways in the internal capsule: a probabilistic diffusion tractography study. AJNR American Journal of Neuroradiology. 2012;33:1274–1280. doi: 10.3174/ajnr.A2952. [DOI] [PMC free article] [PubMed] [Google Scholar]
- Perryman TY, Carter AS, Messinger DS, Stone WL, Ivanescu AE, Yoder PJ. Brief report: parental child-directed speech as a predictor of receptive language in children with autism symptomatology. Journal of Autism and Developmental Disorders. 2013;43:1983–1987. doi: 10.1007/s10803-012-1725-3. [DOI] [PMC free article] [PubMed] [Google Scholar]
- Rapin I, Dunn MA, Allen DA, Stevens MC, Fein D. Subtypes of language disorders in school-age children with autism. Developmental Neuropsychology. 2009;34:66–84. doi: 10.1080/87565640802564648. [DOI] [PubMed] [Google Scholar]
- Saur D, Kreher BW, Schnell S, Kümmerer D, Kellmeyer P, Vry MS, … Huber W. Ventral and dorsal pathways for language. Proceedings of the National Academy of Sciences. 2008;105:18035–18040. doi: 10.1073/pnas.0805234105. [DOI] [PMC free article] [PubMed] [Google Scholar]
- Saur D, Schelter B, Schnell S, Kratochvil D, Küpper H, Kellmeyer P, … Mader W. Combining functional and anatomical connectivity reveals brain networks for auditory language comprehension. Neuroimage. 2010;49:3187–3197. doi: 10.1016/j.neuroimage.2009.11.009. [DOI] [PubMed] [Google Scholar]
- Sharda M, Foster N, Tryfon A, Doyle-Thomas K, Anagnostou E, Evans A, … Hyde K. Structural language abilities are related to cortical structure and covariance in Autism Spectrum Disorder. Poster presented at the International Meetings for Autism Research; Baltimore, MD. 2016. [Google Scholar]
- Shinoura N, Suzuki Y, Tsukada M, Yoshida M, Yamada R, Tabei Y, … Yagi K. Deficits in the left inferior longitudinal fasciculus results in impairments in object naming. Neurocase. 2010;16:135–139. doi: 10.1080/13554790903329174. [DOI] [PubMed] [Google Scholar]
- Sigman M, McGovern CW. Improvement in cognitive and language skills from preschool to adolescence in autism. Journal of Autism and Developmental Disorders. 2005;35:15–23. doi: 10.1007/s10803-004-1027-5. [DOI] [PubMed] [Google Scholar]
- Skeide M, Brauer J, Friederici A. Brain functional and structural predictors of language performance. Cerebral Cortex. 2016;26:2127–2139. doi: 10.1093/cercor/bhv042. [DOI] [PubMed] [Google Scholar]
- Sled JG, Zijdenbos AP, Evans AC. A nonparametric method for automatic correction of intensity non-uniformity in MRI data. IEEE Transactions on Medical Imaging. 1998;17:87–97. doi: 10.1109/42.668698. [DOI] [PubMed] [Google Scholar]
- Smith SM. Fast robust automated brain extraction. Human Brain Mapping. 2002;17:143–155. doi: 10.1002/hbm.10062. [DOI] [PMC free article] [PubMed] [Google Scholar]
- Song SK, Sun SW, Ju WK, Lin SJ, Cross AH, Neufeld AH. Diffusion tensor imaging detects and differentiates axon and myelin degeneration in mouse optic nerve after retinal ischemia. Neuroimage. 2003;20:1714–1722. doi: 10.1016/j.neuroimage.2003.07.005. [DOI] [PubMed] [Google Scholar]
- Song SK, Sun SW, Ramsbottom MJ, Chang C, Russell J, Cross AH. Dysmyelination revealed through MRI as increased radial (but unchanged axial) diffusion of water. Neuroimage. 2002;17:1429–1436. doi: 10.1006/nimg.2002.1267. [DOI] [PubMed] [Google Scholar]
- Tager-Flusberg H. Defining language phenotypes in autism. Neuroscience Research. 2006;6:219–224. [Google Scholar]
- Tager-Flusberg H, Paul R, Lord C, Volkmar F, Paul R, Klin A. Language and communication in autism. Handbook of autism and pervasive developmental disorders. 2005;1:335–364. [Google Scholar]
- Tek S, Mesite L, Fein D, Naigles L. Longitudinal analyses of expressive language development reveal two distinct language profiles among young children with autism spectrum disorders. Journal of Autism and Developmental Disorders. 2014;44:75–89. doi: 10.1007/s10803-013-1853-4. [DOI] [PMC free article] [PubMed] [Google Scholar]
- Trivedi R, Agarwal S, Rathore RK, Saksena S, Tripathi RP, Malik GK, … Gupta RK. Understanding development and lateralization of major cerebral fiber bundles in pediatric population through quantitative diffusion tensor tractography. Pediatric Research. 2009;66:636–641. doi: 10.1203/PDR.0b013e3181bbc6b5. [DOI] [PubMed] [Google Scholar]
- Verhoeven JS, Rommel N, Prodi E, Leemans A, Zink I, Vandewalle E, … Sunaert S. Is there a common neuroanatomical substrate of language deficit between autism spectrum disorder and specific language impairment? Cerebral Cortex. 2012;22:2263–2271. doi: 10.1093/cercor/bhr292. [DOI] [PubMed] [Google Scholar]
- Verly M, Verhoeven J, Zink I, Mantini D, Oudenhove LV, Lagae L, … Rommell N. Structural and functional underconnectivity as a negative predictor for language in autism. Human Brain Mapping. 2013;35:3602–3615. doi: 10.1002/hbm.22424. [DOI] [PMC free article] [PubMed] [Google Scholar]
- Wolff JJ, Gu H, Gerig G, Elison JT, Styner M, Gouttard S, … Network I. Differences in white matter fiber tract development present from 6 to 24 months in infants with autism. American Journal of Psychiatry. 2012;169:589–600. doi: 10.1176/appi.ajp.2011.11091447. [DOI] [PMC free article] [PubMed] [Google Scholar]
- Yeatman JD, Dougherty RF, Myall NJ, Wandell BA, Feldman HM. Tract profiles of white matter properties: automating fiber-tract quantification. PLoS One. 2012;7:e49790. doi: 10.1371/journal.pone.0049790. [DOI] [PMC free article] [PubMed] [Google Scholar]
- Yim SH, Kim JH, Han ZA, Jeon S, Cho JH, Kim GS, … Lee JH. Distribution of the corticobulbar tract in the internal capsule. Journal of Neurological Sciences. 2013;334:63–68. doi: 10.1016/j.jns.2013.07.015. [DOI] [PubMed] [Google Scholar]
- Zhang J, Jones M, DeBoy CA, Reich DS, Farrell JAD, Hoffman PN, … Calabresi PA. Diffusion tensor magnetic resonance imaging of Wallerian degeneration in rat spinal cord after dorsal root axotomy. Journal of Neuroscience. 2009;29:3160–3171. doi: 10.1523/JNEUROSCI.3941-08.2009. [DOI] [PMC free article] [PubMed] [Google Scholar]