Context:
State health officials (SHOs) serve a critical role as the leaders of state public health systems. Despite their many responsibilities, there is no formal process for preparation to become an SHO, and few requirements influence the selection of an SHO. Furthermore, to date, no studies have examined SHO tenure or their experiences.
Objective:
This study examines SHO tenure over time and the relationship between SHO tenure and organizational and state attributes.
Design:
This longitudinal study employed primary data on SHOs and secondary data from the Association of State and Territorial Health Officials on organizational attributes of state public health agencies.
Setting:
This study examines SHOs within the United States.
Participants:
SHOs who served in years 1980-2017.
Main Outcome Measures:
Annual average SHO tenure; average SHO tenure by state.
Results:
In the 38 years of this study, 508 individuals served as SHOs in the 50 states and the District of Columbia. The average tenure over this period was 4.1 years, with a median tenure of 2.9 years. During the study period, almost 20% of SHOs served terms of 1 year or less. A total of 32 SHOs (32/508 or 6.3%) served for 10 years or longer. Excluding SHOs who served 10 years or longer (n = 32 SHOs who had a collective 478 years of tenure) reduces the average term in office to 3.5 years. The average number of new SHOs per year is 12.3. SHOs appointed by a board of health averaged more than 8 years in office compared with averages just under 4 years for those appointed by governors or secretaries of state agencies.
Conclusions:
There are notable differences in SHO tenure across states. Future research is needed to further examine SHO tenure, effectiveness, job satisfaction, transitions, and the relationship between SHOs and state health. It may be valuable to expand on opportunities for new SHOs to learn from peers who have moderate to long tenures as well as SHO alumni. Given that average SHO tenure is approximately 4 years and that an SHO could be thrust into the national spotlight at a moment's notice, governors may want to consider experience over partisanship as they appoint new SHOs.
Keywords: leadership, public health, state health official, tenure
State health agencies (SHAs) serve a critical role in the public health system.1 They are direct providers of public health services and create the environment that supports and coordinates local public health efforts. While the structure and scope of responsibility of those agencies vary from state to state, a typical SHA must coordinate a diverse set of programs including preventing disease and injuries, preventing the spread of communicable diseases, ensuring the safety of food from the farm to the table (including restaurant sanitation), running public health laboratories, and inspecting and licensing health care facilities.2 The leadership of our nation's SHAs is entrusted to a state health officer (SHO).
The SHO role was best described in a 2002 Institute of Medicine report that found:
Senior public health officials must have the preparation not only to manage a government agency but also to provide guidance to the workforce with regard to health goals or priorities, interact with stakeholders and constituency groups, provide policy direction to a governing board, and interact with other agencies at all levels of government whose actions and decisions affect the population whose health they are trying to assure. These tasks require a unique and demanding set of talents: professional expertise in the specific subject area; substantive expertise in the content and values of public health; and competencies in the core skills of leadership.3(p120)
In addition to running a broad set of complex and highly technical programs and managing budgets measured in hundreds of millions, if not billions of dollars, SHOs also operate in a political context requiring them to coordinate with the office of the governor and navigate the legislative process including appropriations.4,5 SHOs live at the nexus of science, the public interest, and the political system and must find the balance between each.6
SHOs must lead their agencies through preparation and response to biologic (anthrax), human-made (9/11 terrorist attacks), and natural disasters (Hurricane Katrina), as well as changing ecosystems, threats from infectious agents such as Zika virus, an ever-increasing aging population, a burgeoning epidemic of chronic diseases such as obesity and diabetes, and a changing public health workforce. However, despite these demands, there is no formal training process to become an SHO. Furthermore, there are no consistent standards for an SHO, leading to wide variability in the skills and abilities of those selected for the position contributing, in part, to rapid turnover.
The extant literature includes many studies that explore various aspects of the experiences of chief executive officers in for-profit and not-for-profit circumstances.7,8 However, despite the importance of the SHO as the chief executive of our nation's SHAs, there is a paucity of scholarly attention paid to SHOs to date. Leadership is important to the success of any organization, especially SHAs; however, the lack of study makes defining, supporting, or improving this position challenging.9 This study seeks to begin to address this gap by documenting turnover of this important position in state government. This article presents compiled information related to tenure of the 507 individuals who served as an SHO in the 50 states and the District of Columbia from 1980 to 2017. To our knowledge, findings from this work provide the first empirical examination of SHOs and their tenure.
Methods
Study design and population
This study presents a longitudinal examination (1980-2017) of SHO tenure and state characteristics.
Data collection
Data were collected on SHOs in the 50 states and the District of Columbia from numerous sources. Data on the SHOs specifically came from the Association of State and Territorial Health Officials' (ASTHO's) comprehensive listings of current and former SHOs, state health department Web sites for each state and the District of Columbia, through direct requests for information from SHAs, and the National Governors Association Web site. Data on SHO appointing authority and governance came from the ASTHO 2005 SHO Salary and Agency Infrastructure Survey.
Variables
For each state, we collected information on the number of years in office for every SHO who served from 1980 to 2017. Tenure was examined across all states and the District of Columbia for each year in the study. Data for SHOs were recorded for 1 full year of their last calendar year if they served any time as an SHO in that year, regardless of whether or not they served a full year. For terms that began prior to 1980, SHOs were credited for those terms in 1980. For example, if a term began in June 1976, the years in office beginning in 1980 were documented as 4 (1977 [first full year], 1978, 1979, and 1980). In addition, for each state, we documented the appointing authority of the SHO (eg, governor, secretary of state agency, or board of health).10
Data analysis
The total number of years served by each SHO was added for all SHOs in a given state across the study period and then divided by the total number of SHOs in that particular state to get a mean SHO tenure for each state. Total years as an SHO were also calculated for each year of the data and used to provide an aggregate mean SHO tenure by year across the 50 states and the District of Columbia. State mean SHO tenure was examined by type of SHO appointing authority. Maps were generated to present SHO tenure by state and state appointing authority. Data analysis was performed using Microsoft Excel. Maps were created using Arc GIS.
Results
SHO tenure
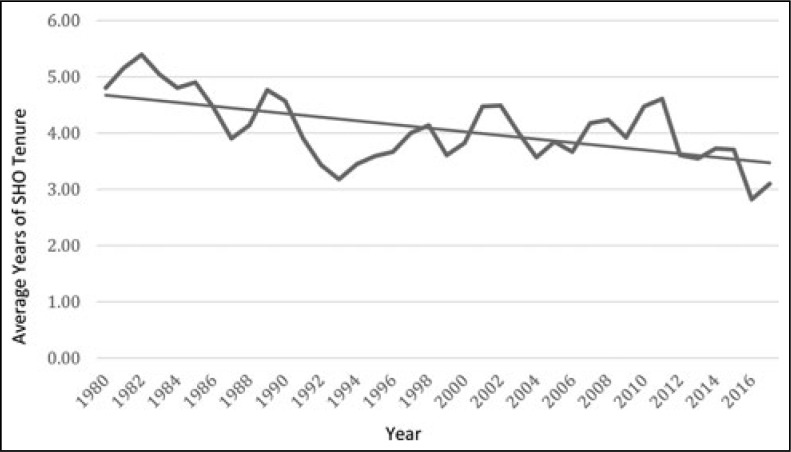
In the 38 years between 1980 and 2017, a total of 508 individuals served as SHOs in the 50 states and the District of Columbia. The average tenure over the 38-year time frame was 4.1 years, with a median tenure of 2.9 years. Tenure ranged from 1 to 24 years. In the 1980s, the average annual SHO tenure was the highest, with 4.7 years on average in the decade (Figure 1). In the last decade of the study (8 years across 2010-2017), the average tenure dropped to 3.7 years.
FIGURE 1.
Average SHO Tenure by Year, 1980-2017a
Abbreviation: SHO, state health official.
aData on SHOs in all 50 states and the District of Columbia.
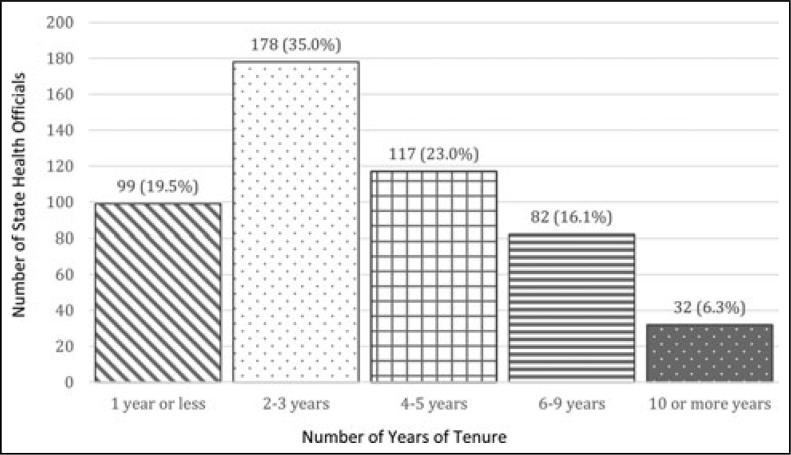
A total of 98 SHOs served for 1 year or less (99/508 or 19.5%) (Figure 2). Another 178 SHOs served for 2 or 3 years in total (178/50 or 35.0%), 117 served for 4 or 5 years (117/508 or 23.0%), 82 served for 6 to 9 years (82/508 or 16.1%), and 32 (32/508 or 6.3%) served for 10 years or longer. Two SHOs served for more than 24 years in the period of our study (in both cases, their service began prior to 1980). Excluding the small group of outliers who served 10 years or longer (n = 32 SHOs who had a collective 478 years of tenure) reduces the average term in office to 3.5 years. Alternatively, excluding the SHOs who served only 1 year (n = 99), approximately 20% of the SHOs overall, raises the average tenure to 5.2 years.
FIGURE 2.
State Health Official Tenure, 1980-2017a
aData on 508 state health officials in all 50 states and the District of Columbia during the study.
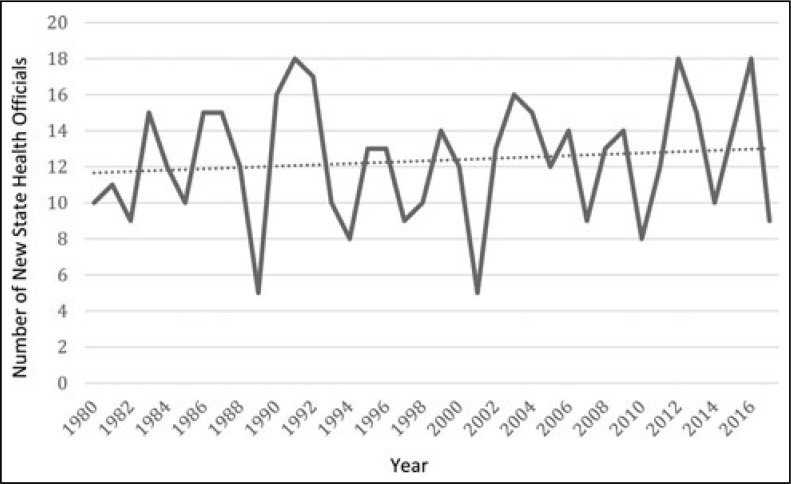
A measure of volatility in leadership of state health departments is the number of new SHOs who are appointed each year. This number has ranged from as few as 5 SHOs in 1989 and 2001 to 18 new SHOs in 1991, 2012, and 2016 (Figure 3). The average number of new SHOs per year across the study period is 12. In the 6 years between 9/11 and the year following Hurricane Katrina, the 51 SHO positions turned over 76 times, with only 6 states retaining the SHO who was in place in 2001 when 9/11 took place.
FIGURE 3.
Number of New State Health Officials Annually, 1980-2017a
aData on state health officials in all 50 states and the District of Columbia.
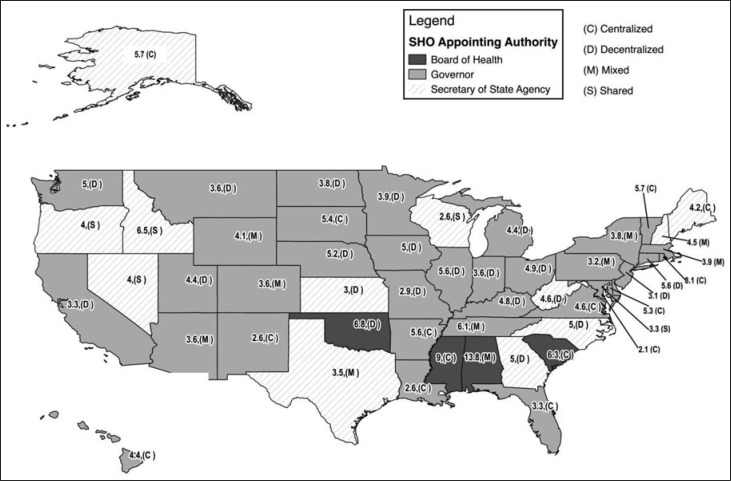
By state, the average tenure of SHOs ranges from 2.0 years in the District of Columbia and 2.6 years in Louisiana/New Mexico/Wisconsin to 13.75 years in Alabama. Figure 4 maps mean SHO tenure by state.
FIGURE 4.
Mean SHO Tenure by State SHO Appointing Authority and Public Health Agency Organizational Structure
Abbreviation: SHO, state health official.
Authority for appointing the SHO
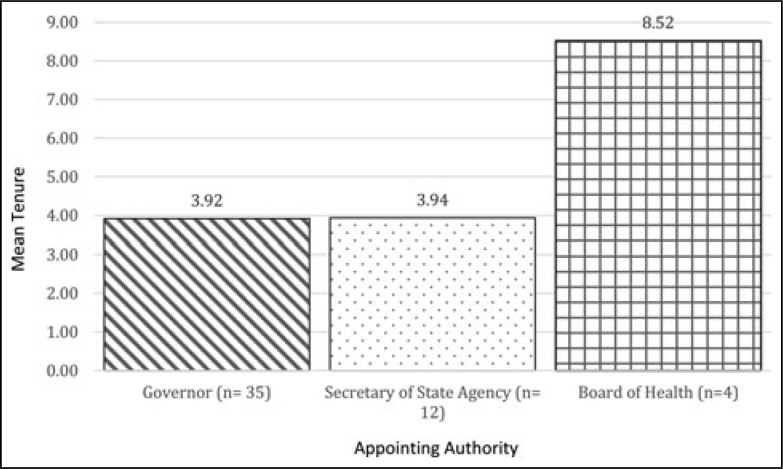
The authority appointing an SHO can have an impact on both his or her ability to function independently and his or her tenure. In 35 states, SHOs are appointed by a governor. In 12 states, SHOs are appointed by the secretary of an umbrella health-related agency, and in 4 states, SHOs are appointed by a board of health. Note that for the District of Columbia, the mayor was counted as a governor.
SHOs averaged 8.5 years in office between 1980 and 2017 when a board of health appointed them to office (Figure 5). With the umbrella agency secretary as the appointing authority, SHO tenure averaged 3.9 years. With the governor as the appointing authority, SHO tenure averaged 3.9 years.
FIGURE 5.
Mean SHO Term by Appointing Authority, 1980-2017a
Abbreviations: ASTHO, Association of State and Territorial Health Officials; SHO, state health official.
aData on appointing authority are from the ASTHO 2005 SHO Salary and Agency Infrastructure Survey. A total of 35 states place SHO appointing authority with the governor, 12 with a secretary of the state Health and Human Services Agency, and 4 with a board of health. The District of Columbia is included in these data and counted as a state where a governor (mayor) appoints the SHO.
Discussion
Leadership stability is important to the success of any organization including a state public health agency.7,8 Although the tenure of the SHO has a direct impact on the leadership of state public health agencies, SHO tenure has not previously been quantified or its causes and impacts studied.
Key findings from this study indicate that average SHO tenure across the last 38 years is approximately 4 years. Removing the influence of those SHOs with extremely long tenures, the average SHO tenure is actually closer to 3.5 years. SHOs in states that have boards of health as the appointing authority have longer tenures that are, on average, double the tenures of SHOs in states where the secretary of Health Human Services Agency (HHS) or the governor is the appointing authority.
Other important findings from this work illustrate that there are notable differences in SHO tenure across states—ranging from less than 3 years of average SHO tenure in 5 states to 6 years or more across 7 states. Understanding the variation in state-level SHO tenure may be valuable for improving tenure and, ultimately, the effectiveness of future SHOs and the agencies in which they lead.
In terms of time trends, there is a decrease in annual SHO tenure across the collective states over time. In the 1980s, the average annual SHO tenure was the highest, with 4.7 years on average for the decade. Over the last 8 years of the study, the annual SHO tenure averaged 3.7 years—a full year less tenure than SHOs in the 1980s.
The last 4 decades have included numerous events that challenged even those SHOs with long tenures. For example, the September 11, 2001, events shocked all agencies that supported the response. The nation was further shocked by the anthrax bioterrorism that followed. These 2 events catapulted the SHAs and their crucial role in homeland security and disaster preparedness and response into national awareness. Working with federal counterparts, SHOs developed a strategy of “dual use” where funds for preparedness would be used to enhance the capacity to respond to public health threats and enhance the ability of the public health system to respond to everyday challenges. It was the job of SHOs to operationalize this complex strategy. However, findings indicate that in the subsequent 6 years, the 51 SHO positions turned over 76 times, with only 6 states retaining the SHO who was in place in 2001 when the “dual-use” strategy was developed. This churn is exactly why this current study has been conducted and why more research is necessary.
While this study presents new data on SHO tenure and trends over time, numerous questions remain. We still need more extensive research on SHO tenure and leadership effectiveness. We know from the management field that disruptions to leadership and a lack of leadership continuity can impact organizational performance and effectiveness.8 More research on the implications of SHO tenure is needed to be able to dig deeper into this issue of organizational performance within state public health agencies. Furthermore, while many states have a requirement that the SHO be a medical doctor, the extent to which medical knowledge and skills infer public health leadership competency remains unknown. Given the many responsibilities of an SHO, is it more important that they have organizational management and leadership experience and training or that they have medical care knowledge? Perhaps, it would be best to think of this not as a question of which is more important but that there is actually a need for both sets of experience and training, given the magnitude and complexity of the SHO job. Still unanswered are the questions raised in the 1988 Future of Public Health Report: on the one hand, “technical expertise bearing on some public health problems may not be appropriately considered by the political policy makers,” while on the other hand, “the technical expert may not understand or appreciate the appropriate and fundamental role for the political process in policy-making.”11(p119) These issues warrant further attention.
Implications for Policy & Practice
It may be beneficial to identify leadership skill assessment tools, which can be used to prioritize and develop essential skills in early years as an SHO. With more than half of SHOs serving more than 3 years, investments in skill development in the first year may yield long-term results.
Findings from this study suggest that it may be valuable to expand on opportunities for new SHOs to learn from peers who have moderate to long tenures as well as SHO alumni. In addition, it may be beneficial to develop regional support structures to improve SHO collaboration and collective learning.
Given that average SHO tenure is approximately 4 years and that an SHO could be thrust into the national spotlight at a moment's notice, governors may want to consider experience over partisanship as they appoint new SHOs.
Limitations
Although this is the first study to provide empirical information about SHOs and their tenure, the data used for this work are not without limitations. First, a number of assumptions had to be made to complete these analyses. Specifically, for the analysis of SHO tenure by appointing authority, we relied on appointing authority information at only one point in time (2005). It would be most appropriate to examine this relationship using appointing authority information for each year, as authority may have changed in some states in the 38 years of our study. However, this information is not routinely collected, and although it can be collected, it was not available at the time of this study. Similar concerns exist for the variable that was used to examine organization structure as it relates to SHO tenure. These structures may also have changed over time, and only 1 year of organizational structure data were used for the figure that presented organizational structure and SHO tenure. A second limitation of this study is that we used year as the measure of tenure and as such it was not feasible to account for more than 1 SHO per year. This meant that an SHO who ended his or her term in April of a year was counted for the entire year, whereas the tenure of the new SHO who followed this person was counted for the next year. Finally, data used in this study may have underreported the number of new SHOs overall in the study period. In some states, there have been more than 1 new SHO per year; however, only 1 new SHO would have been counted for that year, potentially underreporting this information. Future work will more closely examine these data points as more information becomes available.
Footnotes
The authors are indebted to John Lumpkin for his pioneering work toward the collection of the first 26 years of data and upon which the subsequent data were added. The authors thank Sue Hancock and Hannah Bauer for their diligent efforts to assemble the state health official information, without which they could not have completed this work. The authors also thank the Association of State and Territorial Health Officials for its assistance in historical data review and the Robert Wood Johnson Foundation for support toward the first phase of the project.
The authors declare no conflicts of interest.
References
- 1.Ensign K. The value of public health. J Public Health Manag Pract. 2017;23(2):195–197. [DOI] [PubMed] [Google Scholar]
- 2.Beitsch LM, Brooks RG, Grigg M, Menachemi N. Structure and function of state public health agencies. Am J Public Health. 2006;96(1):167–172. [DOI] [PMC free article] [PubMed] [Google Scholar]
- 3.Institute of Medicine. The Future of the Public's Health in the 21st Century. Washington, DC: The National Academies Press; 2002. [Google Scholar]
- 4.Sellers K, Leider JP, Harper E, et al. The Public Health Workforces Interest and Needs Survey: the first nation al survey of state health agencies employees. J Public Health Manag Pract. 2015;21(6):S13–S27. [DOI] [PMC free article] [PubMed] [Google Scholar]
- 5.Koh HK. Navigating government service as a physician. Health Educ Behav. 2016;43(1):7–10. [DOI] [PubMed] [Google Scholar]
- 6.Hunter EL. Politics and public health—engaging the third rail. J Public Health Manag Pract. 2016;22(5):436–441. [DOI] [PMC free article] [PubMed] [Google Scholar]
- 7.Sridhara UV, St John CH. The effects of organizational stability and leadership structure on firm performance. J Managerial Issues. 1998;10(4):469–484. [Google Scholar]
- 8.Özaralli N. Effects of transformational leadership on empowerment and team. Effectiveness. Leadersh Organ Dev J. 2003;24(6):335–347. [Google Scholar]
- 9.Halverson P, Castrucci BC, Moffatt S, Hancock SE, Boedigheimer SF, Baker ED. State health officials—defining success and identifying critical success factors. J Public Health Manag Pract. 2017;23(2):192–194. [DOI] [PubMed] [Google Scholar]
- 10.Association of State and Territorial Health Officials. ASTHO Profile of State Public Health. Vol 3. Arlington, VA: Association of State and Territorial Health Officials; 2014. http://www.astho.org/Profile/Volume-Three. Accessed April 30, 2017. [Google Scholar]
- 11.Institute of Medicine. The Future of Public Health. Washington, DC: The National Academies Press; 1988. [Google Scholar]


