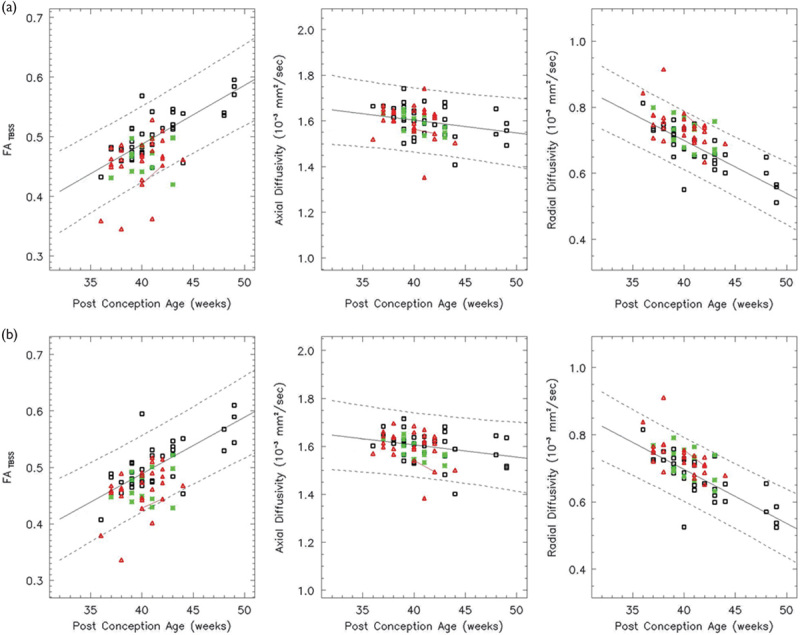
Fig. 6.

Both the left (a) and right (b) PLIC show a linear increase in the FA and a linear decrease in the RD over the age range studied (white: controls, red: HIE patients, and green: ECMO patients). The left PLIC shows a linear decrease in the AD, but the right PLIC does not (F>0.05). In all, 86% of the HIE patients and the ECMO patients have FA values within the 95% confidence intervals. AD, axial diffusivity; ECMO, extracorporeal membrane oxygenation; FA, fractional anisotropy; HIE, hypoxic–ischemic encephalopathy; PLIC, posterior limb of the internal capsule; RD, radial diffusivity.
