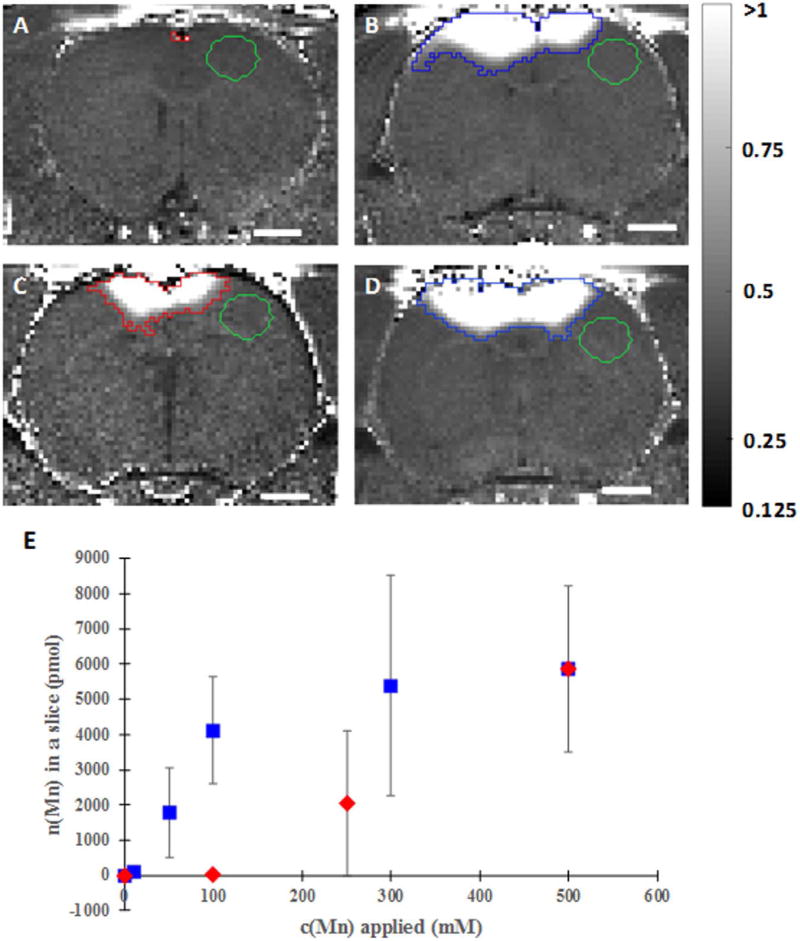
Fig. 3. Concentration dependence and the calcium addition effect on transcranial manganese delivery efficiency.
R1-maps calculated from saturation recovery MR images of rats receiving - (A) 100 mM MnCl2 (slice shown is approximately 1.5 mm anterior from bregma), (B) 100 mM MnCl2+400 mM CaCl2 (slice is approximately −0.6 mm posterior from bregma), (C) 250 mM MnCl2 (slice shown is approximately −0.5 mm posterior from bregma) and (D) 300 mM MnCl2+200 mM CaCl2 (slice shown is approximately −0.6 mm posterior from bregma) on the bregma and dependence of total amount of manganese delivered to the brain on the concentration of manganese solution applied on the bregma, when only MnCl2 was applied (red diamonds) and when CaCl2 was added to the total concentration of 500 mM (blue squares) (E). Scale bar, 2 mm. R1 intensity scaling, 0.125–1 s−1. ROIs where T1 measurements were made are shown on the top of the R1 maps in red or blue, whereas the green ROIs represent the background. Ca2+ increases the efficiency of Mn2+ delivery through the skull. Each data point represents the average of three animals.

