

Abstract
The flanker task is a test of visual selective attention that has been widely used to probe error monitoring, response conflict, and related constructs. However, to date, few studies have focused on the selective attention component of this task and imaged the underlying oscillatory dynamics serving task performance. In this study, 21 healthy adults successfully completed an arrow-based version of the Eriksen flanker task during magnetoencephalography (MEG). All MEG data were pre-processed and transformed into the time-frequency domain. Significant oscillatory brain responses were imaged using a beamforming approach, and voxel time series were extracted from the peak responses to identify the temporal dynamics. Across both congruent and incongruent flanker conditions, our results indicated robust decreases in alpha (9–12 Hz) activity in medial and lateral occipital regions, bilateral parietal cortices, and cerebellar areas during task performance. In parallel, increases in theta (3–7 Hz) oscillatory activity were detected in dorsal and ventral frontal regions, and the anterior cingulate. As per conditional effects, stronger alpha responses (i.e., greater desynchronization) were observed in parietal, occipital, and cerebellar cortices during incongruent relative to congruent trials, whereas the opposite pattern emerged for theta responses (i.e., synchronization) in the anterior cingulate, left dorsolateral prefrontal, and ventral prefrontal cortices. Interestingly, the peak latency of theta responses in these latter brain regions was significantly correlated with reaction time, and may partially explain the amplitude difference observed between congruent and incongruent trials. Lastly, whole-brain exploratory analyses implicated the frontal eye fields, right temporoparietal junction, and premotor cortices. These findings suggest that regions of both the dorsal and ventral attention networks contribute to visual selective attention processes during incongruent trials, and that such differential processes are transient and fully completed shortly after the behavioral response in most trials.
Keywords: magnetoencephalography, MEG, cortical, oscillation, alpha, theta
1. Introduction
Visual selective attention has been described using different metaphors such as a filter (Broadbent, 1958; Deutsch and Deutsch, 1963; Treisman, 1964), a spotlight (Norman, 1968; Posner et al., 1980), and a zoom-lens (Eriksen and St James, 1986). It has also been the topic of a number of neurocognitive reviews (Carrasco, 2011; Clark et al., 2015; Driver, 2001; Petersen and Posner, 2012), and a number of theories have been proposed. These theories include Feature-Integration Theory (Treisman and Gelade, 1980) and Attentional Engagement Theory (Duncan and Humphreys, 1992), among others, and while these theories have disagreed over particular details, they have generally agreed that the primary function of visual attention is to selectively process certain visual information within the larger visual field, while simultaneously blocking out distracting or unrelated stimuli (Carrasco, 2011; Driver, 2001). Visual selective attention is necessary for many goal-oriented behaviors, but its neurophysiological mechanisms, particularly the cortical dynamics, are not fully understood. The utilization of advanced technologies and methodologies could improve scientific understanding of these mechanisms, and could also be medically beneficial to a number of neurological (e.g., hemineglect) and psychiatric (e.g., attention deficit hyperactivity disorder) patient populations.
Building on decades of behavioral work, studies using functional neuroimaging methods have begun to characterize how the processes of visual attentional selection are achieved through distributed processing across widespread cortical networks (Clark et al., 2015; Petersen and Posner, 2012). Two such networks include the dorsal attention network (DAN) and the ventral attention network (VAN). The DAN is thought to facilitate top-down control of attention for voluntary and goal-directed behaviors, and includes brain regions such as the frontal eye fields (FEF) and the intraparietal sulcus bilaterally (Corbetta et al., 2008; Corbetta and Shulman, 2002). Meanwhile, the VAN is believed to facilitate stimulus detection, particularly when unexpected or distracting stimuli are present (i.e., reorienting), and includes brain regions such as the temporoparietal junction (TPJ) and the ventral frontal cortex, with a right hemispheric dominance (Corbetta et al., 2008; Corbetta and Shulman, 2002). While anatomically and functionally separate, the DAN and VAN are both necessary for normal attentional function and have been shown to interact dynamically during attentional processing (Vossel et al., 2012, 2014).
A classic cognitive task for studying visual selective attention is the Eriksen flanker task (Eriksen and Eriksen, 1974). In this task, subjects are presented with a target stimulus that is surrounded by non-target or “flanker” stimuli, and the participant is instructed to respond to the target and ignore the flanking items. The flanker task normally includes congruent trials, where the flanker stimuli match the target and facilitate task completion, and incongruent trials, where the flanker and target stimuli are opposite and thus create an interference effect that hinders task performance (i.e., prolongs reaction time). Despite this interference effect, participants generally have high accuracy rates, and this is thought to reflect successful utilization of visual selective attention functions, as participants are able to focus on the target and ignore the flanking stimuli. Previous studies using flanker tasks during functional magnetic resonance imaging (fMRI) have identified brain regions that are involved in task performance, and these include the lateral prefrontal cortices, supplementary motor area (SMA), superior parietal lobe, anterior cingulate, and other regions (Botvinick et al., 1999; Bunge et al., 2002; Fassbender et al., 2006; Hazeltine et al., 2000; Lau et al., 2006; van Veen et al., 2001). Many of these fMRI studies have focused on the role of the anterior cingulate in response-conflict monitoring during flanker-type tasks (Botvinick et al., 2001, 2004), with much less emphasis being placed on the frontal and parietal regions that likely contribute to visual selective attention processes during flanker performance. Findings from neurophysiological studies using flanker tasks during electroencephalography (EEG) have been widely similar to the fMRI work, with emphasis on the anterior cingulate and its putative role in conflict monitoring (Cavanagh and Allen, 2008; Cavanagh et al., 2009; Clayson and Larson, 2011; Cohen and Cavanagh, 2011; Cohen and van Gaal, 2014; Danielmeier et al., 2009; Gulbinaite et al., 2014; Herrmann et al., 2004; Hochman et al., 2014; Larson et al., 2012; Nigbur et al., 2011, 2012; Padrao et al., 2015; Pastotter et al., 2013; Tillman and Wiens, 2011). Several of these EEG studies have focused on frontal midline theta oscillations observed during flanker task performance (Cavanagh et al., 2009; Cavanagh & Frank, 2014; Cohen and Cavanagh, 2011; Cohen and van Gaal, 2014; Gulbinaite et al., 2014; Nigbur et al., 2011, 2012; Padrao et al., 2015; Pastotter et al., 2013), and these studies have generally found that increased conflict leads to greater frontal midline theta activity. Such findings have been obtained using both the classic flanker paradigm and variants of the flanker task that were designed specifically to increase conflict monitoring (for a review, see Cavanagh and Frank, 2014; Cohen, 2014). However, these previous EEG studies have not generally imaged their electrophysiological responses, and thus the contribution of the anterior cingulate and/or other generator(s) is not entirely clear. One notable exception was an electrocorticography (ECoG) study that also used direct cortical stimulation during the flanker task (Usami et al., 2013). Their key findings indicated that the pre-SMA held an important role in conflict processing, although other regions were likely involved. Of note, Usami and colleagues were not able to evaluate lateral frontal or parietal areas due to the absence of ECoG electrodes in these areas.
As noted above, the network level dynamics serving selective attention and successful performance during the flanker task remain largely unknown. The temporal resolution of fMRI does not allow parsing out the inherent dynamics of short tasks like the flanker, and regardless such studies have tended to focus on the anterior cingulate and conflict monitoring processes, and not the visual attention component more generally. In the current study, we utilize the high spatiotemporal precision of magnetoencephalography (MEG) to quantify the oscillatory dynamics that underlie selective visual attention function in the context of the classic flanker task. While one MEG study to date has used a flanker paradigm to probe the neurophysiological correlates of movement selection (Grent-’t-Jong et al., 2013), no previous MEG study has utilized this task to probe the neural dynamics serving visual selective attention. Our primary hypotheses were that participants would exhibit significant neural oscillations in brain regions previously associated with flanker task performance in fMRI studies, and that the parietal and occipital cortices involved in selective attention processing would exhibit stronger oscillations during the more difficult incongruent trials. In addition, we hypothesized that both congruent and incongruent conditions would elicit significant theta oscillations in a network of prefrontal areas.
2. Methods
2.1. Subject selection
Twenty-five healthy adults (15 males; mean age: 32.60 years, range: 22–45 years) were recruited from the local community. Exclusionary criteria included any medical diagnosis affecting CNS function (e.g., psychiatric and/or neurological disease), known brain neoplasm or lesion, history of significant head trauma, current substance dependence, and ferromagnetic implants. Written informed consent was obtained from each participant following the guidelines of the University of Nebraska Medical Center’s Institutional Review Board, who approved the study protocol. This study was carried out in accordance with the latest version of the Declaration of Helsinki.
2.2. Experimental paradigm and stimuli
Participants performed an arrow-based version of the Eriksen flanker task while seated in a nonmagnetic chair within the magnetically-shielded room. Each trial began with a fixation that was presented for an interval of 1450–1550 milliseconds (ms). A row of 5 arrows was then presented for 2500 ms and participants were instructed to indicate with their right hand whether the middle arrow was pointing to the left (index finger) or right (middle finger). The 200 total trials were pseudo-randomized and equally split between congruent and incongruent conditions (Figure 1), with left and right pointing arrows being equally represented in the congruent and incongruent conditions. Overall MEG recording time was about 14 minutes for the task.
Figure 1.

Flanker task paradigm. Each trial consisted of a fixation period for an interval of 1450–1550 ms followed by the presentation of a row of 5 arrows for 2500 ms. Participants were instructed to indicate with their right hand whether the middle arrow was pointing to the left (index finger) or right (middle finger). Trials were either “congruent” with flanker arrows matching the target, or “incongruent” with the flanker and target arrows pointing in opposite directions.
Before analyzing accuracy and reaction time data, we performed standard data-trimming procedures. First, we excluded incorrect and no response trials. Next, we calculated each participant’s mean and SD of reaction times across congruent and incongruent conditions separately. We trimmed trials that were 2.5 SD or more away from the participant’s response mean. This trimming procedure eliminated a mean percentage of 2.95% congruent trials and 2.75% incongruent trials, and this difference was not significant, t(20) = 0.847; p = 0.408. After this trimming procedure, we used the remaining trials to calculate the mean accuracy and reaction times for each condition separately. We used paired-sample t-tests to compare the means between conditions, and we also computed the effect size for both accuracy and reaction time using Cohen’s d for within-group effects (Morris & DeShon, 2008; Cohen, 1988).
2.3. MEG data acquisition & coregistration with structural MRI
All recordings were conducted in a one-layer magnetically-shielded room with active shielding engaged. Neuromagnetic responses were sampled continuously at 1 kHz with an acquisition bandwidth of 0.1–330 Hz using an Elekta MEG system with 306 magnetic sensors (Elekta, Helsinki, Finland). Using MaxFilter (v2.2; Elekta), MEG data from each participant were individually corrected for head motion and subjected to noise reduction using the signal space separation method with a temporal extension (Taulu et al., 2005; Taulu and Simola, 2006).
Prior to MEG measurement, four coils were attached to the subject’s head and localized, together with the three fiducial points and scalp surface, with a 3-D digitizer (Fastrak 3SF0002, Polhemus Navigator Sciences, Colchester, VT, USA). Once the subject was positioned for MEG recording, an electric current with a unique frequency label (e.g., 322 Hz) was fed to each of the coils. This induced a measurable magnetic field and allowed each coil to be localized in reference to the sensors throughout the recording session. Since coil locations were also known in head coordinates, all MEG measurements could be transformed into a common coordinate system. With this coordinate system, each participant’s MEG data were coregistered with structural T1-weighted MRI data prior to source space analyses using BESA MRI (Version 2.0). Structural MRI data were aligned parallel to the anterior and posterior commissures and transformed into standardized space, along with the functional images, after beamforming (see below). All images were then spatially resampled.
2.4. MEG preprocessing, time-frequency transformation, & sensor-level statistics
Cardiac artifacts were removed from the data using signal-space projection (SSP), which was accounted for during source reconstruction (Uusitalo and Ilmoniemi, 1997). The continuous magnetic time series was divided into epochs of 2000 ms duration (−500 to 1500 ms), with 0.0 s defined as stimulus onset (i.e., arrows) and the baseline defined as the −450 to −50 ms time window. Epochs containing artifacts were rejected based on a fixed threshold method, supplemented with visual inspection. After artifact rejection, an average of 82.71 (SD: 4.79) epochs in the congruent and 83.19 (SD: 4.97) epochs in the incongruent condition remained in each participant; this difference was not significant, t(20) = 0.427, p = 0.674. Four male participants were excluded from all statistical analyses due to excessive artifacts in their MEG data, which reduced the final sample to 21 participants.
Artifact-free epochs were transformed into the time-frequency domain using complex demodulation (resolution: 1.0 Hz, 50 ms), and the resulting spectral power estimations per sensor were averaged over trials to generate time-frequency plots of mean spectral density. These sensor-level data were normalized by dividing the power value of each time-frequency bin by the respective bin’s baseline power, which was calculated as the mean power during the −450 to −50 ms time period. The specific time-frequency windows used for imaging were determined by statistical analysis of the sensor-level spectrograms averaged across congruent and incongruent trials for each gradiometer in the array. Each data point per spectrogram was initially evaluated using a mass univariate approach based on the general linear model. To reduce the risk of false positive results while maintaining reasonable sensitivity, a two stage procedure was followed to control for Type 1 error. In the first stage, one-sample t-tests were conducted on each data point and the output spectrograms of t-values were thresholded at p < 0.05 to define time-frequency bins containing potentially significant oscillatory deviations across all participants and conditions. In stage two, time-frequency bins that survived the threshold were clustered with temporally and/or spectrally neighboring bins that were also above the (p < 0.05) threshold, and a cluster value was derived by summing all of the t-values of all data points in the cluster. Nonparametric permutation testing was then used to derive a distribution of cluster-values and the significance level of the observed clusters (from stage one) were tested directly using this distribution (Ernst, 2004; Maris and Oostenveld, 2007). For each comparison, at least 10,000 permutations were computed to build a distribution of cluster values. Based on these analyses, the time-frequency windows containing significant oscillatory events across all participants and conditions were selected for imaging. Note that a similar approach has been used in several recent papers (Heinrichs-Graham and Wilson, 2015, 2016; Wiesman et al., 2016, 2017).
2.5. MEG source imaging, voxel time series extraction, & source-space statistics
Cortical networks were imaged through an extension of the linearly constrained minimum variance vector beamformer (Van Veen et al., 1997; Gross et al., 2001), which employs spatial filters in the frequency domain to calculate source power for the entire brain volume. The single images are derived from the cross spectral densities of all combinations of MEG gradiometers averaged over the time-frequency range of interest, and the solution of the forward problem for each location on a grid specified by input voxel space. Following convention, the source power in these images was normalized per participant using a separately averaged pre-stimulus noise period of equal duration and bandwidth (Hillebrand et al., 2005). MEG pre-processing and imaging used the Brain Electrical Source Analysis (BESA version 6.1) software.
Normalized source power was computed for the selected time-frequency bands over the entire brain volume per participant at 4.0 x 4.0 x 4.0 mm resolution. We then conducted a one-sample t-test across both conditions to identify neural areas generating the significant oscillatory brain responses observed in sensor space. To further interrogate the time course of neuronal activity in these brain regions, voxel time series (“virtual sensors”) data corresponding to the peak voxel of each cluster were extracted. Specifically, we selected the voxel with the highest t-value per significant cluster in the one-sample t-test across both conditions for virtual sensor extraction. To create the virtual sensors, we applied the sensor weighting matrix derived through the forward computation to the preprocessed signal vector, which yielded a time series for the specific coordinate in source space. Note that the peak voxel was found at the group level and the data corresponding to this voxel was then extracted from each participant’s image individually, once the coordinates of interest (i.e., one per cluster) were known. Virtual sensors were extracted for each condition separately so that the time series could be statistically tested for conditional effects (i.e., congruent relative to incongruent) using paired-samples t-tests. To control for Type 1 error, these time series were subjected to the same permutation testing approach that was used in the sensor-level analysis.
Finally, we performed an exploratory whole-brain analysis of the flanker effect (i.e., congruent vs. incongruent) using paired-sample t-tests for each of the time-frequency bins of interest. As with the sensor-level and virtual sensor analyses, a two-stage approach was used to control for Type 1 error. In the first stage, t-tests were conducted on each voxel and the output was thresholded at (p < 0.05) to create SPMs. A cluster value was derived in stage two, for each cluster surviving stage one, by summing all of the t-values of all data points (voxels) within the cluster. Subsequently, permutation testing was used to derive a distribution of cluster-values, and the observed clusters were tested for significance using this distribution (Ernst, 2004; Maris and Oostenveld, 2007). The goal of these analyses were to identify brain regions where conditional power differences were small, but sustained across the 250–650 ms time window.
3. Results
3.1. Behavioral results
Data from twenty-one adult participants (11 males; mean age: 32.10 years, range: 22–45 years) were included in this study. Participants performed well, with a mean accuracy of 98.76% (SD: 4.33%) in the congruent condition and 98.90% (SD: 2.70%) in the incongruent condition (Figure 2). Mean reaction times for the congruent and incongruent conditions were 582.02 ms (SD: 126.60 ms) and 631.21 ms (SD: 125.03 ms), respectively (Figure 2). While differences in accuracy were not significant, t(20) = 0.315, p = 0.756, differences in reaction time between conditions were statistically significant, t(20) = 9.48, p < 0.001 (Figure 2). The effect size for the accuracy difference (d = 0.106) was considerably small, but the effect size for the reaction time difference was quite large (d = 2.072) using the criteria and scale suggested by Cohen (1988).
Figure 2.

Flanker task behavioral results. There were no differences between conditions for accuracy (p > 0.75), but reaction times were significantly different with incongruent trials taking longer than congruent trials (p < .001). Error bars denote the standard error of the mean (SEM). * = p < 0.001
3.2. MEG sensor-level results
Sensor-level spectrograms were statistically examined using nonparametric permutation testing to derive the precise time-frequency bins for follow up beamforming analyses. These analyses indicated significant inclusive clusters of sustained decreases (i.e., desynchronization) in alpha (9–12 Hz) activity that began 250 ms after stimulus onset and continued until 650 ms (p < 0.05, corrected; Figure 3). There was also an inclusive cluster of increased theta (3–7 Hz) activity that began at 250 ms after stimulus onset, was sustained through 650 ms, and then slowly dissipated at approximately 800 ms (p < 0.05, corrected; Figure 3). To evaluate the dynamics and determine the precise brain regions generating these oscillatory responses, we analyzed significant time bins of 400 ms duration for both alpha and theta activity (i.e., 250–650 ms). Note that the inclusive ranges did not include transiently significant time-frequency bins adjacent to a range, and that we did not image any time bins after 650 ms because the participants had already responded and the focus of the study was on visual selective attention processes during flanker performance. Each time window was imaged using a baseline period of equal bandwidth and duration (−450 to −50 ms), and then statistically evaluated for task effects and conditional effects.
Figure 3.

(A) Group-averaged time-frequency spectrogram during flanker task performance. Time (in ms) is denoted on the x-axis, with 0 ms defined as the onset of the flanker stimuli. Frequency (in Hz) is shown on the y-axis. All signal power data is expressed as the percent difference from baseline (−450 to −50 ms), with the color legend shown at the top. Data represent a group-averaged gradiometer sensor that was near the fronto-parietal region in each participant (the same sensor was selected in each participant). During task performance, alpha activity in this brain area strongly decreased (i.e., desynchronization) and theta activity strongly increased (i.e., synchronization). Time periods with significant oscillatory activity (relative to baseline) were subjected to beamforming. The time-frequency windows subjected to beamforming are enclosed within the dashed boxes. (B) Gradiometer sensors exhibiting significant alpha responses (9–12 Hz) in the enclosed range shown in (A) are highlighted in blue in a 2D map of the sensor array. (C) Same as (B) except that the sensors highlighted in red had significant theta responses (3–7 Hz) through the enclosed time window.
3.3. MEG beamforming & virtual sensor results
3.3.1. Alpha Activity
Analysis of task effects across both congruent and incongruent trials showed significant bilateral alpha decreases in the parietal lobes, medial and lateral occipital cortices, and the cerebellum during the 250–650 ms time window (p < .0001, uncorrected; Figure 4). To more precisely examine the dynamics of these alpha decreases, we extracted virtual sensors per condition from the peak voxel in each region. The dynamic time series of neuronal activity in each region is shown in Figure 4, with significant flanker effects emerging in the left parietal cortices from 100–400 ms, left medial occipital from 250–400 ms, and the right cerebellum from 700–850 ms (p < .05, corrected). In all regions, significant alpha effects reflected stronger decreases in the incongruent relative to the congruent condition (i.e., greater alpha desynchronization).
Figure 4.

Alpha task effects during the 250–650 ms time window. (Top) One-sample t-test of beamformer images of alpha activity across both conditions thresholded at p < 1 x 10⁻⁶, uncorrected (see color bar for significance). Note that these images are shown at a higher statistical threshold than was used in the formal analysis in order to improve visualization of the peaks within each cluster. There were significant bilateral alpha decreases in the parietal lobes, medial and lateral occipital cortices, and the cerebellum during the 250–650 ms time window. Peak voxels were identified in each of these clusters (i.e., voxel with the highest t-value), and these were used for virtual sensor extraction. (Bottom) Voxel time series for the peak voxels of the parietal lobes, medial and lateral occipital cortices, and the cerebellum. Time (in ms, flanker stimulus onset = 0 ms) is denoted on the x-axis, while relative power (% change from baseline) is shown on the y-axis. Highlighted boxes mark time periods with significant condition effects and include the left parietal cortices from 100–400 ms, left medial occipital from 250–400 ms, and the right cerebellum from 700–850 ms (p < .05, corrected). The shaded area around each line denotes the SEM.
3.3.2. Theta Activity
Analysis of task effects across both conditions showed increased power in the left dorsolateral and ventral prefrontal cortices, and the right anterior cingulate cortex during the 250–650 ms time window (p < .0001, uncorrected; Figure 5). As with the alpha findings, we extracted virtual sensors from the peak voxel in each region per condition to examine the dynamics of theta activity during flanker task performance. Significant effects of flanker condition were found in the left dorsolateral prefrontal cortex from 350–450 ms, the left ventral prefrontal cortex from 350–500 ms, and the right anterior cingulate cortex from 300–500 ms (p < .05, corrected; Figure 5).
Figure 5.

Theta task effects from the 250–650ms time window. (Top) One-sample t-test of group beamformer images of theta activity for both conditions thresholded at p < 0.0001, uncorrected (see color bar for significance). There were significant theta increases in the left dorsolateral prefrontal cortex, the ventral prefrontal cortex, and the right anterior cingulate during the 250–650 ms time window. As with alpha, peak voxels were identified in each cluster and used for virtual sensor extraction. (Middle) Voxel time series for the peak voxels of the left dorsolateral prefrontal, left ventral prefrontal, and the right anterior cingulate cortices. Time (in ms, flanker stimulus onset = 0 ms) is denoted on the x-axis, while relative power (% change from baseline) is shown on the y-axis. Highlighted boxes mark significant condition effects and included the left dorsolateral prefrontal cortex from 350–450 ms, the left ventral prefrontal cortex from 350–500 ms, and the right anterior cingulate from 300–500 ms (all p’s < .05, corrected). The shaded area around each line denotes the SEM. (Bottom) Pearson correlation analyses between reaction time and peak latency for the theta response in each brain region. Peak latency (ms) is shown on the y-axis, while reaction time (ms) is shown on the x-axis. In each brain region, there was a significant positive correlation between peak latency and reaction time in each condition (all p’s < 0.05). Correlation coefficients for each condition (blue: congruent, red: incongruent) per brain region are shown above and below the trend line.
Given the overall topography of the virtual sensor waveforms, we performed a follow-up analysis to decipher whether the theta power differences between conditions might be partially attributable to between-condition latency differences. To evaluate this, we extracted the peak latency per condition for each of the three brain regions, and conducted a 3 x 2 repeated-measures ANOVA with region (dorsolateral prefrontal cortex, ventral prefrontal cortex, and anterior cingulate) and condition (congruent, incongruent) as within subject factors. Our results indicated a significant main effect of condition (F(1, 20) = 11.50, p = 0.003), without a main effect of brain region, or an interaction effect. Follow-on two-tailed statistical testing revealed an earlier peak latency for congruent relative to incongruent trials in the left dorsolateral prefrontal cortices (t(20) = 4.07, p < 0.001), left ventral prefrontal cortices (t(20) = 2.79, p = 0.011), and a marginal effect in the right anterior cingulate (t(20) = 1.80, p = 0.087). Lastly, given the parallels between these peak latency results and the reaction time results, we computed Pearson correlations between reaction time and the peak latency per condition in these same three brain regions. The results indicted very strong and significant correlations across both conditions in the left dorsolateral prefrontal cortex, the left ventral prefrontal cortex, and the anterior cingulate (all p’s < 0.05; see Figure 5).
3.3.3. Whole-Brain Flanker Analysis
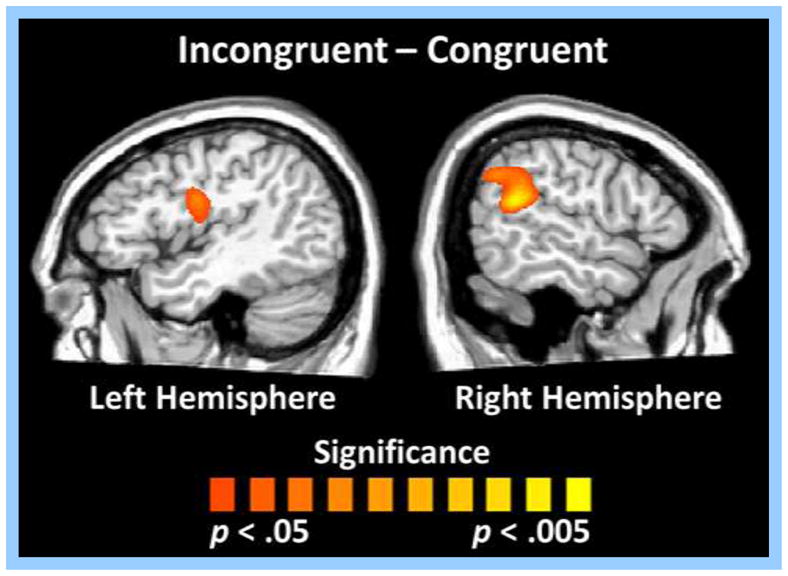
Finally, paired samples t-tests were used to statistically evaluate conditional effects across the whole-brain during the 250–650 ms time window for both alpha and theta frequencies. During incongruent trials, participants exhibited stronger alpha decreases (i.e., greater desynchronizations) relative to congruent trials in a brain region slightly inferior and posterior to the right TPJ (MNI coordinates: 46, −61, 6) during the 250–650 ms time window (p < .05, corrected; Figure 6). In contrast, participants had stronger alpha decreases in the left FEF (MNI coordinates: −34, 5, 62) during congruent trials in the 250–650 ms time period (p < .05, corrected; Figure 6). Lastly, participants exhibited stronger theta increases during incongruent relative to congruent trials in the left premotor cortices (MNI coordinates: −44, −8, 26) and near the right TPJ (MNI coordinates: 59, −49, 15) during the 250–650 ms time window (p < .05, corrected; Figure 7).
Figure 6.

Whole-brain analysis of condition effects for alpha activity during the 250–650 ms time window. Permutation-corrected, paired samples t-tests showed significant condition effects in the right temporoparietal junction (TPJ) and in the left frontal eye fields (FEF). Participants exhibited stronger alpha decreases (i.e., greater desynchronizations) during incongruent relative to congruent trials in the right TPJ (p < .05, corrected), whereas the opposite pattern was detected in the left FEF (i.e., stronger alpha decreases during congruent trials, p < .05, corrected).
Figure 7.
Whole-brain analysis of condition effects for theta activity during the 250–650 ms time window. Permutation-corrected, paired samples t-tests showed significant condition effects in the left premotor cortices and in the right temporoparietal junction (TPJ). Participants exhibited stronger theta increases (i.e., greater synchronizations) during incongruent relative to congruent trials near the left premotor cortices and the right TPJ (p < .05, corrected).
4. Discussion
In the present study, we investigated the spatiotemporal oscillatory dynamics serving visual selective attention performance during the classic Eriksen flanker task in healthy adults. Significant oscillatory responses in both alpha (9–12 Hz) and theta (3–7 Hz) frequency bands were detected, and source reconstruction indicated that a number of visual attention regions generated these oscillations. In the alpha frequency, these regions included bilateral parietal lobes, medial and lateral occipital cortices, and the cerebellum. In the theta frequency range, these regions included the left dorsolateral and ventral prefrontal cortices, and the anterior cingulate cortex. Of note, the finding that these fronto-parietal regions show significant oscillatory events matches our hypothesis that cortical regions strongly implicated in attention networks would be involved in the performance of a flanker task. In regards to condition effects, we found that alpha oscillatory dynamics in the left parietal lobe, left medial occipital lobe, and right cerebellum were modulated by the presence of distractor arrows during a flanker task. In contrast, theta conditional effects emerged in the dorsolateral prefrontal cortices, ventral prefrontal, and anterior cingulate, and always reflected stronger responses during congruent relative to incongruent trials, although this effect could have reflected a latency difference. Further, the time series of activity in these regions was strongly connected to reaction time performance in the flanker task. Whole-brain analyses of alpha activity showed condition effects in the left FEF (stronger for congruent) and near the right TPJ (stronger for incongruent). Interestingly, these regions were modulated in different directions, perhaps indicating that these regions have different roles in the visual selective attention process. Whole-brain analyses of theta activity showed condition effects (stronger for incongruent) in the left premotor cortices and near the right TPJ. Below, we discuss the implications of these findings for understanding visual attention function and the interplay between the DAN and VAN during performance of the Eriksen flanker task.
As alluded to above, the differing patterns of recruitment among prefrontal regions and more posterior areas (i.e., temporal, parietal, and occipital cortices) may be reflective of differentiated roles in attention networks. For example, stronger decreases in alpha and increases in theta activity were observed near the right TPJ during incongruent trials. This region is considered a hub in the VAN, particularly in the right hemisphere, and it is anatomically located at the intersection of the inferior parietal lobe, the lateral occipital cortex, and the posterior end of the superior temporal sulcus (Corbetta et al., 2008). Since the VAN is believed to facilitate stimulus detection, particularly when unexpected or distracting stimuli are present, it is intuitive that a core region of this network would show stronger responses during incongruent trials, as distractor arrows are present. Whether this greater response is merely a byproduct of increased neuronal processing, or is a functional mechanism for filtering incoming visual information in real time is not directly discernible from these findings. Interestingly, stronger alpha decreases during incongruent trials was also found in the left parietal and left occipital, both of which have been associated with the DAN. This may indicate that both the VAN and DAN make strong contributions in the face of distractor information, and future studies will need to further determine the specificity of this dual role for processing in the face of distraction.
Regions that showed stronger oscillatory responses during congruent trials included the left FEF (i.e., alpha desynchronization), the left dorsolateral prefrontal cortex (i.e., theta increases or synchronization), the left ventral prefrontal cortex (theta increase), and the right anterior cingulate (theta increase). The left FEF is considered part of the DAN, a network that serves the selection of sensory stimuli and helps link them to appropriate motor responses (Corbetta et al., 2008). Stronger responses in the FEF during congruent trials may indicate that in the absence of distractors, this region suffices for sensory selection, whereas in the incongruent condition, other regions come online and assume a larger percentage of the overall burden. Our findings that the dorsolateral prefrontal, the ventral prefrontal, and the anterior cingulate cortices showed increased theta oscillatory responses during congruent trials was somewhat surprising given the previous literature (Cavanagh et al., 2009; Cavanagh & Frank, 2014; Cohen and Cavanagh, 2011; Cohen and van Gaal, 2014; Gulbinaite et al., 2014; Nigbur et al., 2011, 2012; Padrao et al., 2015; Pastotter et al., 2013). However, we also showed that the peak latency differed between conditions and that peak latency was highly correlated with reaction time. Similar to the finding in the FEF, these findings may indicate that in the absence of distractors, the integration of sensory stimuli and subsequent response selection takes place more efficiently. As a final note, it may be possible that our divergence from the typical theta amplitude effect reported in most EEG studies (i.e., incongruent > congruent) was due to our task design, which deemphasized conflict monitoring and used a longer stimulus presentation time. Differences in EEG and MEG sensitivity to cortical responses could have also contributed to this finding.
While this is the first MEG study that has utilized the classic flanker task to probe visual selective attention in healthy adults, there have been several MEG studies that have focused on visual attention and oscillatory activity (Doesburg et al., 2016; Siegel et al., 2008). Doesburg and colleagues (2016) studied distributed network interactions during visuospatial attention orienting, and found through causal modeling that a number of brain regions were influencing visual areas during attention control, including the anterior cingulate cortex, prefrontal cortex, insular cortex, and inferior parietal cortex. Siegel and colleagues (2008) studied oscillatory activity using a spatially-cued motion discrimination task and found that visuospatial attention modulated oscillatory activity in visual, parietal, and prefrontal cortices. These previous MEG studies and the present study provide clear evidence that oscillatory activity plays an important role in visual selective attention, and future studies using similar methods will continue to improve our understanding of the cortical dynamics underlying visual selective attention.
Before closing, it is important to note some limitations of this study. For example, the study focused exclusively on selective visual attention, our flanker task was relatively easy, we did not directly quantify differences in fixation duration, and we concentrated on the attentional components of the task rather than the motor control aspects. Future studies could focus on auditory selective attention, could use attention tasks that are more cognitively demanding, and could focus on the effects of the flanker task on oscillatory activity related to response selection (e.g., movement-related beta desynchronization). Future studies could also modulate attention networks using transcranial magnetic stimulation (TMS) or direct-current stimulation (tDCS) during performance of a flanker or a similar task that includes distractors. Finally, since this study focused solely on healthy young participants, future work could expand our findings by examining the cortical dynamics of flanker task performance in other populations, including healthy aging and psychiatric/neurological populations.
Acknowledgments
Grant Support: This research was supported by grant R01-MH103220 from the National Institutes of Health (TWW), grant #1539067 from the National Science Foundation (TWW), and by a Research Support Fund grant from the Nebraska Health System and the University of Nebraska Medical Center. The Center for Magnetoencephalography at the University of Nebraska Medical Center was founded through an endowment from an anonymous donor. The funders had no role in study design, data collection and analysis, decision to publish, or preparation of the manuscript.
Footnotes
Publisher's Disclaimer: This is a PDF file of an unedited manuscript that has been accepted for publication. As a service to our customers we are providing this early version of the manuscript. The manuscript will undergo copyediting, typesetting, and review of the resulting proof before it is published in its final citable form. Please note that during the production process errors may be discovered which could affect the content, and all legal disclaimers that apply to the journal pertain.
References
- Botvinick MM, Nystrom LE, Fissell K, Carter CS, Cohen JD. Conflict monitoring versus selection-for-action in anterior cingulate cortex. Nature. 1999;402:179–81. doi: 10.1038/46035. [DOI] [PubMed] [Google Scholar]
- Botvinick MM, Braver TS, Barch DM, Carter CS, Cohen JD. Conflict monitoring and cognitive control. Psychol Rev. 2001;108:624–52. doi: 10.1037/0033-295x.108.3.624. [DOI] [PubMed] [Google Scholar]
- Botvinick MM, Cohen JD, Carter CS. Conflict monitoring and anterior cingulate cortex: an update. Trends Cogn Sci. 2004;8:539–46. doi: 10.1016/j.tics.2004.10.003. [DOI] [PubMed] [Google Scholar]
- Broadbent DE. Perception and Communication. London: Pergamon Press; 1958. p. 338. [Google Scholar]
- Bunge SA, Hazeltine E, Scanlon MD, Rosen AC, Gabrieli JD. Dissociable contributions of prefrontal and parietal cortices to response selection. Neuroimage. 2002;17:1562–71. doi: 10.1006/nimg.2002.1252. [DOI] [PubMed] [Google Scholar]
- Carrasco M. Visual attention: the past 25 years. Vision Res. 2011;51:1484–525. doi: 10.1016/j.visres.2011.04.012. [DOI] [PMC free article] [PubMed] [Google Scholar]
- Cavanagh JF, Allen JJ. Multiple aspects of the stress response under social evaluative threat: An electrophysiological investigation. Psychoneuroendocrinology. 2008;33:41–53. doi: 10.1016/j.psyneuen.2007.09.007. [DOI] [PubMed] [Google Scholar]
- Cavanagh JF, Cohen MX, Allen JJ. Prelude to and resolution of an error: EEG phase synchrony reveals cognitive control dynamics during action monitoring. J Neurosci. 2009;29(1):98–105. doi: 10.1523/JNEUROSCI.4137-08.2009. [DOI] [PMC free article] [PubMed] [Google Scholar]
- Cavanagh JF, Frank MJ. Frontal theta as a mechanism for cognitive control. Trends Cogn Sci. 2014;18(8):414–21. doi: 10.1016/j.tics.2014.04.012. [DOI] [PMC free article] [PubMed] [Google Scholar]
- Clark K, Squire RF, Merrikhi Y, Noudoost B. Visual attention: Linking prefrontal sources to neuronal and behavioral correlates. Prog Neurobiol. 2015;132:59–80. doi: 10.1016/j.pneurobio.2015.06.006. [DOI] [PubMed] [Google Scholar]
- Clayson PE, Larson MJ. Conflict adaptation and sequential trial effects: support for the conflict monitoring theory. Neuropsychologia. 2011;49:1953–61. doi: 10.1016/j.neuropsychologia.2011.03.023. [DOI] [PubMed] [Google Scholar]
- Cohen MX. A neural microcircuit for cognitive conflict detection and signaling. Trends Neurosci. 2014;37(9):480–490. doi: 10.1016/j.tins.2014.06.004. [DOI] [PubMed] [Google Scholar]
- Cohen MX, Cavanagh JF. Single-trial regression elucidates the role of prefrontal theta oscillations in response conflict. Front Psychol. 2011;2:30. doi: 10.3389/fpsyg.2011.00030. [DOI] [PMC free article] [PubMed] [Google Scholar]
- Cohen MX, van Gaal S. Subthreshold muscle twitches dissociate oscillatory neural signatures of conflicts from errors. Neuroimage. 2014;86:503–513. doi: 10.1016/j.neuroimage.2013.10.033. [DOI] [PubMed] [Google Scholar]
- Corbetta M, Patel G, Shulman GL. The reorienting system of the human brain: from environment to theory of mind. Neuron. 2008;58:306–24. doi: 10.1016/j.neuron.2008.04.017. [DOI] [PMC free article] [PubMed] [Google Scholar]
- Corbetta M, Shulman GL. Control of goal-directed and stimulus-driven attention in the brain. Nat Rev Neurosci. 2002;3:201–15. doi: 10.1038/nrn755. [DOI] [PubMed] [Google Scholar]
- Danielmeier C, Wessel JR, Steinhauser M, Ullsperger M. Modulation of the error-related negativity by response conflict. Psychophysiology. 2009;46:1288–98. doi: 10.1111/j.1469-8986.2009.00860.x. [DOI] [PubMed] [Google Scholar]
- Deutsch JA, Deutsch D. Attention: Some theoretical considerations. Psychol Rev. 1963;70:80–90. doi: 10.1037/h0039515. [DOI] [PubMed] [Google Scholar]
- Doesburg SM, Bedo N, Ward LM. Top-down alpha oscillatory network interactions during visuospatial attention orienting. Neuroimage. 2016;132:512–519. doi: 10.1016/j.neuroimage.2016.02.076. [DOI] [PubMed] [Google Scholar]
- Driver J. A selective review of selective attention research from the past century. British J Psychol. 2001;32:53–78. [PubMed] [Google Scholar]
- Duncan J, Humphreys G. Beyond the search surface: visual search and attentional engagement. J Exp Psychol Hum Percept Perform. 1992;18:578–88. doi: 10.1037//0096-1523.18.2.578. discussion 589–93. [DOI] [PubMed] [Google Scholar]
- Eriksen B, Eriksen C. Effects of noise letters upon identification of a target letter in a non-search task. Percept Psychophys. 1974;16:143–149. [Google Scholar]
- Eriksen CW, St James JD. Visual attention within and around the field of focal attention: a zoom lens model. Percept Psychophys. 1986;40:225–40. doi: 10.3758/bf03211502. [DOI] [PubMed] [Google Scholar]
- Ernst MD. Permutation methods: a basis for exact inference. Stat Sci. 2004;19:676–685. [Google Scholar]
- Fassbender C, Foxe JJ, Garavan H. Mapping the functional anatomy of task preparation: priming task-appropriate brain networks. Hum Brain Mapp. 2006;27:819–27. doi: 10.1002/hbm.20223. [DOI] [PMC free article] [PubMed] [Google Scholar]
- Grent-’t-Jong T, Oostenveld R, Jensen O, Medendorp WP, Praamstra P. Oscillatory dynamics of response competition in human sensorimotor cortex. Neuroimage. 2013;83:27–34. doi: 10.1016/j.neuroimage.2013.06.051. [DOI] [PubMed] [Google Scholar]
- Gross J, Kujala J, Hamalainen M, Timmermann L, Schnitzler A, Salmelin R. Dynamic imaging of coherent sources: Studying neural interactions in the human brain. Proc Natl Acad Sci U S A. 2001;98:694–9. doi: 10.1073/pnas.98.2.694. [DOI] [PMC free article] [PubMed] [Google Scholar]
- Gulbinaite R, Johnson A, de Jong R, Morey CC, van Rijn H. Dissociable mechanisms underlying individual differences in visual working memory capacity. Neuroimage. 2014;99:197–206. doi: 10.1016/j.neuroimage.2014.05.060. [DOI] [PubMed] [Google Scholar]
- Hazeltine E, Poldrack R, Gabrieli JD. Neural activation during response competition. J Cogn Neurosci. 2000;12(Suppl 2):118–29. doi: 10.1162/089892900563984. [DOI] [PubMed] [Google Scholar]
- Heinrichs-Graham E, Wilson TW. Coding complexity in the human motor circuit. Hum Brain Mapp. 2015;36:5155–67. doi: 10.1002/hbm.23000. [DOI] [PMC free article] [PubMed] [Google Scholar]
- Heinrichs-Graham E, Wilson TW. Is an absolute level of cortical beta suppression required for proper movement? Magnetoencephalographic evidence from healthy aging. Neuroimage. 2016;134:514–21. doi: 10.1016/j.neuroimage.2016.04.032. [DOI] [PMC free article] [PubMed] [Google Scholar]
- Herrmann MJ, Rommler J, Ehlis AC, Heidrich A, Fallgatter AJ. Source localization (LORETA) of the error-related-negativity (ERN/Ne) and positivity (Pe) Brain Res Cogn Brain Res. 2004;20:294–9. doi: 10.1016/j.cogbrainres.2004.02.013. [DOI] [PubMed] [Google Scholar]
- Hillebrand A, Singh KD, Holliday IE, Furlong PL, Barnes GR. A new approach to neuroimaging with magnetoencephalography. Hum Brain Mapp. 2005;25:199–211. doi: 10.1002/hbm.20102. [DOI] [PMC free article] [PubMed] [Google Scholar]
- Hochman EY, Vaidya AR, Fellows LK. Evidence for a role for the dorsal anterior cingulate cortex in disengaging from an incorrect action. PloS One. 2014;9:e101126. doi: 10.1371/journal.pone.0101126. [DOI] [PMC free article] [PubMed] [Google Scholar]
- Larson MJ, Clayson PE, Baldwin SA. Performance monitoring following conflict: internal adjustments in cognitive control? Neuropsychologia. 2012;50:426–33. doi: 10.1016/j.neuropsychologia.2011.12.021. [DOI] [PubMed] [Google Scholar]
- Lau H, Rogers RD, Passingham RE. Dissociating response selection and conflict in the medial frontal surface. Neuroimage. 2006;29:446–51. doi: 10.1016/j.neuroimage.2005.07.050. [DOI] [PubMed] [Google Scholar]
- Maris E, Oostenveld R. Nonparametric statistical testing of EEG- and MEG-data. J Neurosci Methods. 2007;164:177–90. doi: 10.1016/j.jneumeth.2007.03.024. [DOI] [PubMed] [Google Scholar]
- Nigbur R, Ivanova G, Sturmer B. Theta power as a marker for cognitive interference. Clin Neurophysiol. 2011;122:2185–2194. doi: 10.1016/j.clinph.2011.03.030. [DOI] [PubMed] [Google Scholar]
- Nigbur R, Cohen MX, Ridderinkhof KR, Sturmer B. Theta dynamics reveal domain-specific control over stimulus and response conflict. J Cogn Neurosci. 2012;24(5):1264–1274. doi: 10.1162/jocn_a_00128. [DOI] [PubMed] [Google Scholar]
- Norman DA. Toward a theory of memory and attention. Psychol Rev. 1968;75:522–536. [Google Scholar]
- Pastotter B, Dreisbach G, Bauml KH. Dynamic adjustments of cognitive control: Oscillatory correlates of the conflict adaptation effect. J Cogn Neurosci. 2013;25(12):2167–2178. doi: 10.1162/jocn_a_00474. [DOI] [PubMed] [Google Scholar]
- Padrao G, Rodriguez-Herrerros B, Perez Zapata L, Redriguez-Fornells A. Exogenous capture of medial-frontal oscillatory mechanisms by unattended conflicting information. Neuropsychologia. 2015;75:458–468. doi: 10.1016/j.neuropsychologia.2015.07.004. [DOI] [PubMed] [Google Scholar]
- Petersen SE, Posner MI. The attention system of the human brain: 20 years after. Annu Rev Neurosci. 2012;35:73–89. doi: 10.1146/annurev-neuro-062111-150525. [DOI] [PMC free article] [PubMed] [Google Scholar]
- Posner MI, Snyder CR, Davidson BJ. Attention and the detection of signals. J Exp Psychol Gen. 1980;109:160–74. [PubMed] [Google Scholar]
- Siegel M, Donner TH, Oostenveld R, Fries P, Engel AK. Neuronal synchronization along the dorsal visual pathway reflects the focus of spatial attention. Neuron. 2008;60:709–19. doi: 10.1016/j.neuron.2008.09.010. [DOI] [PubMed] [Google Scholar]
- Taulu S, Simola J. Spatiotemporal signal space separation method for rejecting nearby interference in MEG measurements. Phys Med Biol. 2006;51:1759–68. doi: 10.1088/0031-9155/51/7/008. [DOI] [PubMed] [Google Scholar]
- Taulu S, Simola J, Kajola M. Applications of the signal space separation method (SSS) IEEE Trans Signal Process. 2005;53:3359–3372. [Google Scholar]
- Tillman CM, Wiens S. Behavioral and ERP indices of response conflict in Stroop and flanker tasks. Psychophysiology. 2011;48:1405–11. doi: 10.1111/j.1469-8986.2011.01203.x. [DOI] [PubMed] [Google Scholar]
- Treisman AM. The effect of irrelevant material on the efficiency of selective listening. Am J Psychol. 1964;77:533–46. [PubMed] [Google Scholar]
- Treisman AM, Gelade G. A feature-integration theory of attention. Cogn Psychol. 1980;12:97–136. doi: 10.1016/0010-0285(80)90005-5. [DOI] [PubMed] [Google Scholar]
- Usami K, Matsumoto R, Kunieda T, Shimotake A, Matsuhashi M, Miyamoto S, Fukuyama H, Takahashi R, Ikeda A. Pre-SMA actively engages in conflict processing in human: a combined study of epicortical ERPs and direct cortical stimulation. Neuropsychologia. 2013;51:1011–7. doi: 10.1016/j.neuropsychologia.2013.02.002. [DOI] [PubMed] [Google Scholar]
- Uusitalo MA, Ilmoniemi RJ. Signal-space projection method for separating MEG or EEG into components. Med Biol Eng Comput. 1997;35:135–40. doi: 10.1007/BF02534144. [DOI] [PubMed] [Google Scholar]
- Van Veen BD, van Drongelen W, Yuchtman M, Suzuki A. Localization of brain electrical activity via linearly constrained minimum variance spatial filtering. IEEE Trans Biomed Eng. 1997;44:867–80. doi: 10.1109/10.623056. [DOI] [PubMed] [Google Scholar]
- van Veen V, Cohen JD, Botvinick MM, Stenger VA, Carter CS. Anterior cingulate cortex, conflict monitoring, and levels of processing. Neuroimage. 2001;14:1302–8. doi: 10.1006/nimg.2001.0923. [DOI] [PubMed] [Google Scholar]
- Vossel S, Geng JJ, Fink GR. Dorsal and ventral attention systems: distinct neural circuits but collaborative roles. Neuroscientist. 2014;20:150–9. doi: 10.1177/1073858413494269. [DOI] [PMC free article] [PubMed] [Google Scholar]
- Vossel S, Weidner R, Driver J, Friston KJ, Fink GR. Deconstructing the architecture of dorsal and ventral attention systems with dynamic causal modeling. J Neurosci. 2012;32:10637–48. doi: 10.1523/JNEUROSCI.0414-12.2012. [DOI] [PMC free article] [PubMed] [Google Scholar]
- Wiesman AI, Heinrichs-Graham E, Coolidge NM, Gehringer JE, Kurz MJ, Wilson TW. Oscillatory dynamics and functional connectivity during gating of primary somatosensory responses. J Physiol. 2017;595:1365–1375. doi: 10.1113/JP273192. [DOI] [PMC free article] [PubMed] [Google Scholar]
- Wiesman AI, Heinrichs-Graham E, McDermott TJ, Santamaria PM, Gendelman HE, Wilson TW. Quiet connections: Reduced fronto-temporal connectivity in nondemented Parkinson’s Disease during working memory encoding. Hum Brain Mapp. 2016;37:3224–35. doi: 10.1002/hbm.23237. [DOI] [PMC free article] [PubMed] [Google Scholar]