Multivariate analysis has become a major statistical tool for medical research. It is most commonly used for adjustment — the process of correcting the main effect for multiple variables that confound the relation between exposure and outcome in an observational study. Any apparent relation between estrogen replacement and dementia, for example, should be adjusted for socioeconomic status, a variable that is known to relate both to access (and thus the likelihood of having received estrogen) and to measures of cognitive function (and thus the likelihood of being diagnosed with dementia). The capacity to account for numerous variables (e.g., income, education and insurance status) simultaneously constitutes a major advance in the ability of researchers to estimate the true effect of the exposure of interest.
But this advance has come at a cost: the actual relation between exposure and outcome is increasingly opaque to readers, researchers and editors alike. We and others have pointed out that the most common summary statistics of multivariate analyses — ratio measures such as odds ratio and relative risk — obscure the most fundamental measure of occurrence: the frequency of the outcome.1,2,3,4,5 Less attention has been given to another common practice in multivariate analysis: assuming that a continuous relation between exposure and outcome adequately represents the underlying data. Deceptively simple decisions about the shape of the relation can have profound implications on how results are interpreted.
In this article, we explore this issue using 2 case studies of recent original investigations from 2 prominent medical journals. Both used population-based data of the highest quality and appropriately called on multivariate analysis to adjust for important confounders. In both cases, however, we demonstrate how assuming a continuous relation between exposure and outcome produced misleading results. We conclude with suggested guidelines for researchers who are trying to communicate the findings of multivariate analyses and for readers who are trying to make sense of them.
Mediterranean diet
Reported data (continuous relation assumed)
In the summer of 2003, a study relating a Mediterranean diet to reduced mortality was published.6 The investigation used data collected as part of the European Prospective Investigation into Cancer and Nutrition, a detailed study of diet and health coordinated by the International Agency for Research on Cancer that involved over a half million people in 10 European countries. The exposure was the degree of adherence to a Mediterranean diet, as measured by a discrete integer score that ranged from 0 to 9. The outcome was number of deaths per person-year of observation.
The investigators used a Cox proportional hazard model in their main analysis. A Cox model uses a series of variables to predict the risk over time of an event, in this case death. The purpose of using this method was to identify the independent effect of diet on mortality while controlling for the potentially confounding effects of factors such as age, weight and smoking. Each variable being used to predict mortality has an associated coefficient (generally symbolized with β), which communicates the independent effect of that variable on mortality after adjusting for other factors in the model. A simplified version of this model is:
mortality = function (β1 х Mediterranean diet score + β2 х age + β3 х weight +…+ βn х smoking)
The output that is of greatest interest is the coefficient on the Mediterranean diet score, which was expressed as a hazard ratio (the relative risk for death for an additional increment in the diet score). Because there is a single coefficient for the diet score, the assumed relation in this model is linear: each additional point on the score will result in a fixed percentage change in mortality (with the sign on the coefficient indicating increase or decrease).
The main result of this investigation, as reported in the abstract, was that “a higher degree of adherence to the Mediterranean diet was associated with a reduction in total mortality (adjusted hazard ratio for death associated with a two-point increment in the Mediterranean-diet score, 0.75).” In other words, for every additional 2 points (greater adherence to a Mediterranean diet) mortality will fall by 25%. The rational inference given such a finding is simple: the more one adheres to a Mediterranean diet, the lower the risk of death.
The categorical data approach
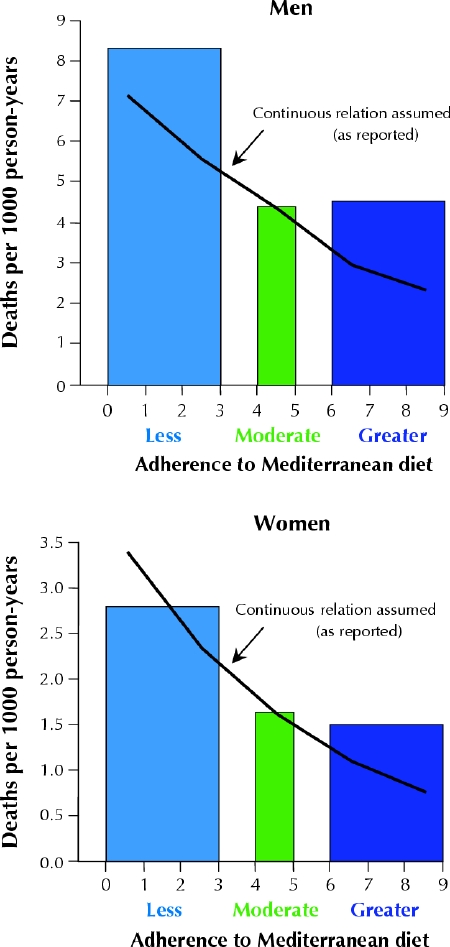
To better understand the relation between diet and mortality, we began by dividing the numbers in the first 2 rows of Table 1 in the original article to get the rate of death per 1000 person-years for men and women in each of the 3 adherence categories for Mediterranean diet: less adherence (diet score 0–3), moderate adherence (diet score 4–5) and greater adherence (diet score 6–9). This same approach was used by the editors of the journal in which the study was published to produce the synopsis figure that appeared in “This Week in the Journal,” the editors' summary of the featured articles in the issue.7 (The figure showed only the death rates for the extreme diet categories and left out the moderate adherence category).
We then generated a prediction line that assumed a continuous relation, as was done in the original article. The prediction line was calculated by plotting the observed rate of death in the largest category (moderate adherence) and then applying the hazard ratio of 0.75 for each 2-point increment in the Mediterranean diet score to generate additional data points above and below moderate adherence. We then superimposed the model's prediction line on the categorical data.
Comparing reported and categorical data
As Fig. 1 shows, the categorical data suggest a different result than when a continuous relation is assumed. Although the model predicts a constant decline in mortality (25% decrease for every 2 points), the categorical data shows a substantial decline between less adherence and moderate adherence, but not between moderate and greater adherence. In fact, for men, there is a slight increase in mortality between the moderate and high adherence categories. Although the categorical data are unadjusted, Table 4 in the original article shows that adjustment has a minimal effect. (And because people in the greatest adherence category tend to be younger, an age-adjusted rate of death for this group would be slightly higher than is shown.) So the inference given the categorical data is more tempered: although moderate adherence to a Mediterranean diet is associated with a reduction in the risk of death, high adherence may have no additional benefit.

Fig. 1: Reported findings assuming a continuous relation (solid lines) v. re-analysis using the categorical data approach (bars) in a study of Mediterranean diet and mortality.
Body weight
Reported data (continuous relation assumed)
At the beginning of 2003 a study investigating the years of life lost because of excess body weight was published.8 The investigation used data collected by the National Health and Nutrition Examination Survey (NHANES), the US government's major effort to comprehensively examine a representative sample of the American public. In addition to a detailed history and physical and laboratory examination at intake, long-term mortality data were also obtained. In this investigation, the exposure of interest was body mass index (BMI) and the outcome was number of deaths per person-year of observation (which was subsequently translated into years of life lost).
The investigators also used a Cox proportional hazard model, in this case to identify the independent effect of BMI on mortality while controlling for the potentially confounding effects of age and smoking. However, instead of using a single variable to represent exposure, the investigators (on the basis of previous work) chose to use 2: BMI and BMI squared. A simplified version of this model is:
mortality = function (β1 х BMI + β2 х BMI2 + β3 х age +…+ βn х smoking)
In this model, the output of interest is the combined effect of the coefficients on the BMI variables. Because there are 2 (and because one is a squared term), the assumed relation in this model is not a line, but a U-shaped parabola. This model assumes there must be 1 value of BMI with the lowest mortality and that mortality increases smoothly for BMIs above and below that value.
The main result of this investigation, as reported in the abstract, was that the “optimal BMI (associated with the least years of life lost or greatest longevity) is approximately 23 to 25 for whites” and that there was steady decrease in life expectancy for BMIs above that. No attention was given to the other half of the parabola — BMIs below the optimal value. The rational inference given these results is straightforward: having a BMI greater than 25 kg/m2 is associated with an increase in the risk of death.
The categorical data approach
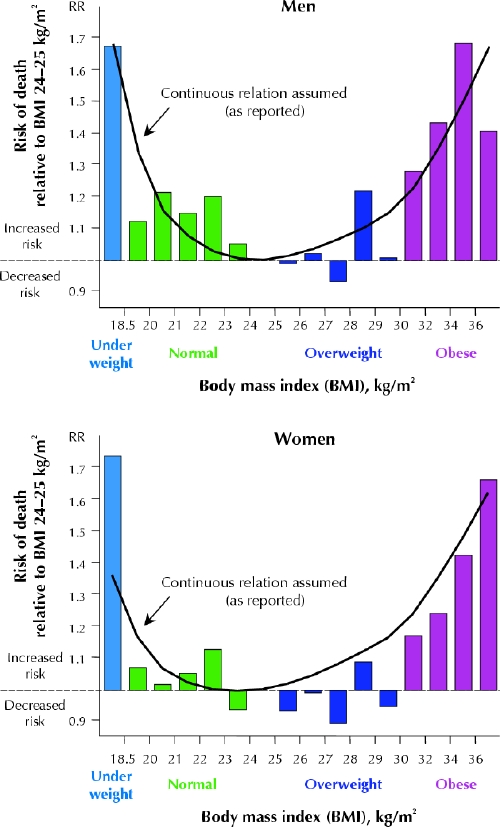
To better understand the relation between body weight and mortality, we sought to calculate the rates of death actually observed in discrete BMI categories. Because the original article did not include these data, we obtained the publicly available NHANES data used by the investigators (14 407 adults completing an examination in NHANES I from 1971 to 1975 and 9252 adults completing an examination in NHANES II from 1976 to 1980). We focused on white men and women, in whom, in the original article, increased BMI appeared to be most consistently related to increased mortality (among older blacks, obesity appeared to be protective). The data included 3124 deaths among white men and 2463 deaths among white women. As in the original article, mortality data are adjusted for age and smoking status using a Cox proportional hazard model. Unlike the original analysis, however, we did not assume a U-shaped parabola. Instead we specified BMI using 16 discrete categories, each of which had at least 45 deaths (and at least 100 deaths in all but the 2 most extreme obesity categories).
We then generated a prediction line assuming a continuous relation, as was done in the original article. The prediction line was drawn using the coefficients posted on the Web site supporting the article. To ensure that we were using identical data, we replicated the investigators' U-shaped Cox proportional hazard model in the NHANES data and obtained the same coefficients.
Comparing reported and categorical data
Fig. 2 superimposes the risk of death for discrete BMI categories on the continuous prediction from the model. Again, the actual result is more complex than is suggested when a continuous relation is assumed. Although the model predicts increasing mortality above a BMI of 25 kg/m2, the categorical data show that the harmful effect of body mass does not consistently appear before the obese categories (BMI > 30 kg/m2) — there is little effect on mortality for intervening BMI categories. In fact, the categorical data show that people with normal weight (BMI 18.5– 25 kg/m2) had a slightly higher mortality than those who were overweight (BMI 25–30 kg/m2), although none of these differences are statistically significant. Again the inference given the categorical data is more tempered: although extremes of weight in either direction are associated with a higher risk of death, being overweight may not be.

Fig. 2: Reported findings assuming a continuous relation (solid lines) v. re-analysis using the categorical approach in a study of body weight and risk of death. RR = relative risk. Note that the BMI categories are not equally spaced: for example, obesity data appear in 2-unit BMI categories to ensure sufficient sample size. Data are restricted to white people.
Implications
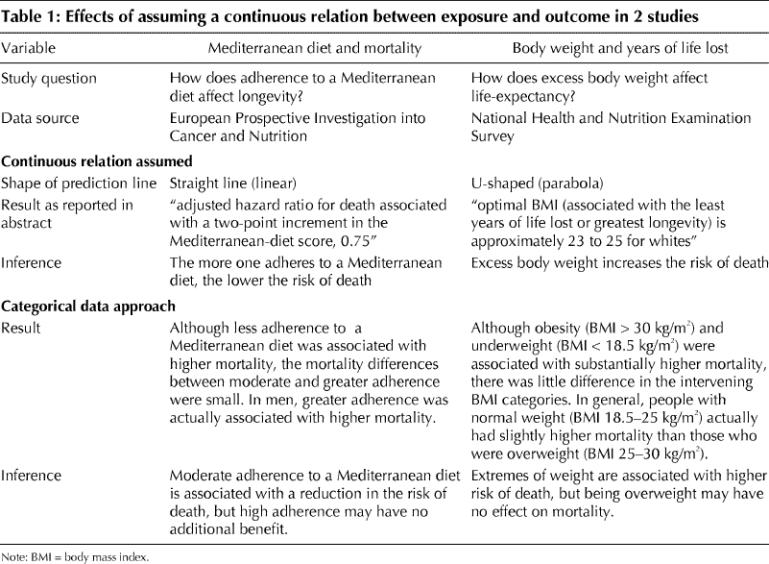
Table 1 summarizes the effect of assuming a continuous relation between exposure and outcome in these 2 case studies. In each case the assumption leads to a qualitatively different finding and one that may exaggerate the effect of the relation.
Table 1

Our critique should not be misconstrued as suggesting that multivariate analysis is inherently misleading. Instead we view the technique as a major advance that, by adjusting for confounding, can help uncover the true effect of an exposure. At the same time, the research community should acknowledge that the technique's inherent complexity means that it is widely seen as a black box that tends to distance readers, reviewers, editors and even researchers from the underlying data. Nor are we suggesting that modelling a continuous relation is always inappropriate. We do believe, however, that such modelling is likely overused, that it further adds to complexity of multivariate analysis and, thus, that it further distances people from data.
We believe the assumption of a continuous relation is less the result of a considered decision than a practice born out of convention and convenience. The convention is that biologic relations ought to be smooth — which, in turn, engenders a strong desire to present them as such. The convenience is evident in the effort to summarize the relation between multiple levels of exposure and the outcome in a parsimonious manner, ideally using a single number. This, in turn, requires modelling a fairly simple, generally linear, relation.
The strategy for researchers to avoid misleading findings due to such modelling is straightforward: report categorical findings. Examining categorical data before modelling is, of course, standard statistical practice — all we are suggesting is reporting this important step. A simple column graph showing the risk for discrete exposure categories is our recommendation for quickly communicating the crude shape of the relation.
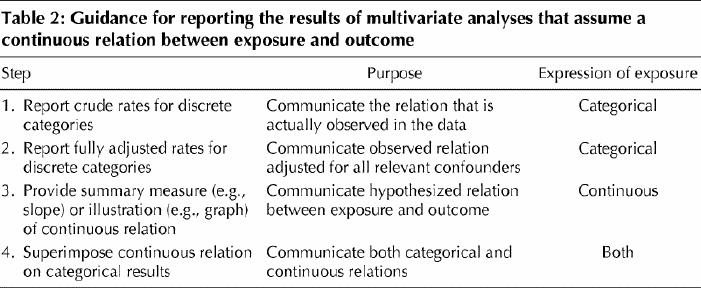
Reporting some intermediate steps of the analytical process before presenting a model that assumes a continuous relation will help everyone reconnect with the underlying data. Table 2 provides one vision of how this might be done. The first step is simply to report the crude rates of the outcome for discrete exposure categories. In other words, report what is actually observed. Examining categorical data before modelling is an important statistical practice, and authors should report the results of this step. This step is also the time to communicate another piece of basic information that readers and editors require to more fully understand the data: the size of various exposure groups. The second step is to report adjusted rates for discrete categories. Some may choose to report a hierarchy of adjusted results, starting with the most fundamental confounder — age — before moving on to adjust for other, less obvious confounders. This approach has the advantage of illustrating the effect of adjustment and where it is really important. The third step is to report the proposed continuous relation either with a summary measure (e.g., slope) or an illustration (e.g., graph). Finally, the proposed continuous relation should be superimposed on the adjusted categorical results to help judge its validity. Some investigators may need to present results with variables modelled as both categorical and continuous and provide an interpretation if there is a discrepancy. Others may choose not to assume a continuous relation and instead simply report the categorical data.
Table 2

Such straightforward data reporting creates a difficult challenge for researchers: how best to categorize exposure data. The answer is based on some combination of the need to use readily understandable cutoff points and the need to reasonably reflect the underlying distribution of exposure. Producing readily understandable cutoff points often involves digit preference (i.e., using round or whole numbers) or using cutoff points that connect to some external standard (i.e., regulation, standard definition, common practice). Reflecting the underlying distribution requires avoiding creating categories in which there are few observations, a discipline that can only improve the communication of what is really observed and what is really most relevant. Finding the balance in meeting these demands requires real work, but researchers must work hard to communicate the actual data in front of them.
The strategy for readers (as well as reporters and editors) trying to interpret multivariate analyses is to ask 3 basic questions. First, can I understand the levels of exposure? As a test, imagine communicating them to a patient (e.g., explain what “moderate adherence” means). Second, do I have some sense of the common categories of exposure? In other words, determine the levels of exposure that most people have. Finally, is the rate of outcome for these categories available? That simply implies knowing what happened to people in common exposure categories. If one cannot confidently answer Yes to these 3 questions, it is hard to imagine how the results could be useful to our patients or the public.
Although multivariate analysis is an important tool to minimize the influence of confounding variables, it may also tempt researchers to assume that the relation between an exposure and a health outcome is continuous. Researchers should examine categorical data before modelling a continuous relation and report these results. Reporting outcome data for discrete categories of exposure may help readers more accurately understand the benefits and harms of various health behaviours.
Footnotes
This article has been peer reviewed.
Contributors: Gilbert Welch drafted the original article, and Lisa Schwartz and Steven Woloshin provided critical input for its revision. All of the authors contributed to the conception of the article's analysis and the interpretation of the data and approved the final published version.
Competing interests: This study was supported in part by a grant from the National Cancer Institute (CA104721-01). Lisa Schwartz and Steven Woloshin are supported by Veterans Affairs Career Development Awards in Health Services Research and Development and by the Generalist Physician Faculty Scholars Program of The Robert Wood Johnson Foundation. The views expressed herein do not necessarily represent the views of the Department of Veterans Affairs or the United States Government.
Correspondence to: Dr. H. Gilbert Welch, VA Outcomes Group (111B), Department of Veterans Affairs Medical Center, White River Junction VT 05009, USA; h.gilbert.welch@dartmouth.edu
References
- 1.Schwartz LM, Woloshin S, Welch HG. Misunderstandings about the effects of race and sex on physicians' referrals for cardiac catheterization. N Engl J Med 1999;341:279-83. [DOI] [PubMed]
- 2.Malenka DJ, Baron JA. Cholesterol and coronary heart disease. The attributable risk reduction of diet and drugs. Arch Intern Med 1989;149:1981-5. [PubMed]
- 3.Naylor CD, Chen E, Strauss B. Measured enthusiasm: Does the method of reporting trial results alter perceptions of therapeutic effectiveness? Ann Intern Med 1992;117:916-21. [DOI] [PubMed]
- 4.Altman DG, Schulz KF, Moher D, Egger M, Davidoff F, Elbourne D, et al; CONSORT GROUP (Consolidated Standards of Reporting Trials). The revised CONSORT statement for reporting randomized trials: explanation and elaboration. Ann Intern Med 2001;134:663-94. [DOI] [PubMed]
- 5.Nuovo J, Melnikow J, Chang D. Reporting number needed to treat and absolute risk reduction in randomized controlled trials. JAMA 2002;287:2813-4. [DOI] [PubMed]
- 6.Trichopoulou A, Costacou T, Bamia C, Trichopoulos D. Adherence to a Mediterranean diet and survival in a Greek population. N Engl J Med 2003;348:2599-608. [DOI] [PubMed]
- 7.This week in the journal. N Engl J Med 2003;348:2593-4.
- 8.Fontaine KR, Redden DT, Wang C, Westfall AO, Allison DB. Years of life lost due to obesity. JAMA 2003;289:187-93. [DOI] [PubMed]


