Abstract
Long non-coding RNAs (lncRNAs) are continuously transcribed and are involved in various cellular activities. However, their contributions to the occurrence and development of germinal center B-cell (GCB)-like diffuse large B-cell lymphoma (DLBCL) remain largely unknown. We applied microarray technology to profile the expression of lncRNAs in two different GCB-DLBCL cell lines (OCI-ly1 and OCI-ly19) and normal B lymphocytes. We demonstrated that 21,539 lncRNAs were expressed in all of the samples analyzed. This included 1,648 lncRNAs that showed a ≥2-fold upregulation and 2,671 lncRNAs that displayed a ≥2-fold downregulation in tumor cell lines (P<0.05). The expression levels of 8 lncRNAs were validated by quantitative reverse transcription polymerase chain reaction (qRT-PCR). Bioinformatic analyses (Gene Ontology, pathway and network analysis) were performed to predict how the differentially expressed lncRNAs may function in GCB-DLBCL. Results from the pathway analysis suggested that totals of 64 and 62 biological pathways corresponded to upregulated and downregulated transcripts, respectively (P<0.05). Additionally, we constructed a lncRNA-mRNA network for the purpose of identifying specific coding genes which were co-expressed with 5 selected lncRNAs. Conclusively, our results may contribute to a better understanding of GCB-DLBCL pathogenesis.
Keywords: diffuse large B-cell lymphoma, germinal center, lncRNA expression profiling, microarray
Introduction
Diffuse large B-cell lymphoma (DLBCL) is a type of non-Hodgkin lymphoma (NHL), which is most frequently diagnosed in adults and comprises 35–40% of all NHL cases in Western countries (1). Germinal center B-cell (GCB)-like DLBCL is a subtype of DLBCL and is postulated to arise from GC centroblasts, which is characterized by high expression level of BCL6 and somatic hypermutations of immunoglobulin genes (2,3). The most prevalent chromosomal translocation found in GCB-DLBCL is t(14;18)(q32;q21) which can be detected in 30–40% of the cases (4). Moreover, 8q24 rearrangement involving MYC (5) and 10q23 deletion involving PTEN (6) have also been detected in GCB-DLBCL. Enhancer of zeste homolog 2 (EZH2), an epigenetic modifier, exhibits gain-of-function mutations in 6–14% of DLBCL cases, and these mutations are detected almost exclusively in the GCB subtype (7,8). However, the presence of these genetic aberrations does not fully explain the complex pathogenesis of GCB-DLBCL, for the reason that this disease may also partially result from epigenetic factors such as cytosine modifications, histone modifications, and the influence of non-coding RNA molecules.
Non-coding RNAs (ncRNAs) are thought to be critically involved in both cellular physiological processes and cancer pathogenesis. These ncRNAs exist in two forms: short ncRNAs that comprise 18–200 nucleotides and long ncRNAs that comprise >200 nucleotides (9). Additionally, a variety of microRNAs (miRs) such as miR-155 and miR-17–92 have been shown to be aberrantly expressed in GCB-DLBCL (10). Accumulating data have suggested the critical roles of long non-coding RNAs (lncRNAs) in immune responses, cell differentiation, tumorigenesis and genomic imprinting (11). Moreover, aberrantly expressed lncRNAs have also been shown to be associated with certain types of cancers including pancreatic cancer, glioblastoma and hepatocellular carcinoma (11–13).
The functions and genome-wide expression patterns of lncRNAs in GCB-DLBCL have remained largely unclear. Therefore, we performed microarray analysis to investigate the expression profiles of lncRNAs in GCB-DLBCL cells. Our results showed that thousands of differentially expressed lncRNAs were present in GCB-DLBCL cells compared with benign B cells. Next, 8 lncRNAs were selected to validate the microarray results by qRT-PCR. Furthermore, the possible functions and mechanisms of these lncRNAs were predicted by Gene Ontology, pathway and network analyses. Conclusively, our findings may offer further insight into the occurrence and development of GCB-DLBCL.
Materials and methods
Sample preparation and RNA extraction
The methods used in the present study conformed with ethical principles listed in the Helsinki Declaration, and the study protocol was reviewed and approved by the China Medical University Ethics Committee. Ten biopsy specimens of GCB-DLBCL tissue and 10 specimens of reactive lymph node (RLN) tissue were included in the present study, in addition to the cell lines described below. The biopsy specimens were provided by the Shengjing Hospital of China Medical University, Department of Pathology. Criteria described in the 2008 World Health Organization (WHO) classification system were used to confirm all diagnoses of GCB-DLBCL. Human GCB-DLBCL cell lines OCI-ly1 and OCI-ly19 were purchased from the Shanghai Institutes for Biological Sciences Cell Resource Center and cultured in Dulbecco's modified Eagles medium (DMEM)-high glucose which contained 10% fetal bovine serum (FBS; Gibco, Carlsbad, CA, USA). Healthy donor blood was provided by the Regional Blood Donor Center, and CD19 microbeads (Miltenyi Biotec, Bergisch Gladbach, Germany) were used to isolate CD19-positive B cells from the buffy coats of those donor samples. All cells were incubated in a 37°C incubator with a humidified atmosphere of 5% CO2.
The total RNA of each sample was isolated using TRIzol reagent (Invitrogen, Carlsbad, CA, USA); after which, the amounts of extracted RNA were quantified by a NanoDrop ND-1000 spectrophotometer. The structural integrity of isolated RNA was evaluated by agarose gel electrophoresis under denaturing conditions, and the RNA purity was assessed by the ratio of absorbance at 260 and 280 nm.
RNA microarray
Arraystar Human LncRNA Microarray V3.0 was used to profile the lncRNAs in our specimens, and was able to detect ~30,586 lncRNAs and 26,109 coding transcripts. Information provided in various transcriptome databases (RefSeq, GENCODE and UCSC Knowngenes) and previously published studies was used to help construct the lncRNAs. The individual transcripts were accurately identified by highly specific exon or splice junction probes. To ensure the quality control of hybridization, the array also included negative probes and positive probes for housekeeping genes.
RNA labeling and array hybridization
A slightly modified version of the Agilent One-Color Microarray-Based Gene Expression Analysis protocol (Agilent Technologies, Inc., Santa Clara, CA, USA) was used for sample labeling and array hybridization. In brief, an mRNA-ONLY™ Eukaryotic mRNA Isolation kit (Epicentre Biotechnologies, Madison, WI, USA) was used to remove rRNA from total RNA. Next, an Arraystar Flash RNA Labeling kit (Arraystar, Rockville, MD, USA) was used to amplify each purified sample and then transcribe it into fluorescent cRNA containing the full length transcript without 3′ bias using a random priming method. The fluorescence-labeled cRNAs were purified using an RNeasy Mini kit (Qiagen, Valencia, CA, USA). Spectrophotometric methods were used to measure the concentration and specific activity of the labeled cRNAs (pmol Cy3/µg cRNA). One microgram of the labeled cRNAs was treated with 5 µl of 10X blocking agent and 1 µl of 25X fragmentation buffer; after which, the mixture was heated for 30 min at 60°C. After heating, the mixture was diluted with 25 µl of 2X GE hybridization buffer. Subsequently, 50 µl of hybridization solution was dispensed into the gasket slide and assembled to the lncRNA expression microarray slide. The combined slides were then incubated in an Agilent hybridization oven set at 65°C for 17 h. Following incubation, the hybridized arrays were washed, fixed and scanned with an Agilent DNA Microarray Scanner (part no. G2505C).
Analysis of microarray data
All the array images were analyzed using Agilent Feature Extraction software (version 11.0.1.1). GeneSpring GX v12.1 software (Agilent Technologies) was used to normalize quartile values and perform the required data processing. After the raw data had been normalized, lncRNAs and mRNAs that had flags indicating either ‘Present’ or ‘Marginal’ in ≥3 of 9 samples were selected for further evaluation. LncRNAs and mRNAs that showed significant differential expression patterns in lymphoma cells vs. normal cells were identified by P-value/FDR filtering and fold-change filtering. Homemade scripts were used for purposes of hierarchical clustering and combined analyses.
Gene Ontology (GO) and Kyoto Encyclopedia of Genes and Genomes (KEGG) pathway analysis
The Gene Ontology (GO) consortium (http://www.geneontology.org) has developed a comprehensive unified vocabulary for use when describing genes and gene products of an organism. This ontology classifies functions along three aspects: biological process, cellular component and molecular function. We used Fisher's exact test to determine whether any overlap that existed among items on the differentially expressed (DE) list and GO annotation list was larger than could be expected to occur by chance. The statistical significance of the GO term enrichment in the DE genes was expressed as the P-value, and the FDR signifies the false discovery rate. A lower P-value signifies a more significant GO term, with P-value ≤0.05 being recommended. Pathway analysis was performed to map specific genes to various KEGG pathways (http://www.genome.jp/kegg/). The P-value (EASE-score, Fisher or hypergeometric P-values) was used to indicate the significance of any correlation between a pathway and certain conditions. A lower P-value indicates a more significant correlation, with P-value ≤0.05 being recommended.
Quantitative reverse transcription polymerase chain reaction (qRT-PCR)
Several lncRNAs from the microarray data analysis were further validated by qRT-PCR. SuperScript™ III Reverse Transcriptase (Invitrogen) was used for reverse transcription of total RNA. Quantitative RT-PCR was performed using SYBR-Green kit (Invitrogen) in a Rotor-Gene 3000 Real-time PCR Detection System (Corbett Research, Brisbane, Australia). The specific primers used to transcribe each gene are shown in Table I.
Table I.
Oligonucleotide sequences of the qRT-PCR primers.
| Gene name | Bidirectional primer sequences |
|---|---|
| β-actin | F: 5′-GTGGCCGAGGACTTTGATTG-3′ |
| R: 5′-CCTGTAACAACGCATCTCATATT-3′ | |
| ENST00000424690 | F: 5′-AGCCAACTGGGATAAAGAAGAG-3′ |
| R: 5′-TAGAGGAAGGCAACTGTCACTCT-3′ | |
| ENST00000455011 | F: 5′-AAAATGCGTGCCCTCTTGT-3′ |
| R: 5′-GGGCTCCATCATTCATCCTT-3′ | |
| ENST00000451368 | F: 5′-AAGCCTGAGTAACAGAGGAGAAC-3′ |
| R: 5′-CAACTGCACTCCAAATGGCT-3′ | |
| ENST00000425358 | F: 5′-CCAGAAACCAGCCATAGTCC-3′ |
| R: 5′-CCTTCCTCCGCTAAATCTCA-3′ | |
| ENST00000558952 | F: 5′-TTAGCCATACTCAGCACCCTT-3′ |
| R: 5′-CATGCACGTCAACCACAAAC-3′ | |
| NR_026892 | F: 5′-CTTCCCTAACACCGCAGTATC-3′ |
| R: 5′-TTCCTAGACAGTCAGGCTCCAG-3′ | |
| ENST00000464929 | F: 5′-CCAAGATGGTTTCCCTAGAAG-3′ |
| R: 5′-GTCCAATATCAAGGTGTCAGCA-3′ | |
| ENST00000475089 | F: 5′-TCGGTGTCACATGCTGCTTC-3′ |
| R: 5′-GAGAACCCGATCCCTCCCTC-3′ |
F, forward; R, reverse.
The relative fold-change normalized to β-actin was calculated using the 2−ΔΔCt method. Differences between the lncRNAs expressed in groups of GCB-DLBCL cells vs. normal cells were evaluated with the paired t-test. P-value <0.05 was regarded as statistically significant.
Establishment of the co-expression network
The correlations identified between differentially expressed mRNAs and lncRNAs were used to construct the lncRNA-mRNA co-expression network comprising 5 validated lncRNAs and their co-expressed coding genes. The following steps were taken to establish this network: i) we first pre-processed the data using the median gene expression value of all transcripts expressed from the same coding gene, without giving special treatment to the lncRNA expression value. ii) Next, the data were screened for differentially expressed mRNAs and lncRNAs, and then these data were deleted from the dataset. iii) We calculated Pearson correlation coefficient (PCC) and used the R-value to calculate the correlation coefficient of the PCC between the lncRNAs and mRNAs (only lncRNA-mRNA PCC, not including lncRNA-lncRNA and mRNA-mRNA PCC). iv) Lastly, we defined PCC ≥0.99 as significant and then used Cytoscape v2.8.1 software to plot the co-expression network.
Statistical analysis
All data were analyzed using IBM SPSS Statistics for Windows, version 21.0 (IBM, Armonk, NY, USA). Student's paired t-test was used to compare the parameters in the two groups. P-value <0.05 was regarded as statistically significant.
Results
Differentially expressed lncRNAs
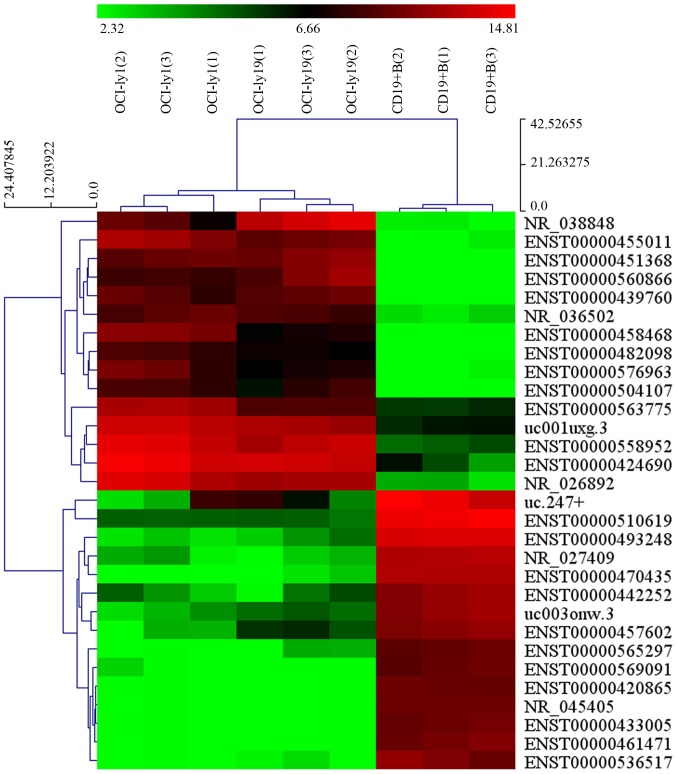
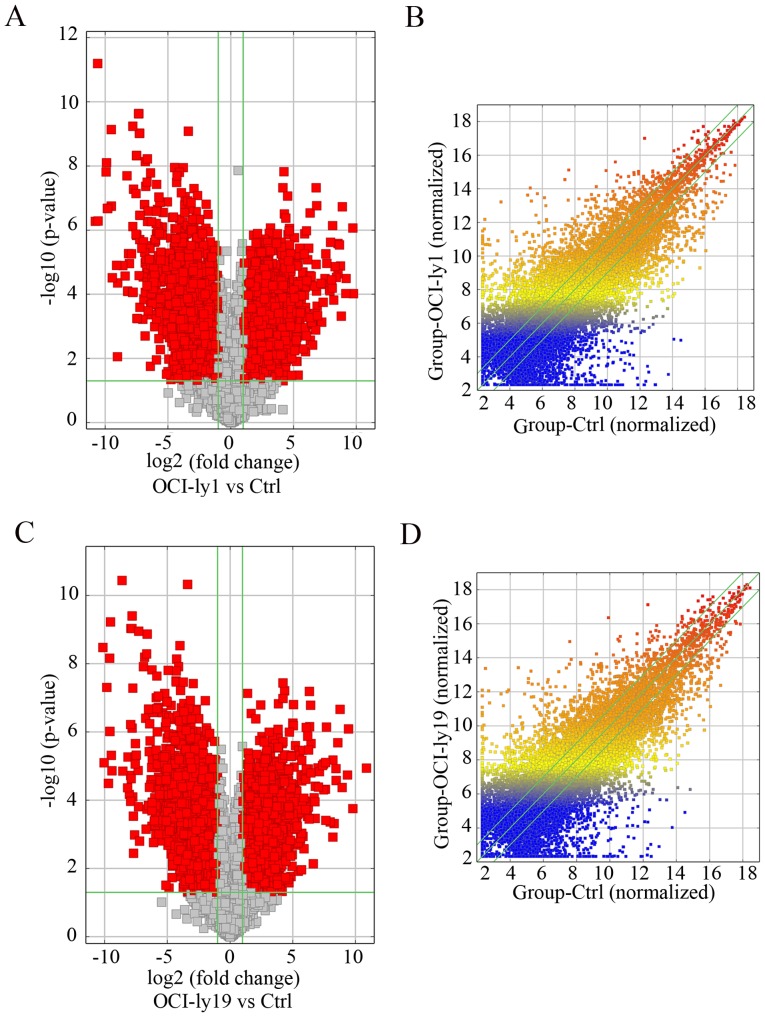
Our microarray results revealed that thousands of differentially expressed lncRNAs were present in OCI-ly1 and OCI-ly19 cells compared with benign B cells. Among them, 1,648 lncRNAs displayed significant upregulation, and 2,671 lncRNAs displayed significant downregulation in the two lymphoma cell lines (fold-change ≥2.0; P<0.05). NR_026892 and ENST00000464929 were among the most upregulated and downregulated lncRNAs, respectively. The heat map showing the results of a two-way hierarchical clustering of samples and lncRNAs is presented in Fig. 1. Additionally, the volcano plots (Fig. 2A and C) and scatter plots (Fig. 2B and D) display the aberrantly expressed lncRNAs between lymphoma cells and normal cells.
Figure 1.
Hierarchical clustering for differentially expressed lncRNAs. Each row represents a lncRNA and each column represents a sample. The top is the sample clustering tree. The color scale shown at the top illustrates the relative expression level of a lncRNA in an individual slide: red, high expression; green, low expression.
Figure 2.
Volcano plots of differentially expressed lncRNAs in the (A) OCI-ly1 and (C) OCI-ly19 cell lines. Scatter plots of differentially expressed lncRNAs in (B) OCI-ly1 and (D) OCI-ly19 cells. For the volcano plot, the vertical green lines correspond to a 2.0-fold upregulation and downregulation while the horizontal green line represents a P-value of 0.05. The red dots to the left and to the right of the vertical green lines indicate >2.0 fold-change and represent the differentially expressed lncRNAs with statistical significance (fold-change ≥2.0; P<0.05). The values of the x- and y-axes in the scatter plot are the means of normalized signal values of groups of samples (log2 scaled).
For further analysis, the lncRNAs were classified into three different groups: antisense, enhancer and lincRNAs, respectively. We found that 612 antisense lncRNAs, 333 enhancer lncRNAs and 581 lincRNAs were deregulated in the OCI-ly1 cells, and 694 antisense lncRNAs, 349 enhancer lncRNAs and 646 lincRNAs were deregulated in the OCI-ly19 cells (fold-change ≥2.0; P<0.05).
Differentially expressed mRNAs
The differentially expressed mRNAs in the OCI-ly1 and OCI-ly19 cells compared with normal B lymphocytes were identified using microarray technology. Our mRNA expression profiling data indicated that 3,691 mRNAs displayed significant upregulation, and 2,974 mRNAs displayed significant downregulation in the two lymphoma cell lines (fold-change ≥2.0; P<0.05). NM_001071 was one of the most upregulated mRNAs, while NM_033512 was one of the most downregulated mRNAs.
GO and KEGG pathway analysis
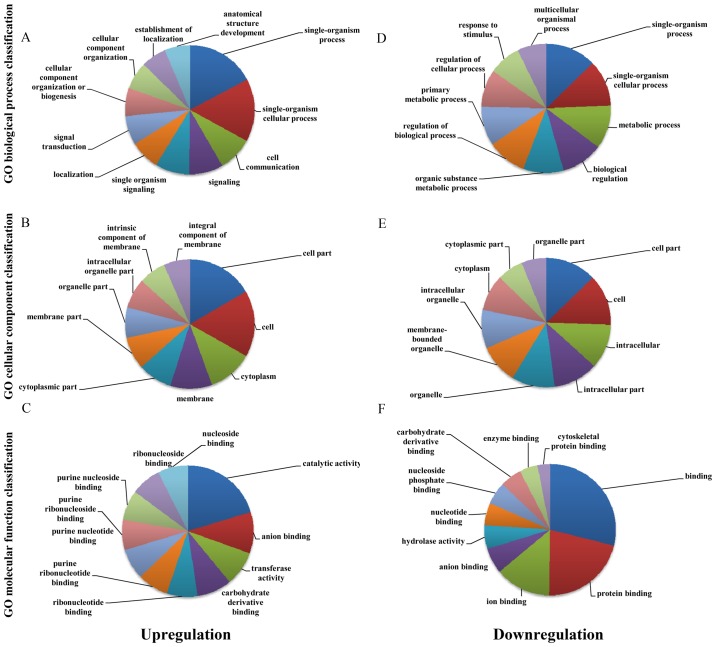
Our GO analysis showed that the most enriched GO terms targeted by upregulated transcripts referred to single-organism process (ontology: biological process), cell part and cell (ontology: cellular component) and catalytic activity (ontology: molecular function). Similarly, the most enriched GO terms targeted by downregulated transcripts referred to single-organism process (ontology: biological process), cell part and cell (ontology: cellular component) and binding (ontology: molecular function) (Fig. 3).
Figure 3.
The most highly enriched GO terms for the differentially expressed transcripts. Most highly enriched GO terms for the upregulated transcripts: (A) biological process (BP); (B) cellular component (CC); (C) molecular function (MF). Most highly enriched GO terms for downregulated transcripts: (D) biological process (BP); (E) cellular component (CC); (F) molecular function (MF).
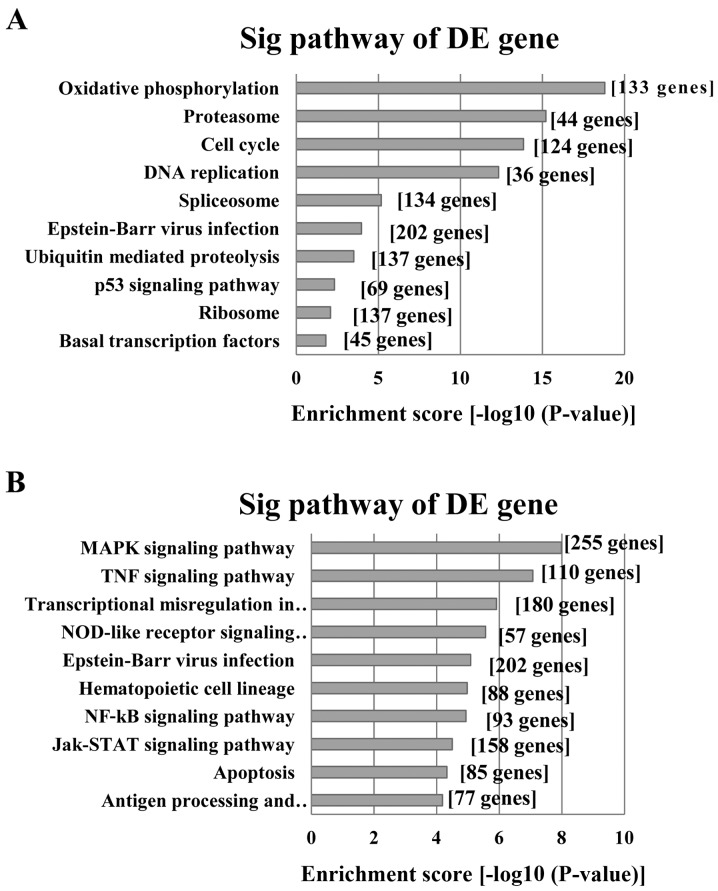
Our KEGG pathway analysis indicated that the upregulated transcripts corresponded to 64 pathways. The ‘proteasome pathway’ (Pathway ID: hsa03050) which included 32 upregulated genes in our profiles was the highest enriched pathway associated with tumors (Fig. 4A). However, our analysis also revealed that the downregulated transcripts corresponded to 62 pathways. The ‘MAPK signaling pathway’ (Pathway ID: hsa04010) which included 69 downregulated genes in our profiles showed the greatest enrichment among those pathways associated with tumors (Fig. 4B).
Figure 4.
The most highly enriched pathways associated with tumors for the differentially expressed transcripts. (A) Pathways corresponding to the upregulated transcripts. (B) Pathways corresponding to downregulated transcripts.
Validation of microarray results by qRT-PCR
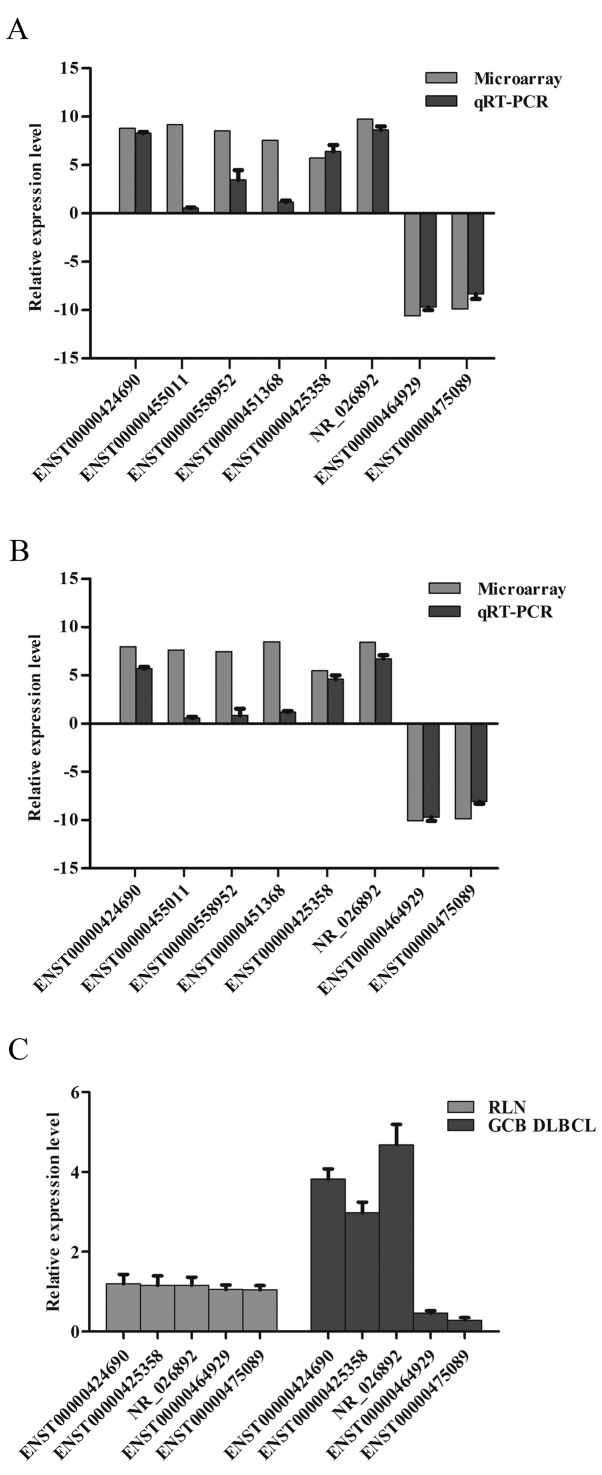
The microarray results of 8 selected lncRNAs were further validated by qRT-PCR. The selected lncRNAs included 6 upregulated and 2 downregulated lncRNAs (Table II). On the one hand, we selected 2 upregulated lncRNAs (ENST00000455011 and ENST00000451368) and 2 downregulated lncRNAs (ENST00000464929 and ENST00000475089) due to their significant fold-change in our expression profiles. On the other hand, we also selected 4 upregulated lncRNAs (ENST00000558952, ENST00000425358, NR_026892 and ENST00000424690) from our profiles since all of them were reported to either act as carcinogenic factors or be associated with poor clinical outcomes in other types of tumors. Data analysis indicated a statistically significant difference. The qRT-PCR results showed that ENST00000424690, ENST00000425358 and NR_026892 were upregulated, while ENST00000464929 and ENST00000475089 were downregulated in OCI-ly1 and OCI-ly19 cells compared with normal B lymphocytes (fold-change ≥2.0; P<0.05) (Fig. 5A and B).
Table II.
Basic information of the selected 8 lncRNAs for qRT-PCR confirmation.
| OCI-ly1 cells | OCI-ly19 cells | ||||
|---|---|---|---|---|---|
| Seqname | Regulation | P-value | Fold-change | P-value | Fold-change |
| ENST00000424690 | Up | 0.000479464 | 446.7613383 | 0.000428945 | 251.1963515 |
| ENST00000455011 | Up | 3.20045E-05 | 582.2601741 | 7.7906E-06 | 196.3856176 |
| ENST00000451368 | Up | 5.46548E-06 | 190.1528344 | 2.62789E-05 | 351.5618304 |
| ENST00000425358 | Up | 2.05718E-05 | 53.1231945 | 3.4208E-06 | 44.0691755 |
| ENST00000558952 | Up | 2.29737E-05 | 370.505128 | 4.90638E-05 | 176.043018 |
| NR_026892 | Up | 9.4681E-05 | 874.6597124 | 1.17842E-05 | 345.194388 |
| ENST00000464929 | Down | 6.4E-12 | 1563.86804 | 7.95406E-06 | 1055.412968 |
| ENST00000475089 | Down | 7.8724E-09 | 960.5307121 | 4.91065E-08 | 914.0689387 |
Figure 5.
Comparison and distributions of lncRNA expression levels between the microarray and qRT-PCR results. Comparison of the expression levels of lncRNAs: Eight lncRNAs were validated by qRT-PCR in (A) OCI-ly1 and (B) OCI-ly19 cells. The y-axis represents the log-transformed median fold-changes (T/N). ENST00000424690, ENST00000425358 and NR_026892 were upregulated, while ENST00000464929 and ENST00000475089 were downregulated (P<0.05). (C) Distributions of lncRNA expression levels: Five lncRNAs were validated by qRT-PCR in 10 GCB DLBCL and 10 RLN samples (P<0.05).
Additionally, qRT-PCR was used to detect the expression levels of these 5 lncRNAs (ENST00000424690, ENST00000425358, NR_026892, ENST00000464929 and ENST00000475089) in 10 pairs of clinical samples including 10 GCB-DLBCL samples and 10 RLN samples. Our results showed that ENST00000424690, ENST00000425358 and NR_026892 were upregulated, while ENST00000464929 and ENST00000475089 were downregulated in the GCB-DLBCL samples compared with the RLN samples (fold-change ≥2.0; P<0.05) (Fig. 5C). Thus, the expression trend of these 5 lncRNAs in clinical samples was essentially the same as indicated by the microarray data.
Establishment of the lncRNA-mRNA co-expression network
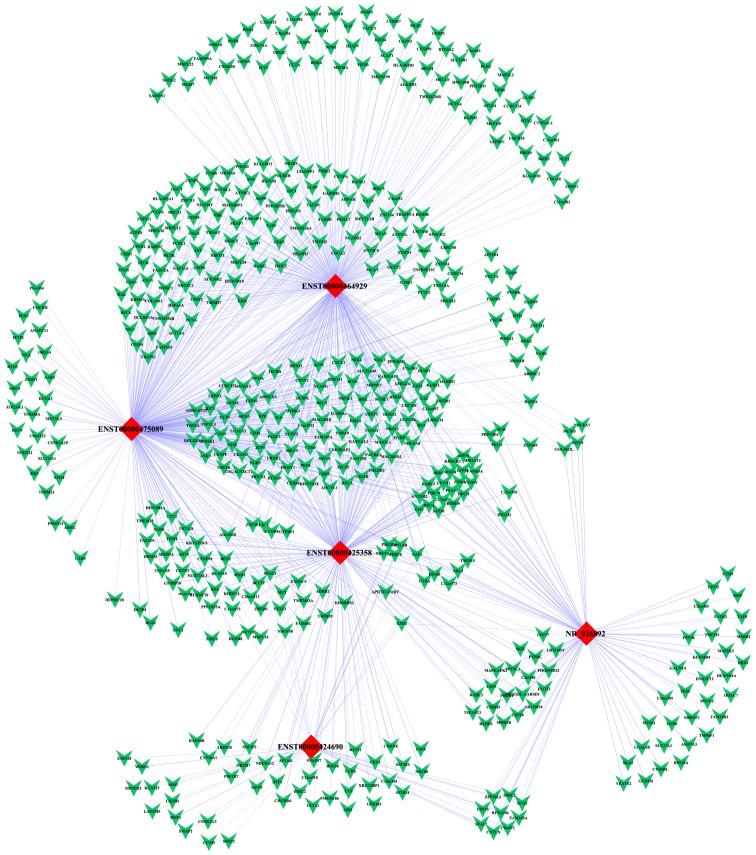
We constructed a lncRNA-mRNA co-expression network consisting of 5 deregulated lncRNAs and their co-expressed coding genes. As we mentioned above, 6 upregulated lncRNAs and 2 downregulated lncRNAs were chosen for further confirmation of microarray results using qRT-PCR. However, 3 of them were not shown to be differentially expressed in GCB-DLBCL cells according to the qRT-PCR results, for the reason that false-positive results did exist in the high throughput detection by microarray. Therefore, we only selected 5 validated lncRNAs to construct the co-expression network. The mRNAs and lncRNAs with PCC ≥0.99 were selected to establish the network using Cytoscape software. The network comprised 522 nodes and 1,005 connections between 517 mRNAs and 5 lncRNAs. Among the connections, 434 and 571 pairs presented as positive and negative, respectively (Fig. 6). Our co-expression network suggested that inter-regulation of lncRNAs and coding genes may contribute to GCB-DLBCL pathogenesis.
Figure 6.
The co-expression network of 5 deregulated lncRNAs and 517 targeted coding genes. Red diamonds represent lncRNAs, and green Vs represent mRNAs. Blue solid lines indicate positive correlations, and blue dotted lines indicate negative correlations.
Discussion
DLBCL is the most common type of NHL in adults and is characterized by a wide variety of genetic aberrations including BCL2 translocation (4) and somatic hypermutations of immunoglobulin genes (2,3). Although the molecular mechanisms underlying the occurrence and development of GCB-DLBCL have been extensively investigated over the past decades, its pathogenesis has not been fully elucidated. To date, increasing evidence indicates that aberrantly expressed lncRNAs are associated with tumorigenesis and chemotherapy resistance in various cancers, such as HOTAIR in breast cancer (14), CCAT1 in colorectal cancer (15), HEIH in hepatocellular carcinoma (12) and MALAT1 in DLBCL (16). Moreover, the biological functions of several deregulated lncRNAs in lymphoid malignancies have been well documented, including LUNAR1 (17), MINCR (18) and FAS-AS1 (19). Recently, it has been reported that immune-related lncRNA biomarkers are associated with both the molecular subtype of DLBCL and the prognosis of DLBCL patients (20).
In the present study, we applied microarray technology to investigate the expression patterns of lncRNAs in two types of GCB-DLBCL cell lines and identified 1,648 upregulated lncRNAs and 2,671 downregulated lncRNAs. We then performed qRT-PCR to validate the expression levels of 5 selected lncRNAs (ENST00000424690, ENST00000425358, NR_026892, ENST00000464929 and ENST00000475089) in the same series of samples, as well as in 10 pairs of clinical samples. The qRT-PCR results were essentially consistent with those obtained from the microarray analysis. Subsequently, our KEGG pathway analysis showed that totals of 64 and 62 biological pathways corresponded to the upregulated and downregulated transcripts, respectively.
We focused on the ubiquitin-proteasome and p53 signaling pathways due to the fact that the ubiquitin-proteasome system exerts critical roles particularly in hematological malignancies and inactivation of p53 functions exists in most all types of human cancer cells. The ubiquitin-proteasome system attaches ubiquitin to a target protein, and this process requires the participation of three core enzymes: ubiquitin activating enzyme (E1 enzyme), ubiquitin conjugating enzyme (E2 enzyme) and ubiquitin ligase (E3 ligase) (21). Generally, ubiquitin tagged proteins are then recognized and degraded by 26S proteasomes (21). The ubiquitin-proteasome system controls the turn-over of regulatory proteins involved in pivotal biological processes (22,23) and helps modulate the pathological state of various human diseases (24). Notably, proteasome inhibitors have shown marked therapeutic benefits in many types of hematological malignancies (25,26). Therefore, investigation of the relationship between lncRNAs and ubiquitin-proteasome system in GCB-DLBCL appears to be valuable. The tumor suppressor gene p53 has been regarded as ‘the guardian of the genome’, as it is necessary for the maintenance of genomic stability, and its inactivation is highly associated with most cancers. However orchestrating transcription-dependent and -independent cell death programs, p53 gene plays important roles in cell cycle progression, as it regulates G1/S, S and G2/M cell cycle checkpoints (27). The cell cycle progression is driven by cyclin/cyclin-dependent kinases (CDKs) including cyclin D/CDK4, cyclin E/CDK2 and cyclin A/CDK2 complexes, which contribute to the phosphorylation of tumor suppressors of the RB family, leading to DNA replication (28).
Subsequently, we constructed the lncRNA-mRNA correlation network that displayed 5 deregulated lncRNAs and their co-expressed coding genes. In the co-expression network, 3 cell cycle-related genes including G2 and S phase expressed 1 (GTSE1), cyclin-dependent kinase 4 (CDK4) and cyclin-dependent kinase 1 (CDK1), which had involvement in the p53 signaling pathway in the present study, were found to be negatively correlated with 2 downregulated lncRNAs (ENST00000464929 and ENST00000475089) in our profiles. Furthermore, these 2 lncRNAs displayed significant negative correlations with 4 pivotal genes in the ubiquitin-proteasome pathway, including proteasome subunit α7 (PSMA7), proteasome 26S subunit, non-ATPase 14 (PSMD14), ubiquitin conjugating enzyme E2 K (UBE2K) and ubiquitin conjugating enzyme E2 C (UBE2C). These findings indicated that ENST00000464929, ENST00000475089 and their co-expressed coding genes in the ubiquitin-proteasome pathway and the p53 signaling pathway probably play a significantly collective role in the pathogenesis of GCB-DLBCL.
Further investigation of the lncRNA-gene network revealed an association between the levels of ENST00000425358 and NR_026892 expression and certain carcinogenic or anti-carcinogenic genes such as the MYB proto-oncogene (MYB), RAS oncogene family-like 3 (RABL3), and XIAP associated factor 1 (XAF1). These findings highlight the critical roles exerted by these two upregulated lncRNAs in GCB-DLBCL pathogenesis. ENST00000425358, also known as HOXA transcript antisense RNA, myeloid-specific 1 (HOTAIRM1), is a long intergenic non-coding RNA located at the 3′-end of the HOXA cluster, which is upregulated during the maturation of myeloid cells (29). HOTAIRM1 is thought to regulate the expression of numerous genes that determine cell fate. HOTAIRM1 was previously demonstrated to be specifically expressed in myeloid lineages of hematopoietic cells (29), but recently HOTAIRM1 was shown to be overexpressed in cases of basal-like breast cancer (30) and pancreatic ductal adenocarcinoma (31). Taken together, we inferred that this long intergenic non-coding RNA may participate in the occurrence and malignant progression of GCB-DLBCL.
In conclusion, we performed a detailed examination of lncRNA expression in GCB-DLBCL cells and identified numerous lncRNAs that displayed aberrant expression in GCB-DLBCL when compared with normal control. Additionally, we demonstrated that several differentially expressed lncRNAs were correlated with multiple Gene Ontology items and pathways involved in carcinogenesis, suggesting a pivotal role of lncRNAs in the pathogenesis of GCB-DLBCL. From a clinical point of view, the potential values of lncRNAs for diagnosis and prognosis prediction have been well demonstrated (32–34). In the present study, we presented several candidate lncRNAs which could serve as biological markers for GCB-DLBCL. However, this possibility requires more sufficient information concerning prognosis and cohort study of patients in our subsequent research.
Glossary
Abbreviations
- lncRNAs
long non-coding RNAs
- GCB
germinal center B-cell
- DLBCL
diffuse large B-cell lymphoma
- qRT-PCR
quantitative reverse transcription polymerase chain reaction
- NHL
non-Hodgkin lymphoma
- EZH2
enhancer of zeste homolog 2
- ncRNAs
non-coding RNAs
- miRs
microRNAs
- RLN
reactive lymph node
- WHO
World Health Organization
- DMEM
Dulbecco's modified Eagles medium
- FBS
fetal bovine serum
- GO
Gene Ontology
- KEGG
Kyoto Encyclopedia of Genes and Genomes
- DE
differentially expressed
- PCC
Pearson correlation coefficient
- CDKs
cyclin-dependent kinases
- GTSE1
G2 and S phase expressed 1
- CDK4
cyclin-dependent kinase 4
- CDK1
cyclin-dependent kinase 1
- PSMA7
proteasome subunit α7
- PSMD14
proteasome 26S subunit, non-ATPase 14
- UBE2K
ubiquitin-conjugating enzyme E2 K
- UBE2C
ubiquitin-conjugating enzyme E2 C
- MYB
MYB proto-oncogene
- RABL3
RAS oncogene family-like 3
- XAF1
XIAP associated factor 1
- HOTAIRM1
HOXA transcript antisense RNA, myeloid-specific 1
References
- 1.Rodriguez-Abreu D, Bordoni A, Zucca E. Epidemiology of hematological malignancies. Ann Oncol. 2007;18:i3–i8. doi: 10.1093/annonc/mdl443. (Suppl 1) [DOI] [PubMed] [Google Scholar]
- 2.Alizadeh AA, Eisen MB, Davis RE, Ma C, Lossos IS, Rosenwald A, Boldrick JC, Sabet H, Tran T, Yu X, et al. Distinct types of diffuse large B-cell lymphoma identified by gene expression profiling. Nature. 2000;403:503–511. doi: 10.1038/35000501. [DOI] [PubMed] [Google Scholar]
- 3.Shaffer AL, III, Young RM, Staudt LM. Pathogenesis of human B cell lymphomas. Annu Rev Immunol. 2012;30:565–610. doi: 10.1146/annurev-immunol-020711-075027. [DOI] [PMC free article] [PubMed] [Google Scholar]
- 4.Iqbal J, Sanger WG, Horsman DE, Rosenwald A, Pickering DL, Dave B, Dave S, Xiao L, Cao K, Zhu Q, et al. BCL2 translocation defines a unique tumor subset within the germinal center B-cell-like diffuse large B-cell lymphoma. Am J Pathol. 2004;165:159–166. doi: 10.1016/S0002-9440(10)63284-1. [DOI] [PMC free article] [PubMed] [Google Scholar]
- 5.Kramer MH, Hermans J, Wijburg E, Philippo K, Geelen E, van Krieken JH, de Jong D, Maartense E, Schuuring E, Kluin PM. Clinical relevance of BCL2, BCL6, and MYC rearrangements in diffuse large B-cell lymphoma. Blood. 1998;92:3152–3162. [PubMed] [Google Scholar]
- 6.Lenz G, Wright GW, Emre NC, Kohlhammer H, Dave SS, Davis RE, Carty S, Lam LT, Shaffer AL, Xiao W, et al. Molecular subtypes of diffuse large B-cell lymphoma arise by distinct genetic pathways. Proc Natl Acad Sci USA. 2008;105:13520–13525. doi: 10.1073/pnas.0804295105. [DOI] [PMC free article] [PubMed] [Google Scholar]
- 7.Pasqualucci L, Trifonov V, Fabbri G, Ma J, Rossi D, Chiarenza A, Wells VA, Grunn A, Messina M, Elliot O, et al. Analysis of the coding genome of diffuse large B-cell lymphoma. Nat Genet. 2011;43:830–837. doi: 10.1038/ng.892. [DOI] [PMC free article] [PubMed] [Google Scholar]
- 8.Morin RD, Johnson NA, Severson TM, Mungall AJ, An J, Goya R, Paul JE, Boyle M, Woolcock BW, Kuchenbauer F, et al. Somatic mutations altering EZH2 (Tyr641) in follicular and diffuse large B-cell lymphomas of germinal-center origin. Nat Genet. 2010;42:181–185. doi: 10.1038/ng.518. [DOI] [PMC free article] [PubMed] [Google Scholar]
- 9.Kowalczyk MS, Higgs DR, Gingeras TR. Molecular biology: RNA discrimination. Nature. 2012;482:310–311. doi: 10.1038/482310a. [DOI] [PubMed] [Google Scholar]
- 10.Jardin F, Figeac M. MicroRNAs in lymphoma, from diagnosis to targeted therapy. Curr Opin Oncol. 2013;25:480–486. doi: 10.1097/CCO.0b013e328363def2. [DOI] [PubMed] [Google Scholar]
- 11.Han L, Zhang K, Shi Z, Zhang J, Zhu J, Zhu S, Zhang A, Jia Z, Wang G, Yu S, et al. LncRNA profile of glioblastoma reveals the potential role of lncRNAs in contributing to glioblastoma pathogenesis. Int J Oncol. 2012;40:2004–2012. doi: 10.3892/ijo.2012.1413. [DOI] [PubMed] [Google Scholar]
- 12.Yang F, Zhang L, Huo XS, Yuan JH, Xu D, Yuan SX, Zhu N, Zhou WP, Yang GS, Wang YZ, et al. Long non-coding RNA high expression in hepatocellular carcinoma facilitates tumor growth through enhancer of zeste homolog 2 in humans. Hepatology. 2011;54:1679–1689. doi: 10.1002/hep.24563. [DOI] [PubMed] [Google Scholar]
- 13.Tahira AC, Kubrusly MS, Faria MF, Dazzani B, Fonseca RS, Maracaja-Coutinho V, Verjovski-Almeida S, Machado MC, Reis EM. Long non-coding intronic RNAs are differentially expressed in primary and metastatic pancreatic cancer. Mol Cancer. 2011;10:141. doi: 10.1186/1476-4598-10-141. [DOI] [PMC free article] [PubMed] [Google Scholar]
- 14.Gupta RA, Shah N, Wang KC, Kim J, Horlings HM, Wong DJ, Tsai MC, Hung T, Argani P, Rinn JL, et al. Long non-coding RNA HOTAIR reprograms chromatin state to promote cancer metastasis. Nature. 2010;464:1071–1076. doi: 10.1038/nature08975. [DOI] [PMC free article] [PubMed] [Google Scholar]
- 15.McCleland ML, Mesh K, Lorenzana E, Chopra VS, Segal E, Watanabe C, Haley B, Mayba O, Yaylaoglu M, Gnad F, et al. CCAT1 is an enhancer-templated RNA that predicts BET sensitivity in colorectal cancer. J Clin Invest. 2016;126:639–652. doi: 10.1172/JCI83265. [DOI] [PMC free article] [PubMed] [Google Scholar]
- 16.Li LJ, Chai Y, Guo XJ, Chu SL, Zhang LS. The effects of the long non-coding RNA MALAT-1 regulated autophagy-related signaling pathway on chemotherapy resistance in diffuse large B-cell lymphoma. Biomed Pharmacother. 2017;89:939–948. doi: 10.1016/j.biopha.2017.02.011. [DOI] [PubMed] [Google Scholar]
- 17.Trimarchi T, Bilal E, Ntziachristos P, Fabbri G, Dalla-Favera R, Tsirigos A, Aifantis I. Genome-wide mapping and characterization of Notch-regulated long non-coding RNAs in acute leukemia. Cell. 2014;158:593–606. doi: 10.1016/j.cell.2014.05.049. [DOI] [PMC free article] [PubMed] [Google Scholar]
- 18.Doose G, Haake A, Bernhart SH, López C, Duggimpudi S, Wojciech F, Bergmann AK, Borkhardt A, Burkhardt B, Claviez A, et al. ICGC MMML-Seq Consortium: MINCR is a MYC-induced lncRNA able to modulate MYC's transcriptional network in Burkitt lymphoma cells. Proc Natl Acad Sci USA. 2015;112:E5261–E5270. doi: 10.1073/pnas.1505753112. [DOI] [PMC free article] [PubMed] [Google Scholar]
- 19.Sehgal L, Mathur R, Braun FK, Wise JF, Berkova Z, Neelapu S, Kwak LW, Samaniego F. FAS-antisense 1 lncRNA and production of soluble versus membrane Fas in B-cell lymphoma. Leukemia. 2014;28:2376–2387. doi: 10.1038/leu.2014.126. [DOI] [PMC free article] [PubMed] [Google Scholar]
- 20.Zhou M, Zhao H, Xu W, Bao S, Cheng L, Sun J. Discovery and validation of immune-associated long non-coding RNA biomarkers associated with clinically molecular subtype and prognosis in diffuse large B cell lymphoma. Mol Cancer. 2017;16:16. doi: 10.1186/s12943-017-0580-4. [DOI] [PMC free article] [PubMed] [Google Scholar]
- 21.Ciechanover A. Proteolysis: From the lysosome to ubiquitin and the proteasome. Nat Rev Mol Cell Biol. 2005;6:79–87. doi: 10.1038/nrm1552. [DOI] [PubMed] [Google Scholar]
- 22.Hochstrasser M. Ubiquitin, proteasomes, and the regulation of intracellular protein degradation. Curr Opin Cell Biol. 1995;7:215–223. doi: 10.1016/0955-0674(95)80031-X. [DOI] [PubMed] [Google Scholar]
- 23.Ciechanover A. The ubiquitin-proteasome proteolytic pathway. Cell. 1994;79:13–21. doi: 10.1016/0092-8674(94)90396-4. [DOI] [PubMed] [Google Scholar]
- 24.Ciechanover A. The ubiquitin-proteasome pathway: On protein death and cell life. EMBO J. 1998;17:7151–7160. doi: 10.1093/emboj/17.24.7151. [DOI] [PMC free article] [PubMed] [Google Scholar]
- 25.Chang JE, Peterson C, Choi S, Eickhoff JC, Kim K, Yang DT, Gilbert LA, Rogers ES, Werndli JE, Huie MS, et al. VcR-CVAD induction chemotherapy followed by maintenance rituximab in mantle cell lymphoma: A Wisconsin Oncology Network study. Br J Haematol. 2011;155:190–197. doi: 10.1111/j.1365-2141.2011.08820.x. [DOI] [PMC free article] [PubMed] [Google Scholar]
- 26.O'Connor OA. Marked clinical activity of the proteasome inhibitor bortezomib in patients with follicular and mantle-cell lymphoma. Clin Lymphoma Myeloma. 2005;6:191–199. doi: 10.3816/CLM.2005.n.046. [DOI] [PubMed] [Google Scholar]
- 27.Stegh AH. Targeting the p53 signaling pathway in cancer therapy - the promises, challenges and perils. Expert Opin Ther Targets. 2012;16:67–83. doi: 10.1517/14728222.2011.643299. [DOI] [PMC free article] [PubMed] [Google Scholar]
- 28.Sherr CJ. G1 phase progression: Cycling on cue. Cell. 1994;79:551–555. doi: 10.1016/0092-8674(94)90540-1. [DOI] [PubMed] [Google Scholar]
- 29.Zhang X, Lian Z, Padden C, Gerstein MB, Rozowsky J, Snyder M, Gingeras TR, Kapranov P, Weissman SM, Newburger PE. A myelopoiesis-associated regulatory intergenic non-coding RNA transcript within the human HOXA cluster. Blood. 2009;113:2526–2534. doi: 10.1182/blood-2008-06-162164. [DOI] [PMC free article] [PubMed] [Google Scholar]
- 30.Su X, Malouf GG, Chen Y, Zhang J, Yao H, Valero V, Weinstein JN, Spano JP, Meric-Bernstam F, Khayat D, et al. Comprehensive analysis of long non-coding RNAs in human breast cancer clinical subtypes. Oncotarget. 2014;5:9864–9876. doi: 10.18632/oncotarget.2454. [DOI] [PMC free article] [PubMed] [Google Scholar]
- 31.Zhou Y, Gong B, Jiang ZL, Zhong S, Liu XC, Dong K, Wu HS, Yang HJ, Zhu SK. Microarray expression profile analysis of long non-coding RNAs in pancreatic ductal adenocarcinoma. Int J Oncol. 2016;48:670–680. doi: 10.3892/ijo.2015.3292. [DOI] [PubMed] [Google Scholar]
- 32.Shao Y, Ye M, Jiang X, Sun W, Ding X, Liu Z, Ye G, Zhang X, Xiao B, Guo J. Gastric juice long non-coding RNA used as a tumor marker for screening gastric cancer. Cancer. 2014;120:3320–3328. doi: 10.1002/cncr.28882. [DOI] [PubMed] [Google Scholar]
- 33.Liu M, Xing LQ, Liu YJ. A three-long non-coding RNA signature as a diagnostic biomarker for differentiating between triple-negative and non-triple-negative breast cancers. Medicine. 2017;96:e6222. doi: 10.1097/MD.0000000000006222. [DOI] [PMC free article] [PubMed] [Google Scholar]
- 34.Ma KX, Wang HJ, Li XR, Li T, Su G, Yang P, Wu JW. Long non-coding RNA MALAT1 associates with the malignant status and poor prognosis in glioma. Tumour Biol. 2015;36:3355–3359. doi: 10.1007/s13277-014-2969-7. [DOI] [PubMed] [Google Scholar]


