

Abstract
A series of 48 N6-benzyladenosine 5'-uronamide derivatives has been described recently as moderately selective A3 adenosine receptor agonists of nanomolar potency (Gallo-Rodriguez, C. et al. J. Med. Chem. 1994, 37, 636). Quantitative structure activity relationships in this series, including some novel derivatives, have been investigated using a Comparative Molecular Field Analysis (CoMFA), with emphasis on the N6-substituent. The resulting three dimensional pharmacophore model defines the steric and electronic factors which modulate in vitro affinities in binding to rat brain A3 adenosine receptors. The model indicates a positive correlation of affinity with the steric characteristics of the compounds (major factor), particularly toward the 3-position of the benzyl ring of N6-benzyl NECA, and a weak correlation with the electrostatic effects of the N6-substituent. A comparison of active and inactive compounds using volume maps showed that bulk at the 3-position of the benzyl ring of the molecule is conducive to high affinity at A3 receptors, while steric bulk at other positions of the benzyl ring leads to poor binding. t-Boc-amino acid conjugates of a 3-aminobenzyl derivative were synthesized to probe the steric and hydrophobic limitations at that position. We have discovered a subregion of the N6-benzyl binding pocket occupied by a 3-(l-prolylamino) group that is sterically disallowed at A3 receptors and allowed in A1 and A2a receptors. 6-N-Phenylhydrazino and 6-O-phenylhydroxylamino derivatives, incorporating major changes in electrostatic character of the ligand proximal to the purine, were predicted by the CoMFA model to have high A3 affinity. Such analogs were synthesized and found to be well tolerated at the A3 receptor binding site.
Introduction
The structural requirements for purines as ligands at A1 and A2 adenosine receptors have been explored in detail.1–3 Recently, a novel rat A3 adenosine receptor subtype was discovered through the cloning of cDNA coding for sequences resembling G-protein-coupled receptors.4 The rat A3 receptor showed only 56% sequence homology with the rat A1 receptor, and was also distinct in pharmacological properties, e.g. the classical A1 and A2 antagonists such as alkylxanthines do not bind to rat A3 receptors. The three-dimensional structure of the rat A1 receptor was modeled5 by analogy to bacteriorhodopsin. Activation of A3 receptors has characteristic biological effects, such as enhancement of the release of inflammatory mediators from a rat mast cell line,6, 7 hypotension,8 and depression of locomotor activity.9 Chronic administration of an A3 agonist has a cerebro-protective effect in a stroke model in gerbils, thus there is considerable potential for development of therapeutic agents acting at this receptor.10 The activation of A3 receptors is also suggested to be at least partially responsible for the protective preconditioning of the ischemic heart by prior exposure to adenosine agonists.11
The structure–activity relationships (SAR) for adenosine and xanthine derivatives at rat A3 receptors have been reported.5, 12 Highly selective agonists have recently been synthesized.12, 13 The combination of N6-benzyl- and 5'-N-alkyluronamide modifications of adenosine favored increased A3 receptor binding affinity and selectivity versus A1 and A2a receptors.5 Optimization of substituents at the N6-benzyl position produced a highly potent A3 agonist, N6-(3-iodobenzyl)-adenosine-5'-N-methyluronamide (IB-MECA, Fig. 1), which is 50-fold selective in binding assays for rat A3 versus either A1 or A2a receptors.12 Further modification indicated that 2-substitution, such as chloro, methylamino or methylthio, in combination with the IB-MECA structure enhanced A3 selectivity.
Figure 1.

Comparative molecular field analysis (CoMFA)14, 15 is a promising technique for studying quantitative structure activity relationships (QSAR). Based on both physical and biological properties with a homologous series, CoMFA defines the relative contributions of three-dimensional steric and electrostatic fields towards the potency. Such an approach appeared to be suited to study the binding affinities of this series of A3-selective agonists (N6-benzyladenosine-5'-N-alkyluronamides), since numerous analogs close in structure and their Ki values in radioligand binding have been reported. In general, results of QSAR analysis for a specific set of compounds may lead to an understanding of the mechanism of molecular recognition, and ideally have predictive capabilities for the design of more selective agents. A quantitative structure–activity model of the A3 pharmacophore would aid in the design of more selective agonists and perhaps indicate a means of designing antagonists. In this study we use CoMFA to model various N6-benzyladenosine-5'-uronamides including some novel derivatives, with emphasis on the N6-substituent, since that is the site of most of the structural modifications reported. The binding data used in the CoMFA model were previously reported by our laboratory12 or determined in this study for newly synthesized adenosine derivatives.
Chemistry
The synthesis of compounds 12–53 in Tables 1 and 2 was reported previously.12 The synthesis of agonist analogs 5, 6, 7, 10, and 11 is shown in Schemes 1 and 2. The intermediate 2',3'-isopropylidene-6-chloropurine-5'-methyluronamide (1)12 was heated with 3-aminobenzylamine to yield compound 2. The aryl amino derivative 2 was then condensed with several t-butyloxycarbonyl (t-Boc) amino acids, e.g. t-Boc-l-proline or t-Boc-β-alanine, using l-(3-dimethylaminopropyl)-3-ethylcarbodiimide hydrochloride (EDAC) in the presence of 4-(N,N-dimethylamino)-pyridine and imidazole provided compounds 3 and 4, respectively. Following deprotection of both isopropylidene and t-Boc groups by treatment with acid, the corresponding amines, compounds 5 and 6, were obtained. Compound 6 was then acylated with di-tert-butyldicarbonate to give the t-Boc derivative 7.
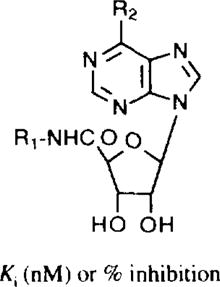
Table 1.
Affinities of 5'-uronamide derivatives in radioligand binding assays at rat brain A1, A2, and A3 receptorsa–c
| ||||
|---|---|---|---|---|
| Compound | R1 | R2 | pKi(A3)c | Predictedf pKi |
| 12d | H | NH2 | 5.85 | 5.92 |
| 13d | Me | NH2 | 7.14 | 7.31 |
| 14d | Et | NH2 | 6.95 | 7.02 |
| 15d |

|
NH2 | 5.80 | 5.92 |
| 16 | NH2 | 4.83 | 4.80 | |
| 17 | BocNHEt- | NH2 | 4.74 | 4.76 |
| 18 | Me | OHg | 5.21 | 5.34 (4.98)h |
| 19e | Et | OHg | 5.3 | 5.46 (5.13)h |
Displacement of specific [3H]PIA binding, unless noted, in rat brain membranes expressed as Ki ± SEM in nM (n = 3).
Displacement of specific [3H]CGS 21680 binding, unless noted, in rat striatal membranes, expressed as Ki ± SEM in nM (n = 3).
Displacement of specific binding of [125I]APNEA18 or [125I]4-amino-3-iodobenzyladenosine-5'-N-methyluronamide30 from membranes of CHO cells stably transfected with the rat A3-cDNA, expressed as Ki ± SEM in nM (n = 3–5).
Values at A1 and A2 receptors are taken from Bruns et al.31 Ki values at A1 receptors are versus specific binding of [3 H]N6-cyclohexyladenosine. Ki values at A2a receptors are versus specific binding of [3H]NECA in the presence of 50 nM CPA) in rat striatal membranes.
Values from van Galen et al.3
Predicted ‘within’ the model by cross-validation during derivation.
Modeled as hydroxy tautomers because of the similarity of OH to NH.
Predicted pKi for keto tautomer.
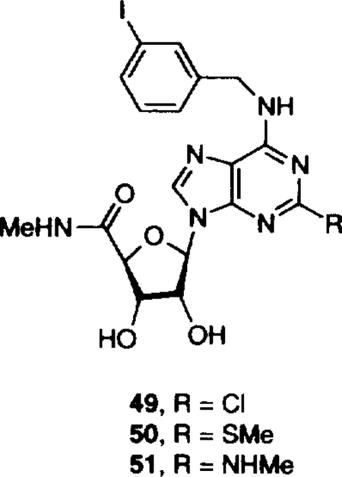
Table 2.
Affinities of N6-benzyladenosine 5'-uronamide derivatives in radioligand binding assays at rat brain A1, A2, and A3 receptorsa–c

| ||||
|---|---|---|---|---|
| Compound | R1 | R5 | pKi(A3)c | Predictedd pKi |
| 20 | H | H | 6.61 | 6.68 |
| 21 | Me | H | 7.80 | 7.91 |
| 22 | Me | 3-Cl | 7.66 | 7.88 |
| 23 | Me | 3-Br | 8.72 | 8.63 |
| 24 | Me | 3-I | 8.96 | 9.20 |
| 25 | Me | 3-NO2 | 7.72 | 7.80 |
| 26 | Me | 3-NH2 | 7.55 | 7.68 |
| 27 | Me | 3-NHCOCH3 | 7.38 | 7.52 |
| 28 | Me | 3-CH3 | 8.00 | 8.21 |
| 29 | Me | 3-CF3 | 7.51 | 7.58 |
| 30 | Me | 4-Cl | 7.77 | 7.80 |
| 31 | Me | 4-Br | 7.92 | 8.00 |
| 32 | Me | 4-NH2 | 7.85 | 7.83 |
| 33 | Me | 4-NH2-3-I | 8.91 | 8.30 |
| 34 | Et | H | 8.17 | 8.35 |
| 35 | Et | H(R-,R4=CH3) | 7.74 | 7.79 |
| 36 | Et | H(S-,R4=CH3) | 6.31 | 6.51 |
| 37 | Et | 3-F | 7.97 | 7.93 |
| 38 | Et | 3-Cl | 8.96 | 8.87 |
| 39 | Et | 3-Br | 8.55 | 8.35 |
| 40 | Et | 3-I | 9.05 | 8.88 |
| 41 | Et | 2-NO2 | 8.55 | 8.50 |
| 42 | Et | 3-NO2 | 8.06 | 8.30 |
| 43 | Et | 4-NO2 | 8.04 | 8.51 |
| 44 | Et | 3-CH3 | 8.92 | 8.45 |
| 45 | Et | 2-OMe | 8.15 | 8.20 |
| 46 | Et | 3-OMe | 8.37 | 8.40 |
| 47 | Et | 4-OMe | 7.96 | 7.82 |
| 48 | cyclopropyl | H | 6.99 | 7.00 |
| 49 | Me | I | 9.48 | 9.40 |
| X = Cl | ||||
| 50 | Me | I | 8.64 | 8.60 |
| X = SMe | ||||
| 51 | Me | I | 8.51 | 8.49 |
| X = NHMe | ||||
Displacement of specific [3H]PIA binding, unless noted, in rat brain membranes expressed as Ki ± SEM in nM (n = 3–6).
Displacement of specific [3H]CGS 21680 binding, unless noted, in rat striatal membranes, expressed as Ki ± SEM in nM (n = 3–6).
Displacement of specific binding of [125I]APNEA18 or [125I]4-amino-3-iodobenzyladenosine-5'-N-methyluronamide30 from membranes of CHO cells stably transfected with the rat A3-cDNA, expressed as Ki ± SEM in nM (n = 3–5).
Predicted ‘within’ the model by cross-validation during derivation.
Scheme 1.

Scheme 2.

To investigate the relative influence of electronic and steric factors as predicted by the CoMFA model (see below) the methylene group of the N6-benzyl substituent was modified with heteroatoms. Thus, N6-NH-O- and -NH-NH- analogs, 10 and 11, respectively, were synthesized (Scheme 2). The synthesis began with the displacement of the 6-chloropurine riboside derivative, compound 1, upon heating with phenylhydrazine to provide compound 8. Compound 8 was then deprotected under acidic conditions to provide the hydrazine derivative, compound 10. The corresponding reaction of 1 with O-phenylhydroxylamine was unsuccessful, but the desired product, compound 11, could be obtained by first deprotecting the isopropylidene group of 1 followed by displacement.
Receptor Binding
Newly synthesized adenosine analogs were tested in radioligand binding assays for affinity at rat brain A1, A2a and A3 adenosine receptors. A3 receptor affinity was measured in Chinese hamster ovary (CHO) cells, stably expressing cloned rat brain A3 receptors.4, 5 These cells were provided by Professor Gary Stiles and Dr Mark Olah of Duke University Medical Center. The radioligand used for binding to A3 receptors was [125I]AB-MECA (4-amino-3-iodobenzyladenosine-5'-N-methyluronamide).16 Affinity at A1 receptors was measured in rat cortical membranes using [3H]N6-R-phenylisopropyladenosine17 and at A2a, affinity in rat striatal membranes using [3H]CGS 21680, as reported.18
Computational Methods
Materials and approaches
CoMFA provides steric and electrostatic field representations of ligand molecules, field fitting to optimize mutual alignment within a series of molecules, cross-validation15 to indicate the predictive validity of the correlations, and graphic representation of the results. The molecular modeling and CoMFA studies were performed on a Silicon Graphics IRIS Indigo R4000XZ workstation running SYBYL 6.04.19 MOPAC (version 6.0)20 and AM1 parameter sets21, 22 were used for calculating partial atomic charges and full energy minimization of the ligands (keywords: PREC, GNORM = 0.1, MMOK, EF). CoMFA was used as a three-dimensional QSAR method to analyze the correlations between the measured binding affinities and the steric and electrostatic properties of the ligand molecules, as evaluated by a positive probe atom. Cross-validation evaluates a model by how well it predicts rather than fits the data, therefore cross-validation is an important criterion for CoMFA models. Partial least squares (PLS) regression analysis23 on the training set of 37 compounds (Tables 1 and 2) was carried out on a subset of steric and electrostatic energy having a standard deviation ≤1.0 kcal mol−1. The steric and electrostatic fields were subjected to scaling in order to assign them the same weight (the command ‘scaling CoMFA_std’ was used). Cross-validation procedure15 was carried out by dividing the training set into 10 randomly selected groups. The optimal number of latent variables was that of the cross-validation equation, with the lowest standard error and significance level estimated by means of the stepwise F-test to be ≥99.5%. Bootstrap analysis15 of the dataset provided a means by which statistical confidence limits could be placed on the results. Three-dimensional contour plots can be used to display the CoMFA results graphically and to generate ideas for designing novel agonists. After being subjected to field probing, the biological activities of these untested structures may then be quantitatively predicted, ideally within statistical confidence limits. The compound structures and biological activity data used to construct QSAR analyses reported herein are found in Tables 1 (5'-uronamide modifications) and 2 (N6-benzyl modifications).
Molecular models and the alignment rules
Attempts to obtain crystals of sufficiently good quality of N6-benzyladenosine 5'-uronamide derivatives, for X-ray purpose, were unsuccessful, therefore the Cambridge Structural Database (CSD) was searched for N6-(3- or 4-substituted benzyl)-adenosine derivatives. The crystal coordinates for N6-(4-nitrobenzyl)-2'-deoxyadenosine were retrieved from the CSD. This structure was modified to N6-(3-iodobenzyl)-5'-methyluronamide (IB-MECA, 24), hydrogen atoms were added, and it was fully geometry optimized using the standard TRIPOS molecular mechanics force field with a 0.001 kcal mol−1 energy gradient convergence criterion and a distance-dependent dielectric. Partial atomic charges were determined using MOPAC calculations.22
SYBYL and MOPAC were used to calculate the conformational properties of IB-MECA. The three bonds of purine-NH-CH2-Ph (Table 3) were searched at 30° increments using the systematic search option of SYBYL. This resulted in 658 possible conformers, which were fully energy minimized using the TRIPOS molecular mechanics force field. Eighty-one minimum energy conformers having energies in the range of −25.18 to −27.80 kcal mol−1 were found. Each of these conformers was then fully energy minimized using MOPAC. The above process led to four families of conformers: family A contained 37 conformers, family B contained six conformers, family C contains 28 conformers, and family D contained 10 conformers. The typical dihedral angle values defining the four families are reported in Table 3. In order to investigate conformational effects of 5'-N-alkyl carboxamido group on the N6-benzyl moiety, a conformational search of the carboxamido group of compound 40, from family A (Table 2), was performed. The three bonds C4'–C5'–N5'-C were searched at 30° increments using the systematic search option of SYBYL, which resulted in 105 conformers. Each of the resulting conformers was fully energy minimized using TRIPOS molecular mechanics force field. Since the contributions of modifications at N6- and 5'-substituted adenosine towards A3 potency were found empirically to be additive and not interdependent,5, 12, 13 the conformations of the N6-benzyl and 5'-carboxamido groups were treated independently in this study. Therefore, conformational properties of C5'-carboxamido groups could be fixed while studying details of the N6-benzyl group. In order to evaluate which of the above mentioned four families will produce a data set with the highest confidence limit (see discussion of the CoMFA r2 parameter below), one typical conformer was selected as a representative of each family. Each of these conformers was modified to the individual ligand structure (compounds 24–29,, 32, 33, 41, and 45) using the editing tools in SYBYL. Each structure was fully geometrically optimized using MOPAC, and the resulting partial atomic charges were used in the CoMFA calculations. Compounds 24–29, 32, 33, 41, and 45 were aligned to IB-MECA (24), a potent A3 receptor agonist, by field-fit minimization techniques, and four data sets were created for each conformer family. Since family A gave the highest confidence limit (Table 3), the CoMFA data set, containing all the ligands from Tables 1 and 2, was built based upon this conformation. It is noteworthy to mention that van Galen and co-workers24 proposed that the N6-substituted high-affinity ligands for adenosine receptors have a preferred N1–C6–N6-C2 torsion angle of −75°. Family A, from the conformational search, has a torsion angle of −75° for N1–C6–N6-C2 bonds. All fully geometry optimized structures, using MOPAC, had an envelope-like conformation at C2' and C3' position and showed a torsion angle of 69.8° for O4'–C1'–N9–C8 bond (9β-glycosyl bond).
Table 3.
Average dihedral angles and correlation coefficient of four IB-MECA conformer families

| ||
|---|---|---|
| Ψ2\Ψ1 (degrees) | +80 | +170 |
| +25 | Family D (~12%) | Family C (~35%) |
| (r2 = 0.19)a | (r2= 0.16)a | |
| −170 | Family A (~45%) | Family B (~8%) |
| (r2 = 0.42)a | (r2= 0.36)a | |
Ψ1 = C6 – N10 – C11 – C12
Ψ2 = C5 – C6 – N10 – C11
These non-cross-validated r2 values were measured on the test data sets of compounds 24–29, 32, 33, 41, and 45.
The positioning of a molecular model relative to a template within a fixed lattice is the most important variable in CoMFA, because interaction energies depend strongly on relative molecular positions. The field-fit procedure is one of the alignment rules which can be used to increase field similarity within a series of molecules.14 IB-MECA was chosen as the template molecule on which to align the various A3 receptor ligands and to test new structures. They were aligned via root mean square (rms) fit of their purine ring carbons to the corresponding carbons of the IB-MECA template molecule. The cross-validated and non-cross-validated PLS analyses on the training set of 37 compounds (Tables 1 and 3) based on this alignment scheme gave a CoMFA data set of less reliability in terms of r2. A second CoMFA data set, containing all the 37 ligands from Tables 1 and 3, was created by rms fit of the purine ring carbons to the corresponding carbons of the IB-MECA template molecule, followed by field-fit optimization of each ligand to the template molecule, in order to obtain maximal similarity between the steric and electrostatic fields of template and test molecules. Field-fit optimization forced the aligned molecules into initially high energy conformations which caused changes in the conformation and energy of the ligands compared to the original MOPAC-minimized conformations of the ligands. Therefore, subsequent molecular mechanics re-minimization without the field-fit option allowed the fitted molecules to relax to the nearest local minimum energy structure. This alignment scheme was chosen for CoMFA calculations because it provided the most direct comparison of substituent effects and yielded the most predictive model.
CoMFA: interaction energy calculations and regression techniques
In CoMFA the single molecule under inspection is presented in a grid box, in which user-defined atoms rest at the grid points interacting with the proximal structure. The physical chemistry of these interaction processes is described by an approximation in terms of classical mechanics. In our model, the steric field, defined in terms of the van der Waals (Lennard–Jones 6–12) interactions, and the electrostatic field (based on a Coulombic term having a 1/r distance-dependent dielectric) were calculated using an sp3 carbon probe atom (with a charge of +1 and a van der Waals radius of 1.52 Å) on a regularly-spaced three-dimensional lattice. The dimensions of CoMFA lattice were determined through an automatic procedure, featured by the SYBYL/CoMFA routine, which extends the lattice walls beyond the dimensions of each structure by 4.0 Å in all directions. The lattice spacing was set to a value of 2.0 Å. This automatically generated lattice contained 720 points. The steric and electrostatic energy values were truncated to 30 kcal mol−1; the electrostatic ones were not dropped in correspondence of lattice points inside the union volume of the superimposed ligands.
Initial PLS analyses were performed in conjunction with the cross-validation (leave-one-out method) option to obtain the optimal number of components to be used in the subsequent analyses of the dataset. The PLS analysis was repeated with the number of cross-validation groups set to zero. The optimal number of components was designated as that which yielded the highest cross-validated r2 values in the non-cross-validated (conventional) analyses. The final PLS analysis with 10 bootstrap groups and the optimal number of components was performed on the dataset.
After the optimal dimensionality of each model was established, by PLS analysis and cross-validation procedure, the corresponding calibration equation (resulting from the simultaneous contribution of all the observations) was derived. The calibration equation with latent variables was then converted to the original parametric space represented by probe-ligand interaction energies; a 3-D-QSAR was therefore derived whose coefficients were associated with statistically significant lattice locations. CoMFA coefficient contour maps were generated by interpolation of the pairwise products between the 3-D-QSAR coefficients and the standard deviations of the associated energy variables. The derived 3-D-QSAR calibration model was successively employed to forecast the binding affinity values of the five compounds listed in Table 4.
Table 4.
Affinities of the new N6-benzyladenosine 5'-uronamide derivatives in radioligand binding assays at rat brain A1, A2a, and A3 receptorsa–c

| |||||||
|---|---|---|---|---|---|---|---|
| compd | R | pKi(A3)c | Ki(A1)a | Ki(A2a)b | Predicted pKi(A3)d |
A1/A3 | A2/A3 |
| 5 | l-prolyl-NH | 4.93 | 170 ± 30 | 215 ± 54 | 8.11 | 0.014 | 0.018 |
| 6 | β-alanyl-NH | 7.64 | 101 ± 9 | 144 ± 40 | 7.56 | 45 | 63 |
| 7 | t-Boc-β-alanyl-NH | 7.33 | 4500 ± 1050 | 1960 ± 410 | 7.41 | 96 | 42 |
| 10 | R = H, X = NH | 6.65 | 3940 ± 240 | 7160 ± 80 | 6.86 | 18 | 31 |
| 11 | R = H, X = O | 5.87 | 2060 ± 370 | 66300 ± 16200 | 5.86 | 50 | 2 |
Displacement of specific [3H]PIA binding, unless noted, in rat brain membranes expressed as Ki ± SEM in nM (n = 3).
Displacement of specific [3H]CGS 21680 binding, unless noted, in rat striatal membranes, expressed as Ki ± SEM in nM (n = 3).
Displacement of specific binding of (125I]APNEA18 or [125I]4-amino-3-iodobenzyladenosine-5'-N-methyluronamide30 from membranes of CHO cells stably transfected with the rat A3-cDNA, expressed as Ki ± SEM in nM (n = 3–5). The Ki(A3) for 5 = 11,800 ± 1400, 6 = 22.7 ± 8.2, 7 = 46.7 ± 15.1, 10 = 225 ± 29, 11 = 1340 ± 230.
Predicted by the model without being included in the trial dataset.
‘Predictive’ r2 values
The ‘predictive’ r2 was based only on molecules not included in the training set and is defined as explained by Marshall and coworkers.25
Results
CoMFA of A3 receptor binding affinity
Structural changes in a series of ligands sometimes may cause also electronic changes of substituents which are supposed to be invariant in the series. In organic chemistry this effect is termed ‘reversion of polarity’. For these cases one needs a higher level of electronic description, e.g. charge calculation or estimation of electron density by at least semiempirical methods. In our CoMFA training set the important structural transition is substituent variation in the aromatic moiety at the N6-position. Therefore, partial atomic charges were calculated by AM1 parameter sets. The results of the CoMFA are summarized in Table 5. The partial least square (PLS) algorithm was used in conjunction with the cross-validation option to obtain the optimal number of components to be used in the subsequent analyses of the datatable. The PLS analysis based on field-fit alignment gave a correlation with a cross-validated r2 of 0.631 with the maximum number of components set equal to five (maximum number of components set equal to 3, 6, 7 or 8 gave unreliable cross-validated r2; r2 ≥ 0.40) and the cross-validation groups set equal to the number of observations (rows) in the data table. The non-cross-validated analysis was repeated with the optimum number of components, as determined by the cross-validated analysis, to give an r2 of 0.798. In order to obtain statistical confidence limits, the non-cross-validation analysis was repeated with 10 bootstrap groups, which yielded an r2 = 0.897 (optimum number of components was 5), sep = 0.556, s = 0.146, Ftest = 64.538, p = 0.000, steric contribution = 0.847 and electrostatic contributions = 0.153. These parameters are explained in Table 5.
Table 5.
CoMFA QSAR results of A3 ligands
| Alignment Rule | r2 cross b | r2 | sep c | F test d | p value | r2 bs e | Steric contribution |
Electrostatic contribution |
Std Dev. f |
|---|---|---|---|---|---|---|---|---|---|
| rms Multifit | 0.40 | 0.746 (5)a | 0.684 | 41.132 | 0.000 | 0.802 | 0.924 | 0.076 | 0.036 |
| Field-Fit | 0.631 | 0.798 (5)a | 0.556 | 64.538 | 0.000 | 0.897 | 0.847 | 0.153 | 0.017 |
Numbers in parentheses are optimal number of components.
Cross-validated R squared after leave-one-out procedure: r2CV = (SD − PRESS)/SD, SD = Yactual − Ymean)2.
PRESS = Σ(Ypredicted − Yactual). For further explaination of these mathematical formulas see reference 14.
Standard error of prediction (cross-validated) = (PRESS/(n − c − l))1/2, n = number of rows, c = number of components.
Ratio of r2 explained to unexplained = r2/(l−r2).
r2 bs = r2 after bootstrapping.
Std Dev. column belongs with the bootstrapped r2.
The CoMFA-derived QSAR of the A3 ligands exhibited a strong cross-validated correlation, indicating that it was highly predictive. Cross-validation provides information concerning the predictive ability of the QSAR dataset by minimizing the occurrence of chance correlations in the QSAR model. A small difference between cross-validated and non-cross-validated r2 values is indicative of reliable correlations in the QSAR dataset. The relatively small difference between cross-validated and conventional r2 values here indicated only a minor influence of spurious correlations in the datatable. The bootstrapped r2 value was very high with a small standard deviation, thus indicating a high degree of confidence in the analysis. The predicted binding affinities obtained from the analysis are plotted versus the actual values in Figure 2.
Figure 2.

Predicted pKi versus actual pKi.
The CoMFA steric and electrostatic fields for the analysis are presented as three-dimensional color-coded contour plots in Figures 3 and 4. In Figure 3 the green polyhedra represent areas in space around the molecules where steric bulk correlates with increased binding affinity. The field values are calculated as the scalar product of the β-coefficient and the standard deviation associated with a particular column in the QSAR table (stdev*coeff). The values corresponding to steric columns are plotted as the percentage of contribution to the QSAR equation. It is necessary to point out that the 3 and 5 positions of N6-benzyl group were mixed during the alignments for different compounds to test if steric hindrance can be tolerated at both positions. Of particular interest are the green polyhedra around the 3-position (equivalent to 5-position) of the N6-benzyl substituent, the yellow polyhedron around the 4-position of the N6-benzyl substituent, and the N6-CH2- group. The blue polyhedra around the N6-CH2- group suggest a tolerance for the positive charge. Our previous SAR studies indicated that some substitution at the 3-position of the N6-benzyl group increased the binding affinity of the agonists, while substitution at the 4-position of N6-benzyl and N6-CH2-groups reduced the binding affinity.26 Clearly, the phenylhydrazine derivative 10 (Table 4), which would increase the positive charge in that region, by the possible protonation of nitrogen atoms, showed a selectivity for A3 versus A2a receptors comparable to that of the carbon analog, N6-benzyladenosine-5'-methyluronamide (21). It is interesting to note that in Figure 4 the area of disfavored positive charge (90% contribution) at the 3-position, designated by blue polyhedra, overlaps the area previously defined as being tolerant to increases in steric bulk (Fig. 3). This indicates that this area of the binding site may show a preference for bulky electronegative group, such as the iodo group of the potent A3 adenosine receptor agonist IB-MECA, 24. We were interested to explore further tolerance for hydrophobic interactions at the 3-position of the N6-benzyl moiety. Therefore, we synthesized the t-Boc-alanyl conjugate, (7), and the A3 binding affinity of 7 (Ki = 47 nM) suggested that a bulky hydrophobic group is tolerated at this position. The newly synthesized molecules 5–7 extended 3.38 Å in the space occupied by the derived model. The fact that four out of five new molecules were well predicted offers information on predictability of our CoMFA model.
Figure 3.

The CoMFA steric stdev*coeff contour plot from the analysis based on field-fit alignment. Sterically favored areas (contribution level of 80%) are represented by green polyhedra. Sterically disfavored areas (contribution level 20%) are represented by yellow polyhedra.
Figure 4.

The CoMFA electrostatic stdev*coeff contour plot from the analysis based on field-fit alignment. Positive charges disfavored areas (contribution level 90%) are represented by blue polyhedra. Positive charge favored areas (contribution level 10%) are represented by red polyhedra.
The contour plot for positive steric contribution (green) shown in Figure 3 emphasizes the importance of a proper substitution on the N6-benzyl group of 5'-uronamide derivatives for maximizing receptor binding, whereas the contour plot of negative steric contribution (Fig. 3) emphasizes the importance of sterically unfavored substitutions in binding affinity. These plots, indicating the importance (or lack thereof) of substitutions, such as iodide which enhances affinity, in various positions on an adenosine N6-benzyl moiety using a simple plus/minus notation, are qualitatively similar to a previous representation of HIV-inhibitors by Safe.27 The appropriateness of the alignment used is supported by the success achieved with the QSAR for the binding data for the β-alanyl conjugates, compounds 6 and 7. It should be pointed out that CoMFA contour maps are not directly comparable to receptor maps. In fact, the major contribution of electronegative substituents at the 3-position of the N6-benzyl ring may not be steric but more a reflection of the importance of substitution pattern on overall stereoelectronic structure.
The binding affinities of the compounds 5–7 were predicted by CoMFA-derived QSARs. The predicted binding affinities of these ligands (5 and 6) were comparable to the binding affinity of 26. The binding affinities of these test molecules are reported in the Table 4. The predicted binding affinity of 7 was comparable to 27. Compound 6 showed a Ki (nM) of 23, and a Ki (nM) of 47 for 7 was obtained. Comparison of actual binding affinity of 6 and 7 suggests a tolerance for bulky long chain groups near the 3-position of the N6-benzyl moiety. Thus, this position is suitable for derivatization by the functionalized congener approach.28 The fact that compound 7 has a binding affinity similar to 27 supports the useful predictive ability of this QSAR analysis for quantifying the binding site environment of the A3 receptor. It should be pointed out that CoMFA predicted a considerably lower binding affinity for the ligands having bulky groups at the 5'-uronamide position. Consistently, compound 17, which also contains a Boc-NH(CH2)2 group, was almost inactive at A1, A2a and A3 receptors.
On examining the predicted values (Table 4), the QSAR appears to significantly overestimate the binding affinity of the l-prolyl-substituted ligand, 5. This suggests that a conformationally rigid bulky group causes energetically unfavorable interactions in the vicinity of the benzyl-3-position in the A3 binding site. However, the long-chain flexible groups, such as the β-alanyl moieties, which can adjust within the binding site, are tolerated. Curiously, the rat A1 and A2a receptors did not display such strict spatial requirements in this region. The Ki values of the prolyl conjugate 5 at these receptors were in the 100–200 nM range. Thus, this represents a major difference in the agonist binding sites of the adenosine receptor subtypes. Identification of the amino acid residues responsible for this steric restriction in the A3 receptor will be the subject of further studies involving both receptor molecular modeling5 and site-directed mutagenesis. It is to be noted that affinities of various ligands for A3 receptors are highly species dependent, i.e. certain xanthines bind with greater affinity at sheep26 and human29 versus rat receptors,4, 5 thus the present model may be subject to modification when generalizing to other A3 receptor clones.
Conclusion
The CoMFA method has proven to be a useful and viable means of correlating the properties of adenosine receptor ligands with biological activity, without knowing the structure of the receptor molecule. In this particular instance, the steric CoMFA map suggests that effects of bulk play a major role on binding affinity, while the electrostatic effects play a lesser role in affecting the binding affinity of the ligands. The CoMFA study has clearly shown that substituents on the 3-position of the benzyl ring affect binding affinity and selectivity for A3 receptors by virtue of the extent of their bulkiness. We have previously shown that some bulk around the 3-position of the N6-benzyl moiety is tolerated and desirable, but our study indicates that flexible bulky groups, which can adjust inside the binding pocket, are also tolerated. Comparison of the binding affinity data of IB-MECA, 24, and compound 7 with other ligands indicates that the binding of this class of compounds is due to hydrophobic interactions and, in addition, demonstrates the lack of an electrostatic effect. However, the A3 affinity of ligand 7 indicates that there is a tolerance in the binding site for a sterically bulky group at the 3-position, although a less bulky hydrophobic group (e.g. iodo) is preferred.
We do not have an explanation for why the prolyl-conjugate (5), binding affinity is not precisely predicted by CoMFA. In interpreting results of the CoMFA analysis one must be aware of the inherent limitation that the method assumes a static receptor conformation for all ligands. Considering that possible conformational changes may occur at the binding site during ligand binding and receptor activation, the relative contributions of charge and steric interactions may not be identical for all compounds.
We performed CoMFA of compounds 49–5113 in a separate CoMFA training dataset (Table 2). The results suggested tolerance for steric groups at 2-position of purine ring. Thus, 2-substitution A3 affinity-enhancing effects depend upon optimal groups at the 5'-position (5'-N-methyl carboxamido group) and 3-iodobenzyl group at the N6-position. Discussion of these results will be the subject of a future publication.
The CoMFA studies which we have described support the conclusion that the binding of N6-benzyladenosine-5'-uronamide derivatives is largely influenced by steric interactions of the N6-benzyl group of adenosine-5'-uronamides.
In conclusion, we have derived a working model of the A3 adenosine receptor agonist pharmacophore using three-dimensional QSAR (CoMFA). Our model indicated that the N6-atom of the purine and the CH2 group of benzyl moieties can be replaced by oxygen and nitrogen, respectively, without significant loss of selectivity versus A1 and A2a receptors. Our model further suggests that bulky groups at the 3-position N6-benzyl group and 2-position of purine ring (49–51) are necessary for A3 adenosine receptor affinity. More importantly, the 3-D-QSAR model has predicted the pKi values of five newly synthesized compounds (Table 4) with an accuracy comparable to that obtained by applying the cross-validation procedure in a training set of 37 analogs.
Experimental
New compounds were characterized (and resonance assigned) by 300 MHz proton nuclear magnetic resonance spectroscopy using a GEMINI-300 FT-NMR spectrometer. Unless noted, chemical shifts are expressed as ppm downfield from tetramethylsilane. Synthetic intermediates were characterized by chemical ionization mass spectrometry (NH3) and adenosine derivatives by fast atom bombardment mass spectrometry (positive ions in a noba or m-bullet matrix) on a JEOL SX102 mass spectrometer. In the EI mode accurate mass was determined using a VG7070F mass spectrometer. C, H, and N analyses were carried out by Atlantic Microlabs (Norcross, GA), and ±0.4% was acceptable. All adenosine derivatives were judged to be homogenous using thin-layer chromatography (silica, 0.25 mm, glass backed, Alltech Assoc., Deerfield, IL, U.S.A.) following final purification.
N6-[3-(l-Prolylamino)benzyl]adenosine-5'-N-methyluronamide (5)
2',3'-O-Isopropylidene-N6-(3-aminobenzyl)-adenosine-5'-N-methyluronamide (2,12 20 mg, 45.51 µmol), N-t-Boc-L-proline (12 mg, 55.76 µmol), N,N'-dicyclohexylcarbodiimide (18.77 mg, 90.98 µmol) and imidazole (6.2 mg, 91.07 µmol) were dissolved in anhydrous DMF. The solution was stirred at room temperature for 20 h in a sealed vessel. The solvent was evaporated by means of rotary evaporator and high vacuum. The residue was dissolved in HCl (1 M, 0.5 mL), and the resulting solution was heated to 60 °C for 40 min. After cooling in an ice bath, sodium bicarbonate solution was added to neutralize and the solvent was removed under vacuum. The residue was subjected to prep. silica gel thin layer chromatography (MeOH:CH2Cl2, 8:2) to give 5 as a white solid (14.2 mg, 63% yield overall). 1H NMR (DMSO-d6): δ 2.32 (m, 2H, CH2), 2.70 (d, J = 4.6 Hz, 3H, CH3), 2.73 (m, 2H, CH2), 3.79 (m, 2H, CH2-N), 4.2 (m, 1H, H-3'), 4.30 (s, 1H, H-4'), 4.60 (m, 2H, H-2'), 4.67 (br s, 2H, N6-CH2Ph), 5.54 (d, J = 6.4 Hz, 1H, OH-2'), 5.70 (d, J = 4.1 Hz, 1H, OH-3'), 5.97 (d, J = 7.6 Hz, 1H, H-1'), 7.2 (t, J = 7.7, 1H), 7.40 (d, J = 7.7 Hz, 1H), 7.60 (d, J = 7.8, 1H), 7.71 (br s, 1H, NH-CH2), 7.72 (s, 1H), 8.28 (2, 1H, H-2), 8.50 (s, 2H, H-8), 8.56 (br s, 1H, N6H-CH2Ph), 8.80 (br s, 1H, NHMe) (8.90 (br s, 1H, NH-Ph). High resolution MS (m/z) measured in FAB+ mode: Calcd for C23H28N8O5 496.5302, found 496.5306. Calcd for C23H28N8O5·H2O. Found C, H, N.
N6-[3-(β-Alanylamino)benzyl]adenosine-5'-methyluronamide (6)
2',3'-O-Isopropylidene-N6-(3-aminobenzyl)-adenosine-5'-N-methyluronamide (2,12 40 mg, 91.02 µmol), N-t-Boc-β-alanine (24 mg, 127.42 µmol), EDAC (30 mg, 156.49 µmol), imidazole (12.4 mg, 182.03 µmol) and 4-dimethylaminopyridine (23 mg, 188.21 µmol) were dissolved in anhydrous DMF. The solution was stirred at room temperature for 24 h under nitrogen. The solvent was removed in vacuo, and the residue dissolved in HCl (1 N, 1 mL). The resulting mixture was heated to 60 °C for 40 min. After cooling in an ice bath, cone NH4OH was added to neutralize. The reaction mixture was loaded on a small Dowex 50X2-200 (H+) resin column. The column was eluted with H2O until eluents were neutral to pH paper. Finally the column was eluted with 1 N NH4OH, and the product-containing fractions were lyophilized to give 6 as a yellow solid (29.2 mg, 68% overall yield). 1H NMR (DMSO-d6): δ 2.63 (m, 2H, CH2), 2.70 (d, J = 4.3 Hz, 3H, CH3), 2.75 (m, 2H, CH2), 4.14 (m, 1H, H-3'), 4.32 (s, 1H, H-4'), 4.59 (dd, J = 4.6 Hz, J = 7.5 Hz, 1H, H-2')), 4.71 (br s, 2H, N6-CH2PH), 5.55 (d, J = 6.4 Hz, 1H, OH-2'), 5.68 (d, J = 4.1 Hz, 1H, OH-3'), 5.95 (d, J = 7.4 Hz, 1H, H-1'), 7.10 (t, J = 7.7 Hz, 1H), 7.35 (d, J = 7.7 Hz, 1H), 7.58 (d, J = 7.8, 1H), 7.72 (s, 1H), 8.30 (s, 1H, H-1), 8.44 (s, 1H, H-8), 8.56 (br s, 1H, N6H-CH2PH), 8.80–8.89 (m, 2H, NH-Me and NH-Ph). High resolution MS (m/z) measured in FAB+ mode: Calcd for C21H26N8O5 470.4919, found 470.4921. Calcd for C21H26N8O5·H2O Found C, H, N.
N6-[3-(N-t-Boc-β-alanylamino)benzyl]adenosine-5'-methyluronamide (7)
A solution of compound 6 (10 mg, 21.25 µmol), di-tert-butyldicarbonate (5.5 mg, 25.2 µmol) and triethylamine (20 µL) in anhydrous DMF (0.5 mL) were stirred at room temperature under nitrogen. The solvent was removed in vacuo and the residue was purified by prep. silica gel TLC (eluent CH2Cl2:MeOH, 9:1) to give 7 as white solid (9.7 mg, 80% yield overall). 1H NMR (DMSO-d6): δ 1.38 (s, 9H, CH3), 2.71 (m, 2H, CH2), 3.26 (m, 2H, CH2), 3.31 (d, J = 4.3 Hz, 3H, CH3), 4.12 (m, 1H, H-3'), 4.33 (s, 1H, H-4'), 4.60 (dd, J = 4.6 Hz, J = 7.5 Hz, 1H, H-2'), 4.70 (br s, 2H, N6-CH2PH), 5.53 (d, J = 6.4 Hz, 1H, OH-2'), 5.71 (d, J = 4.1 Hz, 1H, OH-3'), 5.60 (d, J = 7.4 Hz, 1H, H-1'), 7.13 (t, J = 7.7 Hz, 1H), 7.40 (d, J = 7.7 Hz, 1H), 7.60 (d, J = 7.8, 1H), 7.71 (s, 1H), 8.28 (s, 1H, H-l), 8.42 (s, 1H, H-8), 8.56 (br s, 1H, N6H-CH2PH), 8.55 (br s, 1H, NH-Me), 8.90 (br s, 1H, NH-Ph), 9.80 (br s, 1H, CH2NN-CO). High resolution MS (m/z) measured in FAB+ mode: Calcd for C26H34N8O7 570.6103, found 570.6106. Calcd for C26H34N8O7·H2O. Found C, H, N.
6-(N'-Phenylhydrazinyl)purine-9-β-ribofuranoside-5'-N-methyluronamide (10)
2',3'-Isopropylidene-6-chloropurine-9-β-ribofuranoside-5'-N-methyluronamide (112, 30 mg, 85.04 µmol), phenylhydrazine (10 mg, 92.5 µmol), and triethylamine (23.7 µL, 0.70 mmol) were dissolved in absolute EtOH (1 mL). The solution was stirred at 70 °C for 16 h under nitrogen. The solvent was evaporated under a stream of nitrogen, and HCl (1 N, 1 mL) was added, and the resulting solution was heated to 60 °C for 40 min. After cooling in an ice bath, sodium bicarbonate solution was added to neutralize. Volatiles were removed in vacuo and the residue was purified by prep. silica gel TLC (eluent CH2Cl2:MeOH, 8:2) to obtain 18 mg (55%) of the title compound. 1H NMR (DMSO-d6): δ 3.29 (d, J = 4.3 Hz, 3H, CH3), 4.20 (m, 1H, H-3'), 4.35 (s, 1H, H-4'), 4.60 (dd, J = 4.6 Hz, J = 7.5 Hz, 1H, H-2'), 5.50 (d, J = 6.4 Hz, 1H, OH-2'), 5.68 (d, J = 4.1 Hz, 1H, OH-3'), 5.66 (d, J = 7.4 Hz, 1H, H-1'), 6.93 (m, 3H, Ph), 7.31 (m, 2H, Ph), 8.29 (s, 1H, H-l), 8.43 (s, 1H, H-8), 8.56 (br s, 2H, NH-NH), 8.55 (br s, 1H, NH-Me). High resolution MS (m/z) measured in FAB+ mode: Calcd for C17H19N7O4 385.3855, found 385.38550. Calcd for C17H19N7O4. Found C, H, N.
6-(O-Phenylhydroxylamino)purine-9-β-ribofuranoside-5'-N-methyluronamide (11)
2',3'-O-Isoproylidene-6-chloropurine-9-β-ribofuranoside-5'-N-methyluronamide (1,12 30 mg, 85.04 µmol), and Dowex 30X2-200 (H+ resin, 2 mL, dry volume) in H2O (3 mL) were heated at 80 °C for 1 h. The reaction mixture was made slightly basic by adding cone NH4OH, filtered and filtrates evaporated to dryness. The residue was co-evaporated a few times with absolute EtOH. Thereafter, O-phenylhydroxylamine hydrochloride (18 mg, 124.2 µmol) and triethylamine (23.7 µL, 0.70 mmol) were added and the resulting mixture heated at 65 °C for 24 h. The solvent was removed under a stream of nitrogen and the residue was purified by TLC (eluent CH2Cl2:MeOH, 8:2) to obtain 17 mg (52%) of the title compound. 1H NMR (DMSO-d6): δ 3.26 (d, J = 4.3 Hz, 3H, CH3), 4.22 (m, 1H, H-3'), 4.31 (s, 1H, H-4'), 4.62 (dd, J = 4.6 Hz, J = 7.5 Hz, 1H, H-2'), 5.53 (d, J = 6.4 Hz, 1H, OH-2'), 5.70 (d, J = 4.1 Hz, 1H, OH-3'), 5.70 (d, J = 7.4 Hz, 1H, H-1'), 6.90 (m, 3H, Ph), 7.30 (m, 2H, Ph), 8.30 (s, 1H, H-l), 8.41 (s, 1H, H-8), 8.56 (br s, 1H, NH-O), 8.55 (br s, 1H, NH-Me). High resolution MS (m/z) measured in FAB+ mode: Calcd for C17H18N6O5 386.3702, found 386.3705. Calcd for C17H18N6O5. Found C, H, N.
Cell culture and radioligand binding
CHO cells stably expressing the A3 receptor5, 16 were grown in F-12 medium containing 10% FBS and penicillin/streptomycin (100 U mL−1 and 100 µg mL−1 respectively) at 37 °C in a 5% CO2 atmosphere, and membrane homogenates were prepared as reported.16
Binding of [125I]4-amino-3-iodobenzyladenosine-5'-N-methyluronamide ([125I]AB-MECA) to the CHO cells membranes was performed essentially as described.12, 16 Assays were performed in 50:10:1 buffer in glass tubes and contained 100 µL of the membrane suspension, 50 µL [125I]AB-MECA (final concentration 0.3 nM) and 50 µL inhibitor. Inhibitors were routinely dissolved in DMSO and were then diluted with buffer; final DMSO concentrations never exceeded 1%. Incubations were carried out in duplicate for 1 h at 37 °C, and were terminated by rapid filtration over Whatman GF/B filters, using a Brandell cell harvester (Brandell, Gaithersburg, MD, U.S.A.). Tubes were washed three times with 3 mL of buffer. Radioactivity was determined in a Beckman gamma 5500B γ-counter. Non-specific binding was determined in the presence of 40 µM R-PIA. Ki-values were calculated according to Cheng-Prusoff,30 assuming a Kd for [125I]AB-MECA of 1.55 nM.16
Binding of [3H]PIA to A1 receptors from rat brain membranes and of [3H]CGS 21680 to A2 receptors from rat striatal membranes was performed as described previously.17, 18 Adenosine deaminase (3 U mL−1) was present during the preparation of brain membranes, in which an incubation at 30 °C for 30 min is carried out, and during the incubation with radioligand. At least six different concentrations spanning three orders of magnitude, adjusted appropriately for the IC50 of each compound, were used. IC50 values, computer-generated using a non-linear regression formula on the InPlot program (GraphPAD, San Diego, CA, U.S.A.), were converted to apparent Ki values using Kd values of 1.0 and 14 nM for [3H]PIA and [3H]CGS 21680 binding, respectively, and the Cheng-Prusoff equation.30
Acknowledgments
The authors would like to thank Dr X.-D. Ji and Dr N. Melman for carrying out receptor binding assays, and Dr Gary L. Stiles and Dr Mark E. Olah (Duke University) for preparing the radioligand [125I]AB-MECA. We would like to extend our appreciation to Dr A. M. van Rhee (NIDDK/NIH) and Dr Scott A. DePriest (Tripos, Inc.) for many valuable suggestions.
Abbreviations
- [125I]AB-MECA
N6-(4-amino-3-iodobenzyl)-adenosine-5'-N-methyluronamide
- Boc
tert-butyloxycarbonyl
- CGS 21680
2-[4-[(2-carboxyethyl)phenyl]-ethyl-amino]-5'-N-ethylcarboxamidoadenosine
- CoMFA
comparative molecular field analysis
- DMF
N,N-dimethylformamide
- DMSO
dimethylsulfoxide
- EDAC
1-(3-dimethylaminopropyl)-3-ethylcarbodiimide hydrochloride
- IB-MECA
N6-(3-iodobenzyl)adenosine-5'-N-methyluronamide
- NECA
5'-N-ethylcarboxamidoadenosine
- PIA
R-N6-phenylisopropyladenosine
- PLS
partial least squares
- QSAR
quantitative structure activity relationship
- rms
root mean square
- Tris
tris(hydroxymethyl)aminomethane
Footnotes
Supplementary Material Available
Coordinates of template compound 24 (IB-MECA) are available (5 pages) from the authors.
References and Notes
- 1.Jacobson KA, van Galen PJM, Williams M. J. Med. Chem. 1992;35:407. doi: 10.1021/jm00081a001. [DOI] [PMC free article] [PubMed] [Google Scholar]
- 2.Stiles GL. J. Biol. Chem. 1992;267:6451. [PubMed] [Google Scholar]
- 3.van Galen PJN, Stiles GL, Michaels G, Jacobson KA. Med. Res. Rec. 1992;12:423. doi: 10.1002/med.2610120502. [DOI] [PMC free article] [PubMed] [Google Scholar]
- 4.Zhou QY, Li CY, Olah ME, Johnson RA, Stiles GL, Civelli O. Proc. Natl. Acad. Sci. U.S.A. 1992;89:7432. doi: 10.1073/pnas.89.16.7432. [DOI] [PMC free article] [PubMed] [Google Scholar]
- 5.van Galen PJM, van Bergen AH, Gallo-Rodriguez C, Melman N, Olah ME, IJzerman AP, Stiles GL, Jacobson KA. Mol. Pharmacol. 1994;45:1101. [PMC free article] [PubMed] [Google Scholar]
- 6.Ramkumar V, Stiles GL, Beaven MA, Ali H. J. Biol. Chem. 1993;268:6887. [PubMed] [Google Scholar]
- 7.Ali H, Cunha-Melo JR, Saul WF, Beavan MF. J. Biol. Chem. 1990;265:745. [PubMed] [Google Scholar]
- 8.Fozard JR, Carruthers AM. Br. J. Pharmacol. 1993;109:3. doi: 10.1111/j.1476-5381.1993.tb13630.x. [DOI] [PMC free article] [PubMed] [Google Scholar]
- 9.Jacobson KA, Nikodijević O, Shi D, Gallo-Rodriguez C, Olah ME, Stiles GL, Daly JW. FEB Letters. 1993;336:57. doi: 10.1016/0014-5793(93)81608-3. [DOI] [PMC free article] [PubMed] [Google Scholar]
- 10.von Lubitz DKJE, Lin RC-S, Popik P, Carter MF, Jacobson KA. Eur. J. Pharmacol. 1994;263:59. doi: 10.1016/0014-2999(94)90523-1. [DOI] [PMC free article] [PubMed] [Google Scholar]
- 11.Liu GS, Richards SC, Olsson RA, Mullane K, Walsh RS, Downey JM. Cardiovasc. Res. 1994;28:1057. doi: 10.1093/cvr/28.7.1057. [DOI] [PubMed] [Google Scholar]
- 12.Gallo-Rodriguez C, Ji X-D, Melman N, Siegman BD, Sanders LH, Orlina J, Pu Q-L, Olah ME, van Galen PJM, Stiles GL, Jacobson KA. J. Med. Chem. 1994;37:636. doi: 10.1021/jm00031a014. [DOI] [PMC free article] [PubMed] [Google Scholar]
- 13.Kim HO, Ji X-d, Siddiqi SM, Olah ME, Stiles GL, Jacobson KA. J. Med. Chem. 1994;37:3614. doi: 10.1021/jm00047a018. [DOI] [PMC free article] [PubMed] [Google Scholar]
- 14.Cramer RD, Patterson DE, Bunce JD. J. Am. Chem. Soc. 1988;110:5959. doi: 10.1021/ja00226a005. [DOI] [PubMed] [Google Scholar]
- 15.Cramer RD, Bunce JD, Patterson DE, Frank IE. Quant. Struct.-Act. Relat. 1988;7:18. [Google Scholar]
- 16.Olah ME, Gallo-Rodriguez C, Jacobson KA, Stiles GL. Mol. Pharmacol. 1994;45:978. [PMC free article] [PubMed] [Google Scholar]
- 17.Schwabe U, Trost T. Naunyn-Schmiedeberg's Arch. Pharmacol. 1980;313:179. doi: 10.1007/BF00505731. [DOI] [PubMed] [Google Scholar]
- 18.Jarvis MF, Schulz R, Hutchison AJ, Do UH, Sills MA, Williams M. J. Pharmacol. Exp. Ther. 1989;251:888. [PubMed] [Google Scholar]
- 19.The program SYBYL 6.04a is available from TRIPOS Associates. St. Louis, MO, U.S.A: 1993. [Google Scholar]
- 20.MOPAC 6.0 available from the Quantum Chemistry Program Exchange.
- 21.Dewar MJS, Zoebisch EG, Haley EF, Stewart JJP. J. Am. Chem. Soc. 1985;107:3902. [Google Scholar]
- 22.Dewar MJS, Zoebisch EG. Theochem. 1988;49:1. [Google Scholar]
- 23.Wold S, Ruhe A, Wold H, Dunn WJ. SIAM J. Sci. Stat. Comp. 1994;5:735. [Google Scholar]
- 24.van Galen PJM, Leusen FJJ, IJzerman AP, Soudijn W. Eur. J. Pharmacol. 1989;172:19. doi: 10.1016/0922-4106(89)90041-2. [DOI] [PubMed] [Google Scholar]
- 25.Waller CL, Oprea TI, Giolitti A, Marshall GR. J. Med. Chem. 1993;36:4152. doi: 10.1021/jm00078a003. [DOI] [PubMed] [Google Scholar]
- 26.Linden J, Taylor HE, Robeva AS, Tucker AL, Stehle JH, Rivkees SA, Fink JS, Reppert SM. Mol. Pharmacol. 1993;44:524. [PubMed] [Google Scholar]
- 27.Safe SH. Annu. Rev. Pharmacol. Toxicol. 1986;39:259. doi: 10.1146/annurev.pa.26.040186.002103. [DOI] [PubMed] [Google Scholar]
- 28.Jacobson KA, Kirk KL, Padgett WL, Daly JW. J. Med. Chem. 1985;28:1341. doi: 10.1021/jm00147a039. [DOI] [PMC free article] [PubMed] [Google Scholar]
- 29.Salvatore CA, Jacobson MA, Taylor HE, Linden J, Johnson RG. Proc. Natl. Acad. Sci. 1993;90:10365. doi: 10.1073/pnas.90.21.10365. [DOI] [PMC free article] [PubMed] [Google Scholar]
- 30.Cheng YC, Prusoff WH. Biochem. Pharmacol. 1973;22:3099. doi: 10.1016/0006-2952(73)90196-2. [DOI] [PubMed] [Google Scholar]
- 31.Bruns RF, Lu GH, Pugsley TA. Mol. Pharmacol. 1986;29:331. [PubMed] [Google Scholar]