

Abstract
Sex and gender differences in food perceptions and eating behaviors have been reported in psychological and behavioral studies. The aim of this systematic review was to synthesize studies that examined sex/gender differences in neural correlates of food stimuli, as assessed by functional neuroimaging. Published studies to 2016 were retrieved and included if they used food or eating stimuli, assessed patients with functional magnetic resonance imaging (fMRI) or positron emission tomography (PET), and compared activation between males and females. Fifteen studies were identified. In response to visual food cues, females, compared to males, showed increased activation in the frontal, limbic, and striatal areas of the brain as well as the fusiform gyrus. Differences in neural response to gustatory stimuli were inconsistent. This body of literature suggests that females may be more reactive to visual food stimuli. However, findings are based on a small number of studies and additional research is needed to establish a more definitive explanation and conclusion.
Keywords: Sex, gender, obesity, neuroimaging
Overweight and obesity are more prevalent in females than males. In the United States, 35.0% of males are obese, compared to 40.4% of females.1 The prevalence of class III obesity is 9.9% among females, compared to 5.5% among males.1 At the same time, eating disorders are three times more common in females.2 Additionally, males and females often differ in their food preferences and eating behaviors. Males report diets with higher energy density.3 Females, in comparison to males, report greater consumption of fruits, vegetables, and fiber.4–6 While females prefer more snack-related comfort foods such as candy and chocolate, males favor more meal-related foods such as pizza, pasta, steak, and beef.7 Females have higher food cravings for sweet foods, while males have higher food cravings for savory foods.8 Males and females also differ in eating styles. Males take bigger bites of food and eat at a faster rate compared to females.9 Cognitive dietary restraint and disinhibition are higher among females than males.10 Foods and eating styles can be thought of as gendered: healthy and small meals are associated with femininity, and unhealthy and large meals are associated with masculinity.11 As such, packaging for healthier foods such as salad and yogurt are more frequently adorned with stereotypically feminine fonts and color choices, whereas unhealthy and heavier foods, such as beef and beer, are often in more stereotypically masculine packaging.12
Differences in food preferences and eating behaviors may be related to biological “sex” and/or psycho-social-cultural “gender.”13 Sex is the classification, typically as male or female, according to the reproductive organs and functions that derive from the chromosomal complement.14 Gender is an individual’s self-representation as male or female, or how that person is responded to by social institutions on the basis of the person’s gender presentation.14 Conceptually, sex and gender are distinct. However, the practical challenges of separating biological versus social causes of differences between males and females have been highlighted by a number of authors.15–17 We use the term “sex/gender” in this paper to reflect this overlap. Recent advances in neuroimaging have allowed scientists to investigate factors, such as sex/gender, which influence neural responses to food stimuli.
Several reviews have synthesized results from functional magnetic resonance imaging (fMRI) and positron emission tomography (PET) studies examining neural responses to food stimuli.18–24 These reviews have demonstrated core homeostatic and hedonic neural mechanisms underlying eating behaviors and food choices including the limbic, striatal and frontal neural circuitries. The importance of internal and external modulating factors such as fasting or fed state,22 weight status,19,20,24 eating-related pathology,23 and energy density21,25 have also been highlighted in these reviews. Despite evidence of behavioral and psychological sex/gender variances in eating behaviors and food choices, to date, no systematic reviews have examined differences in neural responses to food perceptions and eating behaviors between males and females. The purpose of this review was to synthesize results from fMRI and PET studies that have investigated sex/gender differences in neural correlates of food stimuli.
Methods
Literature Search and Study Selection
This systematic review followed the Preferred Reporting Items for Systematic Reviews and Meta-Analyses (PRISMA).26 The following electronic databases were searched: PubMed, EMBASE, Scopus, and the Cochrane Library. A pre-determined list of keyword search terms was informed and compiled from a preliminary search of the literature and expanded medical subject headings (MeSH). Keywords included combinations of the following: (i) fMRI, “functional magnetic resonance,” blood oxygen level dependent (BOLD), functional imaging, BOLD signal, BOLD effect, oxyhemoglobin, and deoxyhemoglobin, neuroimaging, PET, positron emission tomography; (ii) gender, sex; and (iii) food, eat*. Electronic searches were supplemented by systematically checking reference lists of relevant publications.
The search yielded 429 studies, excluding duplicates. Two authors (AMC and either CMH or ZMB) independently screened all article titles. Any non-English or clearly irrelevant entries were excluded. Next, the remaining abstracts were reviewed to identify studies for full text review. The a priori eligibility criteria for articles were that they: (i) were peer-reviewed original research articles in English language journals; (ii) examined human participants; (iii) were published between the inception of the database and June 2016; (iv) used fMRI or PET; (v) used scans to examine food stimuli; and (vi) reported contrasts between males and females. Studies that simply reported separate results for males and females, without directly statistically assessing the observed differences were not reviewed because of the interpretive limitations associated with such reports. Searches were conducted with the consultation of a research librarian. Inter-reviewer agreement was assessed using a simple kappa statistic. Disagreement was resolved by consensus. Please see Figure 1 for a schematic depiction of our article selection process.
Figure 1.
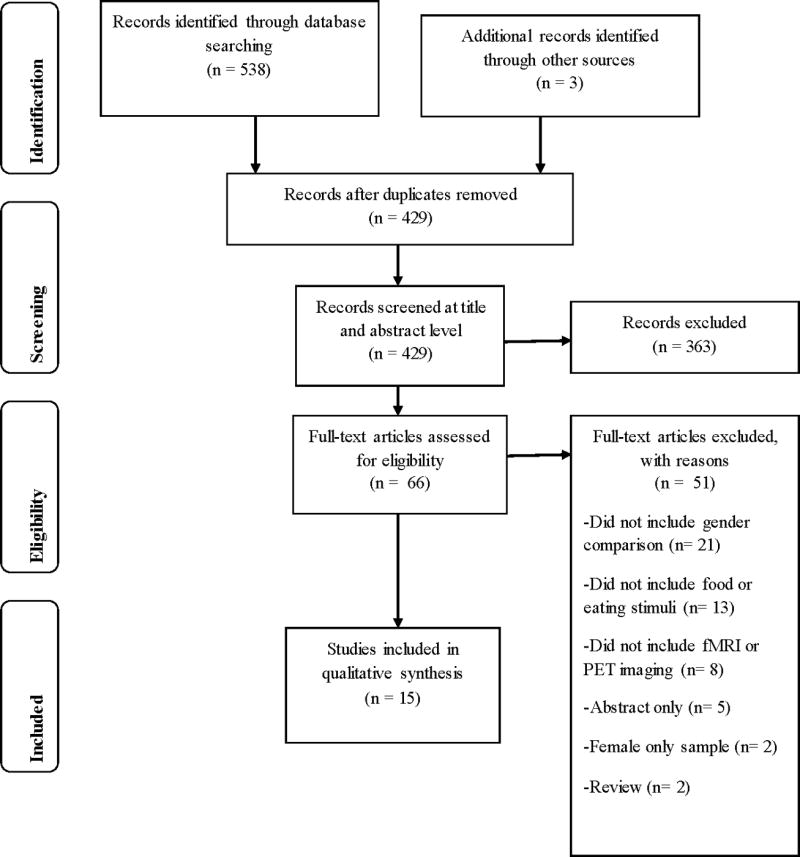
Flow diagram for literature search
Data extraction and synthesis
Data from each article were extracted independently by two authors (AMC and either CMH or ZMB) using a standardized tool that contained sections for study characteristics (Table 1), study results (Table 2), and study quality (Table 3). Quality was assessed using 11 criteria that were adapted from a previous systematic, neuroimaging review.27 The criteria were: clear research objective; clear recruitment procedure; adequate description of inclusion/exclusion criteria; report on sample demographics; participation rates; sufficient assessment of food stimuli measurements; imaging protocol; reporting of strength of effect; use of appropriate statistical analysis; acknowledgement of study limitations; and participation rate >70%. Due to the limited number of studies, all studies were included regardless of quality. Study findings were only extracted on results that reached thresholds for statistical significance that were stipulated by the study authors a priori. Disagreements were resolved through consensus. Due to heterogeneity, data were integrated using a qualitative synthesis process.
Table 1.
Participant characteristics in studies included in systematic review
| Study | Setting | Total N |
Female N |
BMI kg/m2 | Age years | All females premenopausal |
Menstrual cycle phase |
Race/ethnicity | ||
|---|---|---|---|---|---|---|---|---|---|---|
|
| ||||||||||
| M±SD | Range | M±SD | Range | |||||||
| Atalayer et al., 2014 [32] | New York, US | 31 | 14 | M=36.2±5.5 F=36.9±5.6 | ≥30 | M=35.0±9.0 F=35.0±6.9 | 25–45 | Yes | NR | NR |
| Cornier et al., 2010 [28] | Colorado, US | 43 | 22 | M=24.2±3.0 F=24.3±4.1 | NR | M=34.2±5.7 F=35.8±5.4 | 25–45 | Yes | Follicular | NR |
| Cornier et al., 2015 [38] | Colorado, US | 49 | 24 | M=24.2±3.3 F=22.9±4.1 | 17–30 | M=30.2±3.3 F=30.4±3.2 | 25–40 | Yes | Follicular | NR |
| Del Parigi et al., 2002 [42] | Arizona, US | 44 | 22 | NR | NR | M=31.0±8.0 F=31.0±9.0 | NR | Yes | Follicular | NR |
| Frank et al., 2010 [36] | Tubingen, Germany | 12 | 6 | Total= 22.4±2.55 | <25 | Total=27.4±4.1 | NR | NR | NR | NR |
| Geliebter et al., 2013 [35] | New York, US | 31 | 14 | M=36.2±5.5 F=36.9±5.6 | ≥30 | M=35.0±9.0 F=35.0±6.9 | NR | Yes | NR | NR |
| Haase et al., 2011 [39] | California, US | 21 | 12 | M=23.2±3.5 F=22.8±2.6 | NR | M=22.3±2.7 F=21.9±1.9 | 19–26 | NR | NR | NR |
| Herwig et al., 2016 [34] | Zuerich, Switzerland | 37 | 18 | M=22.9±2.4 F=21.3±2.1 | 18.0–28.6 | M=24.8±4.6 F=25.3±5.5 | 20–46 | NR | NR | NR |
| Hommer et al., 2013 [43] | Connecticut, US | 43 | 16 | NR | NR | Total=15.6±0.8 | 14–17 | NR | NR | 93% African American |
| Killgore & Yurgelun-Todd, 2010 [31] | Massachusetts, US | 16 | 8 | M=27.1±5.5 F=23.5±4.5 | NR | M=46.5±5.4 F=48.0±5.7 | NR | NR | NR | NR |
| Killgore et al., 2013a [29] | Massachusetts, US | 38 | 16 | M=24.2±3.6 F=25.1±4.0 | 19.8–34.8 | M=31.5±9.3 F=28.3±7.5 | 18–45 | NR | NR | NR |
| Killgore et al., 2013b [30] | Massachusetts, US | 38 | 16 | M=24.2±3.6 F=25.1±4.0 | 19.8–34.8 | M=31.5±9.3 F=28.3±7.5 | 18–45 | NR | Statistical control | NR |
| Smeets et al., 2006 [40] | Utrecht, Netherlands | 24 | 12 | M=21.5±1.6 F=22.0±1.4 | 19–25 | M=21.3±2.8 F=20.5±1.5 | 18–28 | NR | NR | NR |
| Uher et al., 2006 [33] | London, UK | 18 | 10 | M=22.4±2.5 F=22.5±2.8 | 17–27.4 | M=29.4±7.8 F=28.4±8.4 | 20–44 | NR | NR | NR |
| Wang et al., 2009 [41] | New York, US | 23 | 13 | Total= 24.8±2.7 | 20–29 | Total=32.6±7.5 | 22–48 | NR | NR | NR |
Note. BMI=body mass index. M=males. F=females. NR=not reported.
Table 2.
Study descriptions and results from investigations of sex/gender differences in neural correlates of food stimuli
| Study | Type of stimuli contrasted |
Imaging modality; Acquisition strength |
Nutrition standardization |
Analysis (WB Threshold) |
Major Inclusion and Exclusion Criteria/ Covariates |
Male>Female | Female>Male | |
|---|---|---|---|---|---|---|---|---|
|
| ||||||||
| Fasted | Fed | |||||||
| Multiple stimuli | ||||||||
|
| ||||||||
| Geliebter et al., 2013 [35] | Visual: High vs low energy density foods | fMRI; 1.5T | 12 hours | Liquid meal | WB (p<0.05, corrected, Monte Carlo; k≥147) | Healthy; right-handed; obese; stable weight × 3 months; non-smokers; no exercise pre scan; premenopausal | Fasted (visual): R inferior parietal lobule | Fasted (visual): B caudate; R temporal-occipital area |
| Auditory: High vs low energy density foods | Fasted (auditory): R parahippocampal gyrus | |||||||
| Fed (visual): L fusiform gyrus | Fed (visual): R dorsal ACC | |||||||
| Fed (auditory): B SMA and R precentral gyrus | ||||||||
| Uher et al., 2006 [33] | Visual: Savory and sweet foods vs non-edible objects | fMRI; 1.5T | 24 hours | Eating as usual | WB (p<0.005–0.001, cluster-wise) | Healthy; right-handed; not vegetarian or selective eater | Visual: B Fusiform gyrus | |
| Tastes (both): L anterior insula; L frontal operculum; B medial apical | ||||||||
| Taste: Chocolate milk; chicken broth; artificial saliva | PFC | |||||||
| Tastes (chicken): L anterior insula | ||||||||
| Wang et al., 2009 [41] | Individual's favorite food (taste, smell, view) | PET | 17–19 hours | ROI; global metabolism | Healthy; no history of eating disorders, surgical/medical treatment for weight control | Food stimulation with and without cognitive inhibition: Greater decreases in L OFC; L uncus; L parahippocampus; B amygdala; R putamen; cerebellar vermis | ||
|
| ||||||||
| Visual stimuli | ||||||||
|
| ||||||||
| Atalayer et al., 2014 [32] | High vs low energy density | fMRI; 1.5T | Overni ght | Liquid meal | ROI; Functional connectivity | Healthy; right-handed; obese; stable weight × 3 months; non-smokers; no exercise pre scan; premenopausal | Fasted: Greater functional connectivity with AMG in R SMA; B precentral gyri; R cuneus; L precuneus; greater functional connectivity with VS in the B SMA; R precentral gyrus; L precuneus | Fasted: Greater functional connectivity with AMG in L IFG; R thalamus; R dorsomedial PFC |
| Fed: Functional connectivity with AMG in right subgenual anterior cingulate | Fed: Functional connectivity with AMG in L angular gyrus and R precentral gyrus | |||||||
| Cornier et al., 2010 [28] | Primary: High hedonic value foods vs neutral-non-food items | fMRI; 3.0T | Overnight | WB (p<0.05, FDR, k≥130); ROI | Healthy; right-handed; follicular phase of menstrual cycle; not actively dieting | High hedonic vs non-foods: B lateral PFC; R dorsolateral PFC, B parietal cortex; L fusiform gyrus | ||
| Secondary: High vs neutral hedonic value foods | High hedonic vs neutral foods: R parietal cortex; R lateral PFC | |||||||
| Frank et al., 2010 [36] | High vs low calorie foods, non-food items | fMRI; 3T | 3 hours | After lunch | WB (p<0.05, FDR) | Healthy; right-handed; not dieting | Fasted to fed (viewing high calorie foods): Decreased activation in superior medial frontal lobe; B fusiform gyrus; L ACC; R olfactory; L middle frontal lobe | |
| Herwig et al., 2016 [34] | Individual's ratings of healthy vs unhealthy foods | fMRI; 3T | 1 hour | ROI | Healthy; right-handed | R VS in the perception and evaluation of unhealthy stimuli | Midbrain region associated with rating period of healthy stimuli compared to unhealthy stimuli | |
| Killgore & Yurgelun-Todd, 2010 [31] | High vs low calorie foods, non-food items | fMRI; 3T | 1 hour | WB (p<0.001, uncorrected, k≥10); ROI | Healthy | B AMG | L middle frontal gyrus; L inferior lateral OFC; L ventromedial/OFC; L middle/posterior cingulate gyrus; B insular cortices | |
| Killgore et al., 2013a [29] | High vs low calorie foods, non-food items | fMRI; 3T | 1 hour | ROI | Healthy; right-handed; no recent psychoactive medications or illicit substances | Lower ventromedial PFC associated with eating more than intended | ||
| Killgore et al., 2013b [30] | High vs low calorie foods, non-food items | fMRI; 3T | 1 hour | ROI | Healthy; right-handed; no recent psychoactive medications or illicit substances; adjusted for menstrual phase | Combined brain responses in B AMG, insula, and medial OFC in response to high calorie foods was associated weight status in females only and accounted for 75.6% of variance in weight status | ||
|
| ||||||||
| Gustatory stimuli | ||||||||
|
| ||||||||
| Del Parigi et al., 2002 [42] | Hunger vs satiation (liquid meal) | PET | 36 hours | Liquid meal | WB (p<0.005) | Healthy; right-handed; follicular phase of menstrual cycle; no family history of obesity or diabetes; absence of dietary restraint; sedentary activity only during study | Fasted: Dorsolateral PFC; middle temporal gyrus; posterior cingulate; parahippocampal gyrus | |
| Fed: vmPFC | Fed: Dorsolateral PFC; precuneus; angular gyrus; occipital-temporal cortex | |||||||
| Cornier et al., 2015 [38] | Sucrose vs artificial saliva with unique paired cue (geometric shape) | fMRI; 3T | Liquid meal | WB (p<0.001, uncorrected, k≥10); ROI | Healthy; right-handed; follicular phase of menstrual cycle | Sucrose receipt: R caudate | ||
| Haase et al., 2011 [39] | Salty (sodium chloride), sour (citric acid), bitter (caffeine), sweet (sucrose) | fMRI; 3T | 12 hours | Liquid meal | WB (p≤0.005, cluster p<0.05, k≥12) | Healthy | Fasted to fed: Global Caffeine, NaCl, citric acid, sucrose: B insula (L only for NaCl); B IFG (L only for NaCl); L cerebellum (B for caffeine) Caffeine, NaCl, sucrose: R parahippocampal gyrus (B for NaCl); R anterior cingulate (B for caffeine) Caffeine, citric acid, sucrose: B IFG (R only sucrose) Caffeine, sucrose: B caudate; R lentiform nucleus; B posterior cingulate (L only for NaCl); B fusiform gyrus (L only for sucrose); B middle and superior temporal gyri; B lingual gyrus and B cuneus NaCl and sucrose: R amygdala; R uncus; R precentral gyrus | Fasted: Citric acid: L insula; L thalamus; L parahippocampal gyrus; L lentiform nucleus; R posterior cingulate; R precuneus; L superior temporal gyri; R middle temporal gyri; R postcentral gyrus; cerebellum NaCl: L IFG; R precuneus Fed: Sucrose, caffeine: R Posterior cingulate Citric acid: L Posterior cingulate Sucrose, citric acid: Cerebellum Sucrose, caffeine: R cuneus; R lingual gyrus Citric acid: B thalamus Caffeine: R insula; R IFG; R lentiform nucleus; middle temporal gyrus Fasted to fed: Caffeine: B anterior cingulate; B cerebellum |
| NaCl: L middle temporal gyrus; L fusiform gyrus; L IFG; L insula Citric acid: L superior temporal gyrus; B insula; L parahippocampal gyrus; R angular gyrus; B middle frontal gyrus; B IFG | ||||||||
| Smeets et al., 2006 [40] | Chocolate milk | fMRI; 1.5T | Overni ght | Chocolate until satiated | WB (p<0.005, k≥20); ROI | Healthy; normal weight; no history of alcohol consumption >28 units/wk; no irregular eating habits, dieting or restrained eating | Increased activation after satiation: L VS | |
| Decreased activation after satiation: R medial frontal gyrus | Decreased activation after satiation: Hypothalamus | |||||||
|
| ||||||||
| Auditory stimuli | ||||||||
|
| ||||||||
| Hommer et al., 2013 [43] | Individualized stress, favorite food and neutral scripts | fMRI; 3T | NR | NR | WB (p<0.05, FWE) | Healthy | Superior, middle, medial frontal gyri; B parietal lobes | |
Notes. fMRI=Functional magnetic resonance imaging. PET=positron emission tomography. ROI=region of interest. WB=Whole brain. R=right. L=left. B=bilateral. AMG=amygdala. SMA=supplementary motor area. VS=ventral striatum. IFG=inferior frontal gyrus. PFC=prefrontal cortex. ACC=anterior cingulate cortex. vmPFC=ventromedial prefrontal cortex.
Table 3.
Quality assessment scores for included studies
| Study | Research objective |
Recruitment procedure |
Inclusion/ exclusion criteria |
Sample demographic |
Participation rates |
Participant rating of food stimuli |
Imaging protocol |
Strength of effect |
Appropriate analysis |
Limitations discussed |
Participation over 70% |
Total Score (Out of 11) |
|---|---|---|---|---|---|---|---|---|---|---|---|---|
| Atalayer et al., 2014 [32] | Yes | Yes | Yes | No | NR | No | Yes | No | Yes | Yes | NR | 6 |
| Cornier et al., 2010 [28] | Yes | No | Yes | No | NR | No | Yes | No | Yes | No | NR | 4 |
| Cornier et al., 2015 [38] | Yes | Yes | Yes | No | NR | Yes | Yes | No | Yes | Yes | NR | 7 |
| Del Parigi et al., 2002 [42] | Yes | Yes | Yes | No | NR | No | Yes | No | Yes | Yes | NR | 6 |
| Frank et al., 2010 [36] | Yes | No | No | No | NR | No | Yes | No | Yes | Yes | NR | 4 |
| Geliebter et al., 2013 [35] | Yes | Yes | Yes | No | NR | No | Yes | No | Yes | Yes | NR | 6 |
| Haase et al., 2011 [39] | Yes | Yes | Yes | No | NR | Yes | Yes | No | Yes | Yes | NR | 7 |
| Herwig et al., 2016 [34] | Yes | Yes | Yes | No | NR | Yes | Yes | No | Yes | Yes | NR | 7 |
| Hommer et al., 2013 [43] | Yes | Yes | Yes | No | NR | Yes | Yes | No | Yes | Yes | NR | 7 |
| Killgore & Yurgelun-Todd, 2010 [31] | Yes | Yes | Yes | No | NR | No | Yes | No | Yes | Yes | NR | 6 |
| Killgore et al., 2013a [29] | Yes | Yes | Yes | No | NR | Yes | Yes | No | Yes | Yes | NR | 7 |
| Killgore et al., 2013b [30] | Yes | Yes | Yes | No | NR | Yes | Yes | No | Yes | Yes | NR | 7 |
| Smeets et al., 2006 [40] | Yes | Yes | Yes | No | NR | Yes | Yes | No | Yes | Yes | NR | 7 |
| Uher et al., 2006 [33] | Yes | Yes | Yes | No | NR | Yes | Yes | No | Yes | Yes | NR | 7 |
| Wang et al., 2009 [41] | Yes | Yes | Yes | No | NR | Yes | Yes | Yes | Yes | Yes | NR | 8 |
Note. NR=not reported and score of 0 is given. For each “yes”, 1 point is given.
Results
Study Selection
Based on the literature search strategies, 429 unique citations were retrieved from the databases. Among these, 12 reports met inclusion criteria. Three additional studies were found from review of reference lists, for a total of 15 article included in this review (Figure 1). The inter-reviewer agreement (Kappa=0.97) indicated excellent agreement among reviewers.
Participant Characteristics
The number of participants per study ranged from 12 to 49 (Table 1). Eleven of the studies were conducted in the US. Across trials, the average body mass index (BMI) ranged from 21.3 to 36.9 kg/m2 for females and from 21.5 to 36.2 kg/m2 for males. Two studies only included participants who were obese (BMI≥30 kg/m2), two included individuals with a BMI<35 kg/m2, four included participants with BMIs <30 kg/m2, and two included participants with BMIs <25 kg/m2. The five remaining studies did not report the specific BMI range of participants. The mean age in each study was between 15.6 to 48.0 years. The percent of female participants ranged from 37.2% to 57.1%. Five studies explicitly stated that all females were premenopausal. However, all studies included participants 48 years and under, and participants who were considered healthy (i.e., free of significant medical conditions or psychiatric history).
Study Designs
Two studies used PET, and the remainder employed fMRI (Table 2). Eight studies examined sex/gender as a primary outcome/hypothesis. The seven remaining studies explored sex/gender differences as a secondary aim. The studies included a number of stimuli to provoke neural responses; seven employed visual stimuli, four used gustatory stimuli, three had multiple stimuli, and one used auditory stimuli. Six studies were conducted with participants fasting only, one fed only, seven both fasted and fed, and one did not report whether participants were fasted or fed. Three studies standardized for menstrual cycle phase among female participants (all conducted during the follicular phase), and one study controlled for menstrual phase. Table 2 lists the thresholds for all studies that included a whole-brain analysis.
Study Results
Visual cues: Fasted
Nine studies included responses to visual stimuli of food cues during a fasted state.28–36 Food pictures were described as high or low “calorie,” “energy dense,” or “hedonic” (Table 2). Herwig et al. (2016) compared foods based on individuals’ ratings of foods as healthy or unhealthy.34 Eight studies used functional localization techniques (i.e., analyses that assume specific mental functions are localized to specific brain regions37). One study used a functional connectivity analysis to examine the integration of different regions of the brain in association with visual food cue processing.32
Four of the nine studies directly compared neural responses to visual pictures of high- and low-calorie foods.28,31,33,35 Compared to males, females demonstrated greater activation in regions of the prefrontal cortex including the lateral prefrontal cortex,28 dorsolateral prefrontal cortex,28 middle frontal gyrus31, inferior lateral orbitofrontal cortex,31 and ventromedial/orbitofrontal cortex31 (Table 2). Females, relative to males, also showed more activation in areas of the limbic and striatal systems (middle/posterior cingulate gyrus31 and caudate nucleus35), as well as, the insular cortices,31 parietal cortex,28 fusiform gyrus,28,33 and temporal-occipital area.35 Two studies found no regions more activated in males compared to females.28,33 In one of the smaller studies (N=16), males, compared to females, had greater activation in the amygdala.31 In another study, males who were obese had greater activation in the inferior parietal lobe compared to females who were obese.35
The remaining four studies utilized other study paradigms. Compared to females, males had higher activity in the ventral striatum when evaluating unhealthy stimuli.34 Activation in the midbrain was higher among females when rating healthy stimuli compared to unhealthy stimuli.34 Atalayer et al. (2014) examined sex/gender differences among participants who were obese using a functional connectivity analysis of two seed regions—the amygdala and the ventral striatum.32 In both seed regions, males had greater functional connectivity with the supplementary frontal motor area, precentral gyri, cuneus, and precuneus. Compared to males, females showed greater functional connectivity with the amygdala and thalamus, inferior frontal gyrus, and dorsomedial prefrontal cortex.
Two studies correlated neural responses to visual food stimuli with behaviors. Killgore et al. (2013a) examined neural responses to high- and low-calorie food stimuli in relation to appetite and urge to overeat.29 Among females, reduced responsiveness of the prefrontal cortex to food images was associated with a greater urge to overeat. In another study, Killgore et al. (2013b) examined whether responsiveness to high- and low-calorie pictures was associated with BMI.30 The combined cluster activation response in reward regions (i.e., amygdala, insula, and orbitofrontal cortex) was predictive of BMI for females, accounting for 75.6% of the variance in body mass. There was no significant association for males.
Visual cues: Fed
Four studies examined responses to visual stimuli after being fed.32,33,35,36 When viewing pictures of high-energy-density foods, males, compared to females, showed greater activation in the fusiform gyrus.35 Females showed greater activation in the anterior cingulate cortex relative to males.35 Atalayer et al. (2014) found that males who were obese, compared to females who were obese, had greater functional connectivity with the amygdala and subgenual anterior cingulate.32 Females, relative to males, had greater functional connectivity between the amygdala and angular gyrus and precentral gyrus.32 No regions were significant when the ventral striatum was used as the seed region. In a small study (N=12), Frank et al. (2010) compared differences in neural activation from a fasted to fed state.36 While viewing high-calorie foods, females, relative to males, had decreased activation in the superior medial frontal lobe, fusiform gyrus, anterior cingulate cortex as well as the olfactory and middle frontal lobe.36
Gustatory cues
Six studies examined gustatory cues during scans,33,38–42and two of these studies used PET.41,42 Five studies included sweet tastes or flavors (i.e., two used sucrose, two tested chocolate milk, one administered Ensure; Table 2). When fasted, males, relative to females, had greater activation in the dorsolateral prefrontal cortex, middle temporal gyrus, posterior cingulate, and parahippocampual gyrus.42 When fed, females had greater response than males in the dorsolateral prefrontal cortex, precuneus, angular gyrus, and occipital-temporal cortex.42 After being fed, males had greater activation in the ventromedial prefrontal cortex42 and caudate compared to females.38 Haase et al. (2011) found no differences in neural response to sucrose between males and females when fasted.39 Three studies examined variations between males and females in sweet taste from fasting to fed states.39,40,42 Smeets et al. (2006) found that relative to males, females had greater decreases in activation in the hypothalamus after being satiated.40 Del Parigi et al. (2002) demonstrated that in response to satiation, females had greater cerebral blood flow in the dorsolateral prefrontal cortex, precuneus, angular gyrus, occipital-temporal cortex, compared to males.42 Males had increased activation after satiation in the ventral striatum37 and ventromedial prefrontal cortex39 and decreased activation from hunger to satiety in the medial frontal gyrus,40 insula, inferior frontal gyrus, cerebellum, parahippocampal gyrus, anterior cingulate, caudate, lentiform nucleus, posterior cingulate, fusiform gyrus, middle and superior temporal gyri, lingual gyrus, cuneus, amygdala, uncus, and precentral gyrus.39 Uher et al. (2006) showed that irrespective of being fasted or fed, females showed stronger responses to sweet taste in the anterior insula, frontal operculum, and medial apical prefrontal cortex.33 In addition to sweet taste, Haase et al. (2011) also tested bitter (caffeine), sour (citric acid), and salty (sodium chloride) tastes.39 There were differences in activation patterns based on the types of taste, condition (fasted vs fed) and sex/gender (Table 2).39
In a study by Wang et al. (2009), participants were scanned 3 times: once after they observed and spontaneously reacted to their favorite foods; once when instructed to inhibit their desire for food before the presentation of the food stimuli; and once without stimulation.41 In food stimulation with cognitive inhibition, males had greater decreases than females in the amygdala, striatum, orbitofrontal cortex, parahippocampus, hippocampus, hypothalamus and cerebellum.
Auditory cues
Two studies used auditory stimuli.35,43 In a study from Geliebter et al. (2013), neural responses to short auditory descriptions of high-energy-density foods were compared to low-energy-density foods.35 When fasted, females demonstrated greater activation than males in the right parahippocampal gyrus. Males did not show greater neural activation in any regions compared to females when fasted. When fed, males, compared to females, showed greater activation in the bilateral supplementary motor areas and precentral gyrus. Females did not show greater activation in any regions when fed versus males. Hommer et al. (2013) conducted a study with adolescents assessing neural responses to script-driven imagery of favorite foods.43 During descriptions of the foods, males had greater activation in the superior, middle, medial frontal gyri and bilateral parietal lobes, compared to females.
Quality Assessment
The mean quality score was 6.4 out of 11 possible points (Table 3). The range of scores was from 4 to 8. No study fulfilled all quality score criteria. Nine studies fulfilled 7 or more of the criteria.
Discussion
This is the first systematic review to investigate sex/gender differences in neural responses to food stimuli. There was support of group-level differences between males and females in neural activation to visual, gustatory, and auditory food stimuli across studies, though activation patterns varied and results should be interpreted cautiously given the limited literature available. Three primary central nervous systems control eating processes.19 The first is the hypothalamic system that responds to homeostatic mechanisms, through which food intake is balanced with energy requirements. Second is the striatal/limbic system which controls emotion/memory and current and past reward experiences, including food motivation. The third is the frontal and cortical system that allows pursuit of more abstract goals, reasoning, and executive functioning.19,44 In the current review, there was fairly consistent evidence that females, relative to males, had higher neural activation when viewing food stimuli in the latter two systems.
Among females, overeating in response to food cues within the environment is associated with weight gain.45 Consistent with this behavioral finding, while cognitively inhibiting food intake, females did not show a significant suppression of regional brain metabolism in the limbic areas of the brain associated with emotional regulation, interoception, and conditioning.38 Neural responses to food stimuli in areas of the brain associated with reward, interoception, cravings for substances, and decision making (i.e., amygdala, insula, and orbitofrontal cortex) were also related to overeating and BMI among females but not males.29,30,46–48 Taken together, this suggests that females may have greater difficulties deactivating these areas of the brain to overcome the motivational drive to eat.
Weight status may have influenced study findings and may moderate the relationships between neural responsiveness to food stimuli. While most studies demonstrated that females were more reactive to visual to food stimuli compared to males, 4 of the 9 studies showed areas of the brain that were more reactive among males relative to females. Two of these studies were from samples of patients who were obese.35 In another study that found that males had greater reactivity than females, the mean BMI for males was 27.1 kg/m2, compared to a mean BMI of 23.5 kg/m2 for females.31 It is possible that as BMI increases, differences between males and females may become attenuated.
Consistent with other reviews,19–25 we found that a variety of factors moderated sex/gender differences in responses to food stimuli including state (fasted vs fed) and stimuli type. Relative to results from studies examining visual food stimuli, responses to gustatory stimuli were mixed. Cornier et al. (2015) and Smeets et al. (2006) found that males, compared to females, had greater responses to sweet taste in the caudate nucleus and ventral striatum, which are associated with reward salience and incentive motivation.49 However, other studies found that females had greater neural responses compared to males. Uher et al. (2006) showed that in response to chocolate milk and chicken broth, females had greater activation in the anterior insula, frontal operculum, and prefrontal cortex. Hasse et al. (2011) found that during satiation, females showed greater activation within the posterior cingulate in response to sweet taste. These areas of the brain are associated with interoception, emotional awareness, planning, and decision making.50 While these results suggest that there may be sex/gender-specific neural responses to gustatory stimuli, further investigation is needed to clarify these inconsistencies.
The mechanisms underlying the differences in response to food stimuli between males and females remain elusive but are likely a result of complex physiological (i.e., sex-related) and/or psycho-sociocultural (i.e., gender-related) factors. Socialization to different eating behaviors occurs at a young age,51 and up to 50% of sex/gender differences in food choice can be attributable to health beliefs and weight control motivation.4,52 Thus, differences between males and females on neural response could be due to variations in cognitive or emotional processes as a result of being socialized to consume certain types of foods. Since neural circuitry is plastic and develops through and is altered by experiences,53 it is possible that sex/gender effects on neural functioning and behavior are a result of gendered life experiences and social constructions. Additional research is needed to examine whether sociocultural factors may account for differences.54
Preclinical and clinical studies have demonstrated that feeding behaviors are, in part, mediated by gonadal hormones such as estrogens. These hormones may produce organizational effects (i.e., permanent consequences related to hormonal exposure during early development) and/or activational effects (i.e., ongoing hormonal signaling during other life stages), due to direct effects on the central nervous system or indirect effects through effects on orexigenic and anorexigenic neuropepetides (e.g., ghrelin, insulin, leptin).55,56 In rats, bilateral ovariectomy produces rapid increases in food intake and weight gain, but these responses are normalized by estradiol treatment.57 In humans, estrogen phasically inhibits food intake. Food intake is 190 kcals/day less during the follicular/peri-ovulatory phase of the cycle than in the luteal and menstrual phases. The nadir occurs around the time of ovulation, when circulating estrogen levels peak.58 These cyclical changes in food intake are not seen until puberty.59 Females who have anovulatory menstrual cycles do not demonstrate these cyclical changes in food intake.60 Neuroimaging results also support the effect of menstrual cycle hormones on response to food stimuli. Results suggest that neural response to food cues in areas such as the amygdala, nucleus accumbens, and fusiform gyrus are greater during the late follicular phase (when estradiol is high) compared to the early follicular and luteal phases.61,62 Only four studies in this review accounted for menstrual phase. Given these within-person changes in ovarian hormones, neurological responses may have been enhanced or disguised. Further evaluation of neural function and relationships with hormonal factors over the course of the menstrual cycle is critical to understanding sex differences in food perceptions and eating behaviors. Longitudinal data are needed to examine whether adult sex differences are a result of organizational and/or activational effects.
Studies are needed to clarify the extent to which mechanisms related to sex, gender and their intersection underlie these findings. Examining differences between males and females is complex and requires consideration of different dimensions and measures of sex/gender including structural (e.g., cultural gender norms), social (e.g., social context and role), and individual level-factors (e.g., gender identity, hormones).63 In particular, studies that are well-powered with a priori comparisons of biological, social and biosocial mechanisms will help to advance our understanding of differences between males and females in eating behaviors and food choices.16
There are several limitations to this review and gaps in the literature. First, there were a limited number of articles that compared sex/gender differences, and sample sizes in each study were small. The heterogeneity of study variables and paradigms made direct comparisons between studies challenging. All studies included patients who were healthy and free of major medical and psychiatric conditions, and only one study reported the race/ethnicity of participants. Additionally, independent replication of these fMRI studies is necessary. Seven of the fifteen studies included sex/gender analyses as secondary analyses. This is a concern as most studies did not control for variables such as menstrual cycle phase or status and hormonal contraceptive use. Results based on a small number of participants, whole-brain analyses that used uncorrected thresholds, and region of interest analyses were also included in this review. This may have resulted in studies being underpowered to detect true differences while also increasing the risk for false positives.64,65 While studies reported statistical significance values, better reporting of effect sizes is needed to fully evaluate how substantial differences are between males and females. Thus, generalizability is limited and results should be interpreted cautiously. Findings require replication before they can be assumed to be reliable. Additionally, non-English publications were omitted. As noted in other reviews examining sex/gender differences in neural outcomes,30 publication bias, false-positive errors, and search strategies likely biased the findings towards data with significant results. Clear interpretation of study findings is limited and future studies would benefit from collection of objective and subjective data about food perceptions and eating behaviors.
Functionally, it appears that females and males differ in neural responses to food cues in the frontal, limbic, and striatal areas of the brain as well as the fusiform gyrus, particularly to visual food cues while fasted. Compared to males, females may be more sensitive or reactive to visual food cues, suggesting more cognitive processing related to executive functioning, emotion and reward when viewing food stimuli. This conclusion is based on a limited number of studies with small sample sizes thus caution is needed when interpreting results. Also, relating neural activation to functional significance is based on reverse inference and should be considered speculative.66,67 Further research is needed on differences and similarities between males and females as this could have implications for the development of relevant sex/gender-informed prevention and treatment options for obesity and disordered eating. These findings suggest that vulnerabilities to obesity and disordered eating, which are more common among females, may be influenced by greater neurocognitive responsiveness to food stimuli. Further research is also required in larger samples to confirm these findings, including studies that explore differential effects among males and females across weight status.
Acknowledgments
Funding: AMC was funded by a postdoctoral fellowship from the National Institutes of Nursing Research/NIH (T32NR007100-17 to Sommers, M). AG was funded by NIDDK (R01DK080153).
The authors would like to express their gratitude to Carlos Ivan Rodriguez from the Department of Biology and Biomedical Library at the University of Pennsylvania for his consultation on the literature search. We would also like to thank Marilyn S. Sommers, PhD, RN, FAAN and Madelyne Greene, BS for providing feedback on earlier drafts of this paper.
Footnotes
Conflict of Interest: The authors have declared no conflicts of interest
References
- 1.Flegal KM, Kruszon-Moran D, Carroll MD, Fryar CD, Ogden CL. Trends in Obesity Among Adults in the United States, 2005 to 2014. JAMA. 2016;315(21):2284–2291. doi: 10.1001/jama.2016.6458. [DOI] [PMC free article] [PubMed] [Google Scholar]
- 2.Hudson JI, Hiripi E, Pope HG, Kessler RC. The prevalence and correlates of eating disorders in the National Comorbidity Survey Replication. Biol Psychiatry. 2007;61(3):348–358. doi: 10.1016/j.biopsych.2006.03.040. [DOI] [PMC free article] [PubMed] [Google Scholar]
- 3.Ledikwe JH, Blanck HM, Khan LK, et al. Dietary energy density determined by eight calculation methods in a nationally representative United States population. The Journal of nutrition. 2005;135(2):273–278. doi: 10.1093/jn/135.2.273. [DOI] [PubMed] [Google Scholar]
- 4.Wardle J, Haase AM, Steptoe A, Nillapun M, Jonwutiwes K, Bellisie F. Gender differences in food choice: the contribution of health beliefs and dieting. Ann Behav Med. 2004;27(2):107–116. doi: 10.1207/s15324796abm2702_5. [DOI] [PubMed] [Google Scholar]
- 5.Grimm K, Blanck H, Scanlon K, Moore L, Grummer-Strawn L, Foltz J. State-specific trends in fruit and vegetable consumption among adults-United States, 2000–2009. Morbidity and Mortality Weekly Report. 2010;59(35):1125–1130. [PubMed] [Google Scholar]
- 6.Deshmukh-Taskar P, Nicklas TA, Yang S-J, Berenson GS. Does food group consumption vary by differences in socioeconomic, demographic, and lifestyle factors in young adults? The Bogalusa Heart Study. J Am Diet Assoc. 2007;107(2):223–234. doi: 10.1016/j.jada.2006.11.004. [DOI] [PMC free article] [PubMed] [Google Scholar]
- 7.Wansink B, Cheney MM, Chan N. Exploring comfort food preferences across age and gender. Physiol Behav. 2003;79(4):739–747. doi: 10.1016/s0031-9384(03)00203-8. [DOI] [PubMed] [Google Scholar]
- 8.Herman CP, Polivy J. Handbook of gender research in psychology. Springer; 2010. Sex and gender differences in eating behavior; pp. 455–469. [Google Scholar]
- 9.Park S, Shin W-S. Differences in eating behaviors and masticatory performances by gender and obesity status. Physiol Behav. 2015;138:69–74. doi: 10.1016/j.physbeh.2014.10.001. [DOI] [PubMed] [Google Scholar]
- 10.Neumark-Sztainer D, Shenvood NE, French SA, Jefsery RW. Weight control behaviors among adult men and women: cause for concern? Obes Res. 1999;7(2):179–188. doi: 10.1002/j.1550-8528.1999.tb00700.x. [DOI] [PubMed] [Google Scholar]
- 11.Vartanian LR, Herman CP, Polivy J. Consumption stereotypes and impression management: How you are what you eat. Appetite. 2007;48(3):265–277. doi: 10.1016/j.appet.2006.10.008. [DOI] [PubMed] [Google Scholar]
- 12.Zhu LL, Brescoll VL, Newman GE, Uhlmann EL. Macho Nachos. Soc Psychol. 2015 [Google Scholar]
- 13.Rubin G. The "political economy" of sex. Feminist Anthropology: a reader. 2009;87 [Google Scholar]
- 14.Pardue M-L, Wizemann TM. Exploring the Biological Contributions to Human Health:: Does Sex Matter? National Academies Press; 2001. [PubMed] [Google Scholar]
- 15.Fausto-Sterling A. Myths of gender: Biological theories about women and men. Basic Books; 2008. [Google Scholar]
- 16.Springer KW, Stellman JM, Jordan-Young RM. Beyond a catalogue of differences: a theoretical frame and good practice guidelines for researching sex/gender in human health. Soc Sci Med. 2012;74(11):1817–1824. doi: 10.1016/j.socscimed.2011.05.033. [DOI] [PubMed] [Google Scholar]
- 17.Kaiser A, Haller S, Schmitz S, Nitsch C. On sex/gender related similarities and differences in fMRI language research. Brain Research Reviews. 2009;61(2):49–59. doi: 10.1016/j.brainresrev.2009.03.005. [DOI] [PubMed] [Google Scholar]
- 18.Asmaro D, Liotti M. High-caloric and chocolate stimuli processing in healthy humans: an integration of functional imaging and electrophysiological findings. Nutrients. 2014;6(1):319–341. doi: 10.3390/nu6010319. [DOI] [PMC free article] [PubMed] [Google Scholar]
- 19.Vainik U, Dagher A, Dubé L, Fellows LK. Neurobehavioural correlates of body mass index and eating behaviours in adults: a systematic review. Neurosci Biobehav Rev. 2013;37(3):279–299. doi: 10.1016/j.neubiorev.2012.11.008. [DOI] [PMC free article] [PubMed] [Google Scholar]
- 20.Brooks SJ, Cedernaes J, Schiöth HB. Increased prefrontal and parahippocampal activation with reduced dorsolateral prefrontal and insular cortex activation to food images in obesity: a meta-analysis of fMRI studies. PLoS One. 2013;8(4):e60393. doi: 10.1371/journal.pone.0060393. [DOI] [PMC free article] [PubMed] [Google Scholar]
- 21.Van der Laan LN, De Ridder DT, Viergever MA, Smeets PA. The first taste is always with the eyes: a meta-analysis on the neural correlates of processing visual food cues. Neuroimage. 2011;55(1):296–303. doi: 10.1016/j.neuroimage.2010.11.055. [DOI] [PubMed] [Google Scholar]
- 22.Kennedy J, Dimitropoulos A. Influence of feeding state on neurofunctional differences between individuals who are obese and normal weight: a meta-analysis of neuroimaging studies. Appetite. 2014;75:103–109. doi: 10.1016/j.appet.2013.12.017. [DOI] [PubMed] [Google Scholar]
- 23.García-García I, Narberhaus A, Marqués-Iturria I, et al. Neural responses to visual food cues: insights from functional magnetic resonance imaging. European Eating Disorders Review. 2013;21(2):89–98. doi: 10.1002/erv.2216. [DOI] [PubMed] [Google Scholar]
- 24.Pursey KM, Stanwell P, Callister RJ, Brain K, Collins CE, Burrows TL. Neural responses to visual food cues according to weight status: a systematic review of functional magnetic resonance imaging studies. Frontiers in Nutrition. 2014;1:7. doi: 10.3389/fnut.2014.00007. [DOI] [PMC free article] [PubMed] [Google Scholar]
- 25.Smeets PA, Charbonnier L, van Meer F, van der Laan LN, Spetter MS. Food-induced brain responses and eating behaviour. Proc Nutr Soc. 2012;71(04):511–520. doi: 10.1017/S0029665112000808. [DOI] [PubMed] [Google Scholar]
- 26.Moher D, Liberati A, Tetzlaff J, Altman DG. Preferred reporting items for systematic reviews and meta-analyses: the PRISMA statement. Ann Intern Med. 2009;151(4):264–269. doi: 10.7326/0003-4819-151-4-200908180-00135. [DOI] [PubMed] [Google Scholar]
- 27.Seixas D, Foley P, Palace J, Lima D, Ramos I, Tracey I. Pain in multiple sclerosis: a systematic review of neuroimaging studies. NeuroImage: Clinical. 2014;5:322–331. doi: 10.1016/j.nicl.2014.06.014. [DOI] [PMC free article] [PubMed] [Google Scholar]
- 28.Cornier MA, Salzberg AK, Endly DC, Bessesen DH, Tregellas JR. Sex-based differences in the behavioral and neuronal responses to food. Physiol Behav. 2010;99(4):538–543. doi: 10.1016/j.physbeh.2010.01.008. [DOI] [PMC free article] [PubMed] [Google Scholar]
- 29.Killgore WDS, Schwab ZJ, Weber M, et al. Daytime sleepiness affects prefrontal regulation of food intake. Neuroimage. 2013;71:216–223. doi: 10.1016/j.neuroimage.2013.01.018. [DOI] [PubMed] [Google Scholar]
- 30.Killgore WDS, Weber M, Schwab ZJ, et al. Cortico-limbic responsiveness to high-calorie food images predicts weight status among women. Int J Obes. 2013;37(11):1435–1442. doi: 10.1038/ijo.2013.26. [DOI] [PubMed] [Google Scholar]
- 31.Killgore WDS, Yurgelun-Todd DA. Sex differences in cerebral responses to images of high versus low-calorie food. Neuroreport. 2010;21(5):354–358. doi: 10.1097/WNR.0b013e32833774f7. [DOI] [PMC free article] [PubMed] [Google Scholar]
- 32.Atalayer D, Pantazatos SP, Gibson CD, et al. Sexually dimorphic functional connectivity in response to high vs. low energy-dense food cues in obese humans: an fMRI study. Neuroimage. 2014;100:405–413. doi: 10.1016/j.neuroimage.2014.05.054. [DOI] [PMC free article] [PubMed] [Google Scholar]
- 33.Uher R, Treasure J, Heining M, Brammer MJ, Campbell IC. Cerebral processing of food-related stimuli: effects of fasting and gender. Behav Brain Res. 2006;169(1):111–119. doi: 10.1016/j.bbr.2005.12.008. [DOI] [PubMed] [Google Scholar]
- 34.Herwig U, Dhum M, Hittmeyer A, et al. Neural signaling of food healthiness associated with emotion processing. Front Aging Neurosci. 2016 Feb;8 doi: 10.3389/fnagi.2016.00016. [DOI] [PMC free article] [PubMed] [Google Scholar]
- 35.Geliebter A, Pantazatos SP, McOuatt H, Puma L, Gibson CD, Atalayer D. Sex-based fMRI differences in obese humans in response to high vs. low energy food cues. Behav Brain Res. 2013;243(1):91–96. doi: 10.1016/j.bbr.2012.12.023. [DOI] [PMC free article] [PubMed] [Google Scholar]
- 36.Frank S, Laharnar N, Kullmann S, et al. Processing of food pictures: influence of hunger, gender and calorie content. Brain Res. 2010;1350:159–166. doi: 10.1016/j.brainres.2010.04.030. [DOI] [PubMed] [Google Scholar]
- 37.Finger S. Origins of neuroscience: a history of explorations into brain function. Oxford University Press; USA: 2001. [Google Scholar]
- 38.Cornier MA, Shott ME, Thomas EA, et al. The effects of energy balance, obesity-proneness and sex on the neuronal response to sweet taste. Behav Brain Res. 2015;278:446–452. doi: 10.1016/j.bbr.2014.10.024. [DOI] [PMC free article] [PubMed] [Google Scholar]
- 39.Haase L, Green E, Murphy C. Males and females show differential brain activation to taste when hungry and sated in gustatory and reward areas. Appetite. 2011;57(2):421–434. doi: 10.1016/j.appet.2011.06.009. [DOI] [PMC free article] [PubMed] [Google Scholar]
- 40.Smeets PA, de Graaf C, Stafleu A, van Osch MJ, Nievelstein RA, van der Grond J. Effect of satiety on brain activation during chocolate tasting in men and women. The American Journal of Clinical Nutrition. 2006;83(6):1297–1305. doi: 10.1093/ajcn/83.6.1297. [DOI] [PubMed] [Google Scholar]
- 41.Wang G-J, Volkow ND, Telang F, et al. Evidence of gender differences in the ability to inhibit brain activation elicited by food stimulation. Proceedings of the National Academy of Sciences. 2009;106(4):1249–1254. doi: 10.1073/pnas.0807423106. [DOI] [PMC free article] [PubMed] [Google Scholar]
- 42.Del Parigi A, Chen K, Gautier J-F, et al. Sex differences in the human brain's response to hunger and satiation. The American Journal of Clinical Nutrition. 2002;75(6):1017–1022. doi: 10.1093/ajcn/75.6.1017. [DOI] [PubMed] [Google Scholar]
- 43.Hommer RE, Seo D, Lacadie CM, et al. Neural correlates of stress and favorite-food cue exposure in adolescents: A functional magnetic resonance imaging study. Hum Brain Mapp. 2013;34(10):2561–2573. doi: 10.1002/hbm.22089. [DOI] [PMC free article] [PubMed] [Google Scholar]
- 44.Fuster JM. The prefrontal cortex—an update: time is of the essence. Neuron. 2001;30(2):319–333. doi: 10.1016/s0896-6273(01)00285-9. [DOI] [PubMed] [Google Scholar]
- 45.Hays NP, Roberts SB. Aspects of eating behaviors “disinhibition” and “restraint” are related to weight gain and BMI in women. Obesity. 2008;16(1):52–58. doi: 10.1038/oby.2007.12. [DOI] [PMC free article] [PubMed] [Google Scholar]
- 46.Wise RA. Brain reward circuitry: insights from unsensed incentives. Neuron. 2002;36(2):229–240. doi: 10.1016/s0896-6273(02)00965-0. [DOI] [PubMed] [Google Scholar]
- 47.Naqvi NH, Bechara A. The hidden island of addiction: the insula. Trends Neurosci. 2009;32(1):56–67. doi: 10.1016/j.tins.2008.09.009. [DOI] [PMC free article] [PubMed] [Google Scholar]
- 48.Kringelbach ML. The human orbitofrontal cortex: linking reward to hedonic experience. Nature Reviews Neuroscience. 2005;6(9):691–702. doi: 10.1038/nrn1747. [DOI] [PubMed] [Google Scholar]
- 49.Volkow ND, Wang GJ, Tomasi D, Baler RD. Obesity and addiction: neurobiological overlaps. Obes Rev. 2013;14(1):2–18. doi: 10.1111/j.1467-789X.2012.01031.x. [DOI] [PMC free article] [PubMed] [Google Scholar]
- 50.Craig AD. How do you feel—now? the anterior insula and human awareness. Nature reviews neuroscience. 2009;10(1) doi: 10.1038/nrn2555. [DOI] [PubMed] [Google Scholar]
- 51.Lowes J, Tiggemann M. Body dissatisfaction, dieting awareness and the impact of parental influence in young children. Br J Health Psychol. 2003;8(2):135–147. doi: 10.1348/135910703321649123. [DOI] [PubMed] [Google Scholar]
- 52.Westenhoefer J. Diet diversification and health promotion. Karger Publishers; 2005. Age and gender dependent profile of food choice; pp. 44–51. [DOI] [PubMed] [Google Scholar]
- 53.Draganski B, Gaser C, Busch V, Schuierer G, Bogdahn U, May A. Neuroplasticity: changes in grey matter induced by training. Nature. 2004;427(6972):311–312. doi: 10.1038/427311a. [DOI] [PubMed] [Google Scholar]
- 54.Schmitz S. Sex, gender, and the brain–biological determinism versus socio-cultural constructivism. e Ineke Klinge and. 2010:57. [Google Scholar]
- 55.Brown L, Clegg D. Central effects of estradiol in the regulation of food intake, body weight, and adiposity. The Journal of Steroid Biochemistry and Molecular Biology. 2010;122(1):65–73. doi: 10.1016/j.jsbmb.2009.12.005. [DOI] [PMC free article] [PubMed] [Google Scholar]
- 56.Asarian L, Geary N. Sex differences in the physiology of eating. American Journal of Physiology-Regulatory, Integrative and Comparative Physiology. 2013;305(11):R1215–R1267. doi: 10.1152/ajpregu.00446.2012. [DOI] [PMC free article] [PubMed] [Google Scholar]
- 57.Eckel LA. The ovarian hormone estradiol plays a crucial role in the control of food intake in females. Physiol Behav. 2011;104(4):517–524. doi: 10.1016/j.physbeh.2011.04.014. [DOI] [PMC free article] [PubMed] [Google Scholar]
- 58.Buffenstein R, Poppitt SD, McDevitt RM, Prentice AM. Food intake and the menstrual cycle: a retrospective analysis, with implications for appetite research. Physiol Behav. 1995;58(6):1067–1077. doi: 10.1016/0031-9384(95)02003-9. [DOI] [PubMed] [Google Scholar]
- 59.Asarian L, Geary N. Modulation of appetite by gonadal steroid hormones. Philosophical Transactions of the Royal Society of London B. Biological Sciences. 2006;361(1471):1251–1263. doi: 10.1098/rstb.2006.1860. [DOI] [PMC free article] [PubMed] [Google Scholar]
- 60.Barr SI, Janelle KC, Prior JC. Energy intakes are higher during the luteal phase of ovulatory menstrual cycles. The American Journal of Clinical Nutrition. 1995;61(1):39–43. doi: 10.1093/ajcn/61.1.39. [DOI] [PubMed] [Google Scholar]
- 61.Alonso-Alonso M, Ziemke F, Magkos F, et al. Brain responses to food images during the early and late follicular phase of the menstrual cycle in healthy young women: relation to fasting and feeding. The American Journal of Clinical Nutrition. 2011;94(2):377–384. doi: 10.3945/ajcn.110.010736. [DOI] [PMC free article] [PubMed] [Google Scholar]
- 62.Frank TC, Kim GL, Krzemien A, Van Vugt DA. Effect of menstrual cycle phase on corticolimbic brain activation by visual food cues. Brain Res. 2010;1363:81–92. doi: 10.1016/j.brainres.2010.09.071. [DOI] [PubMed] [Google Scholar]
- 63.Rippon G, Jordan-Young R, Kaiser A, Fine C. Recommendations for sex/gender neuroimaging research: key principles and implications for research design, analysis, and interpretation. Front Hum Neurosci. 2014;8:650. doi: 10.3389/fnhum.2014.00650. [DOI] [PMC free article] [PubMed] [Google Scholar]
- 64.Button KS, Ioannidis JP, Mokrysz C, et al. Power failure: why small sample size undermines the reliability of neuroscience. Nature Reviews Neuroscience. 2013;14(5):365–376. doi: 10.1038/nrn3475. [DOI] [PubMed] [Google Scholar]
- 65.Bennett CM, Wolford GL, Miller MB. The principled control of false positives in neuroimaging. Soc Cogn Affect Neurosci. 2009;4(4):417–422. doi: 10.1093/scan/nsp053. [DOI] [PMC free article] [PubMed] [Google Scholar]
- 66.Hutzler F. Reverse inference is not a fallacy per se: Cognitive processes can be inferred from functional imaging data. Neuroimage. 2014;84:1061–1069. doi: 10.1016/j.neuroimage.2012.12.075. [DOI] [PubMed] [Google Scholar]
- 67.Poldrack RA. Can cognitive processes be inferred from neuroimaging data? Trends Cogn Sci. 2006;10(2):59–63. doi: 10.1016/j.tics.2005.12.004. [DOI] [PubMed] [Google Scholar]