Abstract
Brown adipose tissue (BAT) can dissipate chemical energy as heat through thermogenic respiration, which requires uncoupling protein 1 (UCP1)1,2. Thermogenesis from BAT and beige adipose can combat obesity and diabetes3, encouraging investigation of factors that control UCP1-dependent respiration in vivo. Herein we show that acutely activated BAT thermogenesis is defined by a substantial increase in mitochondrial reactive oxygen species (ROS) levels. Remarkably, this process supports in vivo BAT thermogenesis, as pharmacological depletion of mitochondrial ROS results in hypothermia upon cold exposure, and inhibits UCP1-dependent increases in whole body energy expenditure. We further establish that thermogenic ROS alter BAT cysteine thiol redox status to drive increased respiration, and Cys253 of UCP1 is a key target. UCP1 Cys253 is sulfenylated during thermogenesis, while mutation of this site desensitizes the purine nucleotide inhibited state of the carrier to adrenergic activation and uncoupling. These studies identify BAT mitochondrial ROS induction as a mechanism that drives UCP1-dependent thermogenesis and whole body energy expenditure, which opens the way to develop improved therapeutic strategies for combating metabolic disorders.
The specialized capacity for thermogenic respiration in BAT and beige fat4 relies on UCP1. This mitochondrial inner membrane (MIM) carrier dissipates protonmotive force (Δp) and increases the rate of substrate oxidation to generate heat1. While UCP1 is critical for thermogenesis, mechanisms that support UCP1-dependent respiration in vivo are not fully understood1,2.
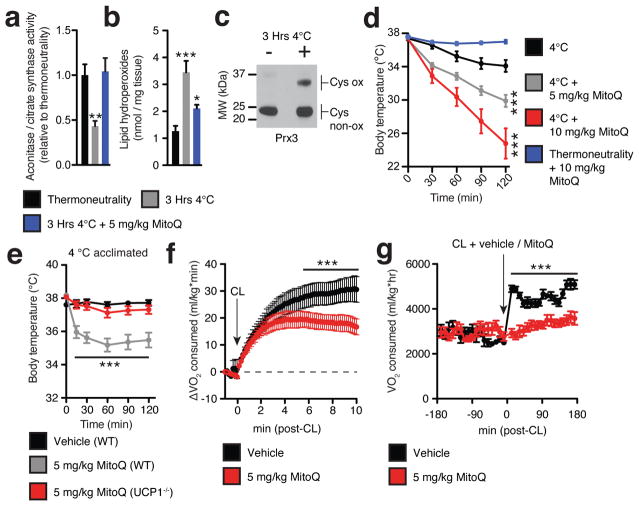
We examined features of mitochondrial function in mouse interscapular BAT following cold (4°C) exposure. Unexpectedly, we found that acute activation of BAT thermogenesis in vivo was associated with a substantial increase in mitochondrial ROS levels. Mitochondrial superoxide (Fig. 1a), lipid hydroperoxides (Fig. 1b), and mitochondrial hydrogen peroxide (Fig. 1c)5 levels increased significantly in BAT following acute cold exposure. Furthermore, primary brown adipocytes exposed to adrenergic stimulation of thermogenesis by norepinephrine (NE) exhibited acute dose-dependent increases in superoxide levels (Extended Data Fig. 1a). Having identified the induction of mitochondrial ROS as an early event during thermogenesis in BAT, we investigated whether it was a regulator of function in vivo. We injected mice intraperitoneally (i.p.) with the mitochondria-targeted antioxidant MitoQ prior to cold exposure. MitoQ efficiently depletes mitochondrial free radical species in vivo and achieves substantial localization in metabolically active tissues including adipose6. Treatment with MitoQ prior to cold exposure inhibited the cold-dependent increases in BAT mitochondrial superoxide and lipid hydroperoxides (Fig. 1a,b). Strikingly, MitoQ administration resulted in a dose dependent induction of hypothermia upon cold exposure (Fig. 1d). MitoQ had no effect on body temperature of mice without cold stress (Fig. 1d), and equimolar injections of decylTPP, the mitochondria-targeting moiety lacking the antioxidant group, had no significant effect on body temperature during cold exposure (Extended Data Fig. 1b).
Figure 1. Increased BAT mitochondrial ROS levels support UCP1-dependent thermogenesis in vivo.
a–c Effect of acute cold exposure on in vivo BAT (a) mitochondrial superoxide-dependent inactivation of mitochondrial aconitase (n = 5; 5 mg/kg MitoQ n = 4), (b) lipid hydroperoxide content (n = 5), and (c) mitochondrial hydrogen peroxide dependent oxidation of Prx3. Oxidized Prx3 was assessed using the redox gel shift method described in methods. For uncropped scans see Supplementary Figure 1. d, Effect of i.p. MitoQ on core body temperature following acute cold exposure (n = 10) e, Effect of i.p. MitoQ on core body temperature of WT and UCP1−/− mice following 4°C acclimation (n = 10; UCP1−/− n = 8). f, VO2 consumed acutely pre and post i.p. CL ± MitoQ (n = 5). g, VO2 consumed 3 hrs pre and post i.p. CL ± MitoQ (n = 8). Data are mean ± s.e.m. of at least four mouse replicates. *P < 0.05, ***P<0.001 (two-tailed Student’s t-test for pairwise comparisons, one-way/two-way ANOVA for multiple comparisons involving one/two independent variables)
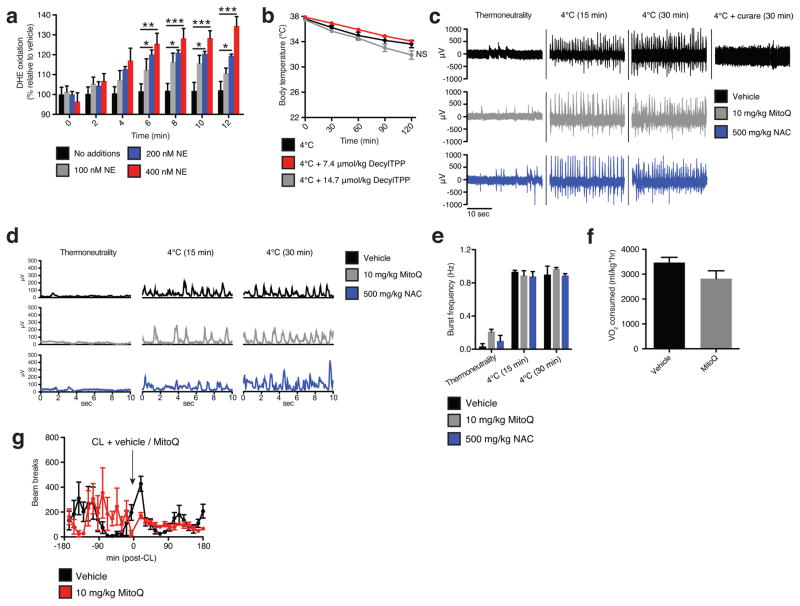
While BAT and beige fat are the primary tissues for mediating adaptive thermogenesis, muscle shivering also plays an important role, particularly during the early thermogenic response7. Shivering was monitored directly by electromyography (EMG) following the transition from thermoneutrality to cold. As expected, by 30 min cold exposure substantial shivering was observed (Extended Data Fig. 1c–e), which could be abrogated by the nicotinic acetylcholine receptor inhibitor curare (Extended Data Fig. 1c). Importantly, treatment of mice with MitoQ prior to cold exposure caused no detectable change in shivering activity (Extended Data Fig. 1c–e).
We next tested whether the hypothermic effects of depleting mitochondrial ROS depended on UCP1. Mice genetically lacking UCP1 (UCP1−/−) are sensitive to acute cold challenge, but maintain thermal homeostasis following gradual acclimation to temperatures below thermoneutrality through compensatory upregulation of alternative thermogenic pathways8. We injected wild-type (WT) and UCP1−/− mice with MitoQ following gradual cold acclimation. Notably, UCP1−/− mice were protected against the hypothermic effects of MitoQ (Fig. 1e), indicating that mitochondrial ROS are particularly important for UCP1-dependent thermogenesis. Moreover, mice injected with MitoQ 10 min prior to β3-adgrenergic stimulation by CL 316,243 (CL)9 exhibited reduced CL-dependent VO2 consumption (Fig. 1f,g and Extended Data Fig. 1f). These differences were observed in the absence of any significant changes in physical movement (Extended Data Fig. 1g). Together, these data provide evidence that mitochondrial ROS are modulators of UCP1-dependent thermogenesis in vivo.
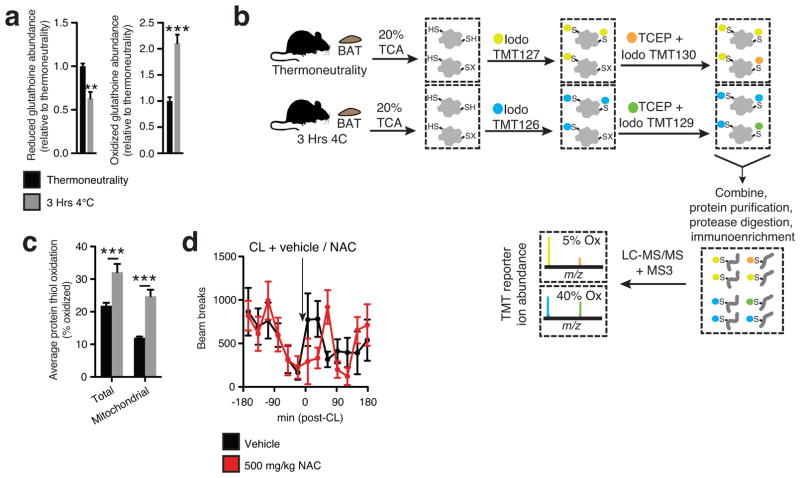
It is increasingly appreciated that mitochondrial ROS act as signaling molecules in physiology, which involves oxidative modification of sensitive cysteine thiol residues on proximal protein targets10. Strikingly, acute cold exposure drove substantial oxidation and depletion of the BAT glutathione pool (Extended Data Fig. 2a). Furthermore, by performing quantitative profiling of in vivo protein thiol redox status in BAT using ratiometric labeling with IodoTMT (Extended Data Fig 2b), we found that BAT protein thiols became substantially more oxidized upon cold exposure (Fig 2a and Extended Data Fig. 2c). Pathway analysis of those protein cysteine targets most substantially oxidized during thermogenesis revealed pathways involved in mitochondrial metabolism to be the most enriched (Fig. 2b and Supplementary Table 1). Finally, we profiled levels of protein sulfenic acids11 – the proximal reversible cysteine modification generated by lipid hydroperoxides and hydrogen peroxide12 – and found levels to be significantly elevated upon cold exposure (Fig. 2c). These findings suggested that oxidation of mitochondrial thiols might be important for signaling ROS-dependent thermogenesis in BAT.
Figure 2. BAT mitochondrial ROS during thermogenesis drives oxidation of cellular and mitochondrial thiols.
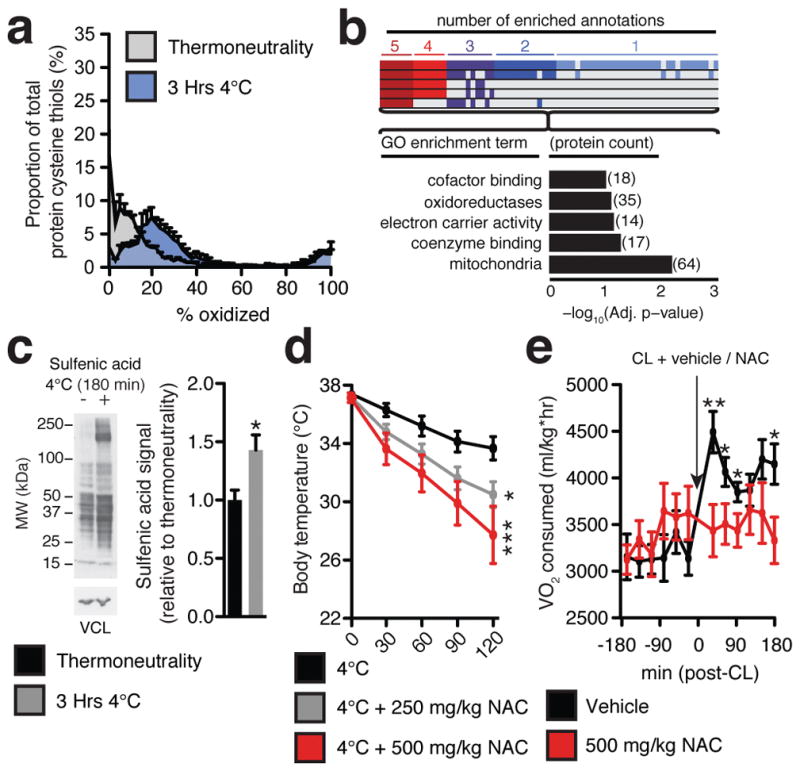
a, Distribution of % oxidation status of BAT protein thiols ± acute cold exposure. b, Pathway analysis of BAT proteins containing cysteine residues sensitive to substantial oxidation (>10% shift in oxidation status) upon cold exposure. (Top) Proteins clustered according to shared GO enrichment terms. (Bottom) Significantly enriched pathways. c, Immunodetection of protein sulfenic acid levels in BAT ± acute cold exposure (n = 4) d, Effect of i.p. NAC on core body temperature following acute cold exposure (n = 8; 500 mg/kg NAC n = 7). e, VO2 consumed 3 hrs pre and post i.p. CL ± NAC (control n = 12; NAC n = 9). VCL = vinculin. Data are mean ± s.e.m. of at least four mouse replicates. *P < 0.05, **P < 0.01, ***P<0.001 (two-tailed Student’s t-test for pairwise comparisons, one-way/two-way ANOVA for multiple comparisons involving one/two independent variables).
We examined this possibility using N-acetylcysteine (NAC), a cell permeable cysteine precursor shown to increase the intracellular pool of reduced thiols13. Similar to what was observed with MitoQ, NAC treatment resulted in a significant decrease in core body temperature upon cold exposure (Fig. 2d). This hypothermic activity suggests an effect on BAT function, as shivering was unaffected (Extended Data Fig. 1c–e). Furthermore, acute elevation in VO2 consumption by CL administration was inhibited by NAC pretreatment (Fig. 2e and Extended Data Fig. 2d). Taken together, these findings indicate that increased mitochondrial ROS levels and consequent thiol oxidation play important roles in driving BAT thermogenesis in vivo.
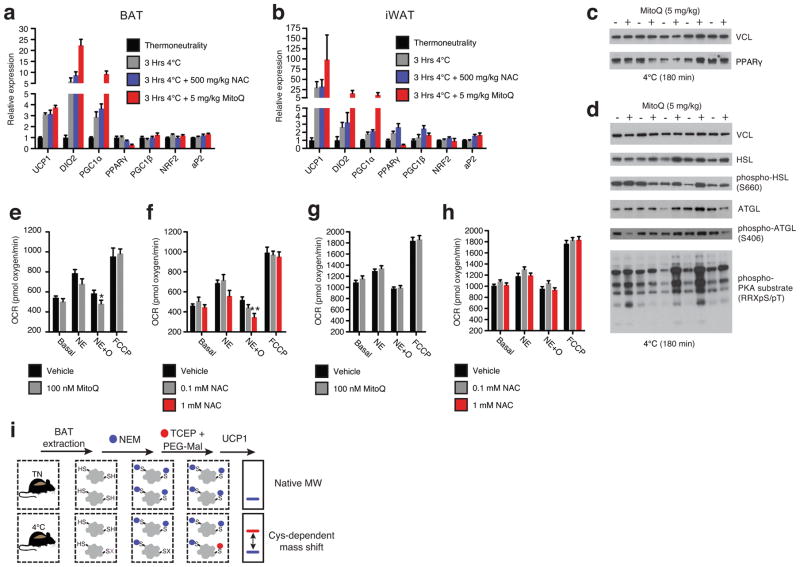
The acute hypothermic effects of depleting mitochondrial ROS and altering thiol redox status occurred without any appreciable decrease in thermogenic gene expression in either BAT or inguinal white adipose tissue (iWAT; Extended Data Fig 3a and b). In fact, some thermogenic gene markers were further elevated due to MitoQ or NAC treatment, possibly representing a compensatory increase in expression due to functional compromise of thermogenic respiration (Extended Data Fig. 3a and b). Furthermore, stimulation of the lipolytic machinery in BAT was comparable upon cold challenge following MitoQ treatment, suggesting this upstream driver of thermogenesis was not compromised (Extended Data Fig. 3c and d). To test whether mitochondrial ROS might act as direct modulators of UCP1-dependent leak respiration, we examined primary brown adipocytes using cellular respirometry14,15. As expected, adrenergic simulation by NE triggered a substantial increase in oxygen consumption rate (OCR; Fig. 3a and Extended Data Fig. 3e); while inhibition of ATP synthase with oligomycin allowed for determination of leak respiration14,15 (Fig 3a and Extended Data Fig. 3e). Depletion of mitochondrial ROS with MitoQ and reducing the thiol redox status with NAC both inhibited leak respiration (Fig. 3a,b and Extended Data Fig. 3e,f). Notably, these inhibitory effects were lost in adipocytes lacking UCP1 (Fig. 3c,d and Extended Data Fig. 3g,h).
Figure 3. BAT mitochondrial ROS oxidatively modify a cysteine residue on UCP1 and support UCP1-dependent leak respiration.
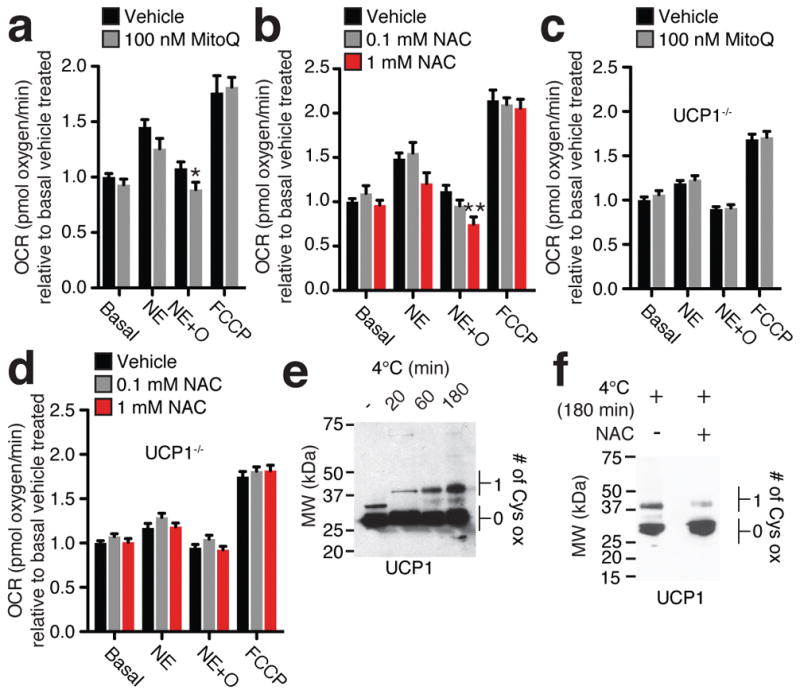
a,b, OCR of brown adipocytes under ± NE stimulation + oligomycin to determine leak respiration ± (a) MitoQ (n = 10) or (b) NAC (n = 8; 0.1 mM NAC n = 7). c, d OCR of primary UCP1−/− adipocytes under basal ± NE stimulation + oligomycin ± (c) MitoQ (n = 10) or (d) NAC (n = 10). e,f, Cys-redox immunoblot of BAT UCP1 (e) following a timecourse of acute cold exposure, and (f) following acute cold exposure ± 500 mg/kg NAC. FCCP = Carbonyl cyanide-p-trifluoromethoxyphenylhydrazone. Data are mean ± s.e.m. of at least seven cellular replicates. *P < 0.05, **P < 0.01, (two-tailed Student’s t-test for pairwise comparisons, one-way ANOVA for multiple comparisons).
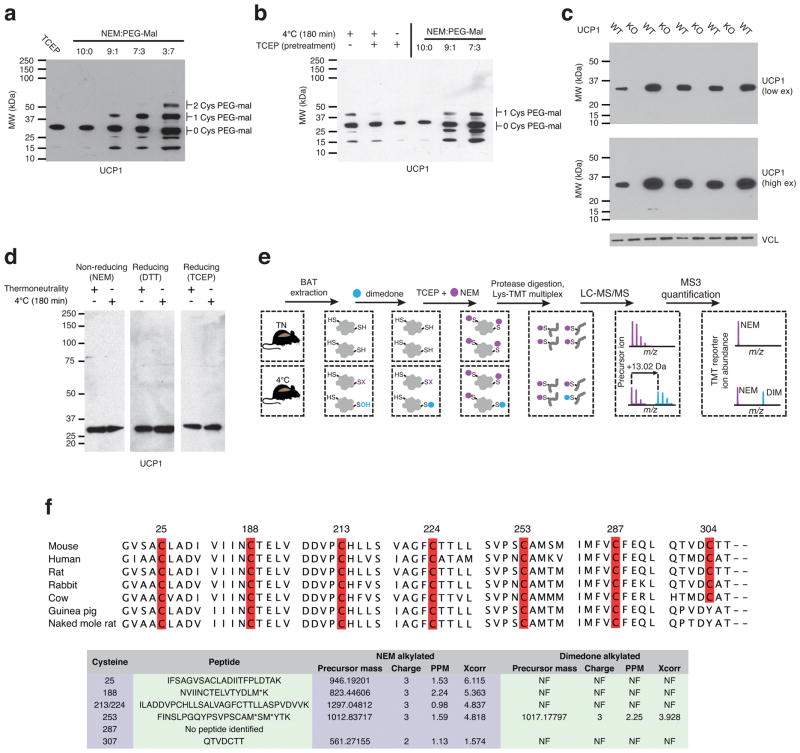
Our findings indicated that ROS-supported thermogenesis relied on both UCP1 and cysteine thiol oxidation. So, we considered whether UCP1 cysteines were targets for oxidative modification during thermogenesis. We used a redox gel-shift method16 to determine if BAT mitochondrial ROS drive cysteine-centered oxidative modifications on UCP1 in vivo. This approach labels reversibly oxidized protein cysteines with a polyethylene glycol maleimide, allowing for their determination by immunoblotting following SDS-PAGE16 (Extended Data Fig. 3i). In BAT from mice housed at thermoneutrality, UCP1 existed predominantly in a cysteine non-oxidized form (Fig. 3e). However, upon cold challenge cysteine oxidation increased on UCP1 in a time-dependent manner (Fig. 3e). Calibration of UCP1 cysteine shifts indicated that a single cysteine site was redox modified during thermogenesis (Extended Data Fig. 4a–c), and this modification did not appear to participate in inter-molecular disulfide bridging (Extended Data Fig. 4d). Notably, pharmacological reduction of BAT thiol status with NAC, which results in hypothermia (Fig. 2d), diminished UCP1 cysteine thiol oxidation upon cold exposure (Fig. 3f).
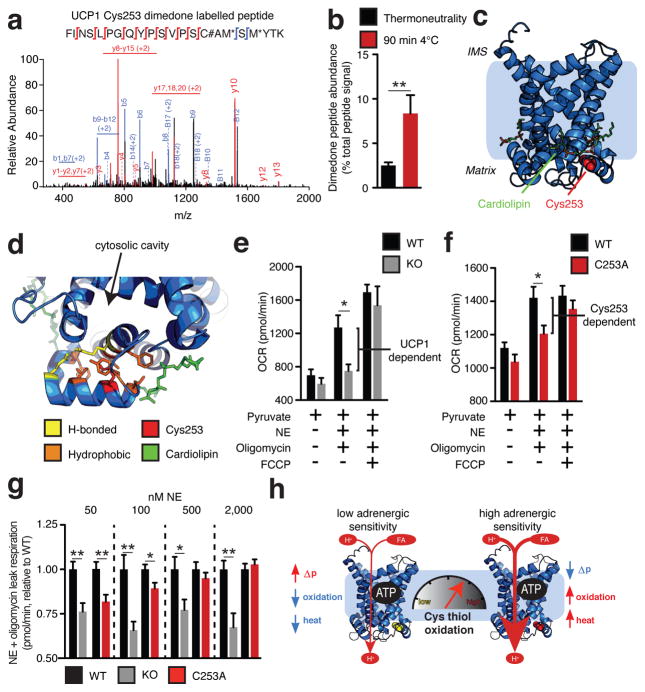
So, ROS-supported thermogenesis in BAT both depended on UCP1 (Fig. 1g) and acted directly on UCP1 cysteine(s) by oxidative modification (Fig. 3e,f). In order to examine the role of cysteine oxidation on UCP1 function, we first identified the site modified during thermogenesis. We profiled UCP1 cysteines for sulfenic acid modifications in vivo by selective dimedone labeling and mass spectrometry17 (Extended Data Fig. 4e) following acute cold exposure. We identified six of seven UCP1 cysteines, five of which were identified exclusively in the unmodified (NEM-labeled) form (Extended Data Fig. 4f and Supplementary Data File 1). However, UCP1 Cys253 was identified in the sulfenylated (dimedone-labeled) form (Fig. 4a, Extended Data Fig. 4f and Supplementary Data File 1). Moreover, sulfenic acid occupancy on Cys253 increased significantly upon acute cold exposure (Fig. 4b). Quantification of dimedone-labelled Cys253 provided an estimate of sulfenylation status during cold exposure (8.4%; Fig. 4b). However, due to the unstable nature of protein sulfenic acids18 this must be considered a significant under-representation of in vivo levels of this modification.
Figure 4. UCP1 Cys253 is sulfenylated during thermogenesis and sensitizes UCP1 to adrenergic activation.
a, MS2 spectrum of dimedone-labelled UCP1 Cys253 peptide indicating sulfenylation of this site during thermogenesis. Fragment ions that span the dimedone-alkylated cysteine are highlighted in the peptide sequence. C#; dimedone-labeled cysteine; M* = oxidized methionine. b, Quantification of dimedone-labelled UCP1 Cys253 relative to the NEM-alkylated form (n = 5). c,d, Structure of (c) human UCP1 modeled on the AAC crystal structure and (d) Cys253 in a hydrophobic pocket between two matrix facing helices. e,f Basal, maximal, and UCP1-dependent OCR of UCP1−/− brown adipocytes ± transduction with (e) WT UCP1 (WT n = 7; UCP1−/− n = 6) or (f) UCP1 C253A (WT n = 17; C253A n = 19). g, UCP1-dependent leak respiration following stimulation by various concentrations of NE (50 nM NE n = 9; 100 nM NE n = 7; 500 nM NE n = 8; 2000 nM NE n = 6). Comparison of UCP1 WT and C253A indicates that degree of UCP1 inhibition by C253A is inversely correlated with NE concentration (n = 19; 100 nM WT NE; n = 17 500 nM NE n = 18; 2000 nM NE n =10). j, A model of sensitization of UCP1-mediated uncoupling by mitochondrial ROS. Data are mean ± s.e.m. of at least four mouse replicates or cell replicates for respirometry experiments. *P < 0.05, **P < 0.01 (two-tailed Student’s t-test for pairwise comparisons).
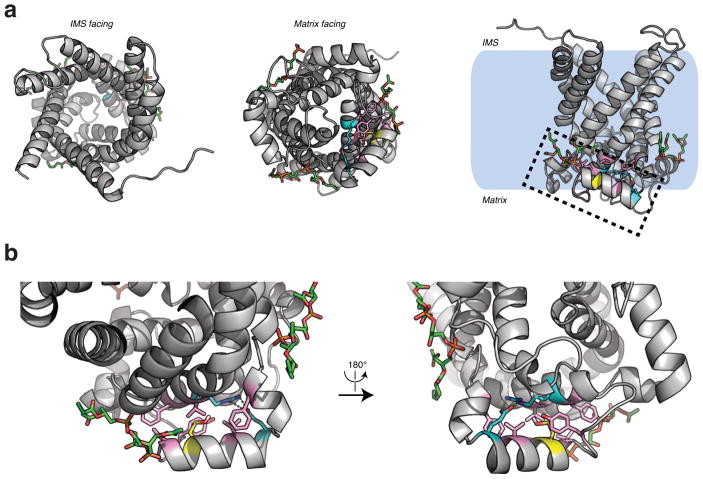
Since UCP1 Cys253 was identified as a redox sensitive site for which modification correlated with thermogenesis, we investigated the potential structural and functional importance of this site. We modeled UCP1 on the structure of the homologous mitochondrial ATP/ADP carrier (AAC)19(Fig. 4c and Extended Data Fig. 5a). This structure represents the matrix-closed “c-state” of the carrier19, which for UCP1 is maintained by inhibitory binding of cytosolic purine nucleotides1,20.
Examining the environment of the Cys253 thiol indicated that it resides at an interface between two matrix-facing helices. These helices contain residues highly conserved across the carrier family that stabilize the “c-state” by inter-helical hydrophobic interactions and a hydrogen bond21,22 (Fig. 4d and Extended Data Fig. 5b). This region forms the opposing face of the cytosolic cavity where inhibitory nucleotide binding is thought to occur23,24, and is proximal to a putative site of cardiolipin binding on UCP121 (Fig. 4d). Notably, modeling a sulfenic acid modification on the Cys253 thiol suggested that these “c-state” interactions could be destabilized due to local electrostatic effects (Extended Data Fig. 5b). Thus, on the basis of this structural model, Cys253 oxidation status could play a role in determining stability of the matrix closed “c-state” of UCP1, and sensitivity to fatty acid-dependent activation and uncoupling.
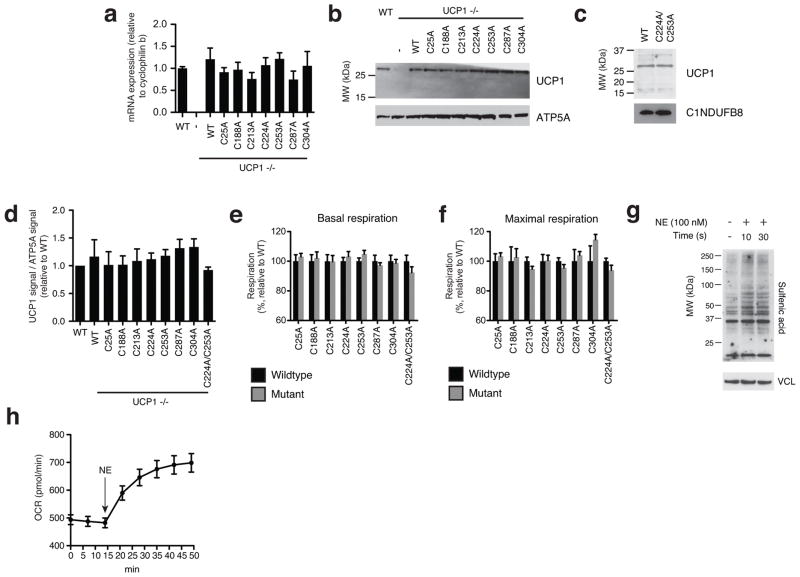
In the cellular milieu UCP1 is inhibited by endogenous purine nucleotides, and this inhibition can be overcome by β-adrenergic stimulation of lipolysis and activation of UCP1-dependent respiration1,15. A prediction of the above model is that altering Cys253 status should specifically modulate sensitivity to adrenergic activation of the purine nucleotide inhibited “c-state” of UCP11,20. To test this, in UCP1−/− brown adipocytes we separately transduced WT UCP1 and seven mutants, each having one of the seven cysteine residues contained in the protein replaced with an alanine. We titrated UCP1 transduction to recapitulate RNA and protein abundance observed in WT brown adipocytes (Extended Data. Fig. 6a–d). In all cases, basal and maximal respiration was indistinguishable between UCP1−/− brown adipocytes, UCP1−/− adipocytes transduced with WT UCP1, and UCP1−/− adipocytes transduced with each of the seven UCP1 Cys-mutants (Extended Data Fig. 6e,f). This agreed with previous studies indicating that UCP1 cysteines are not critical for protein stability and mitochondrial viability25.
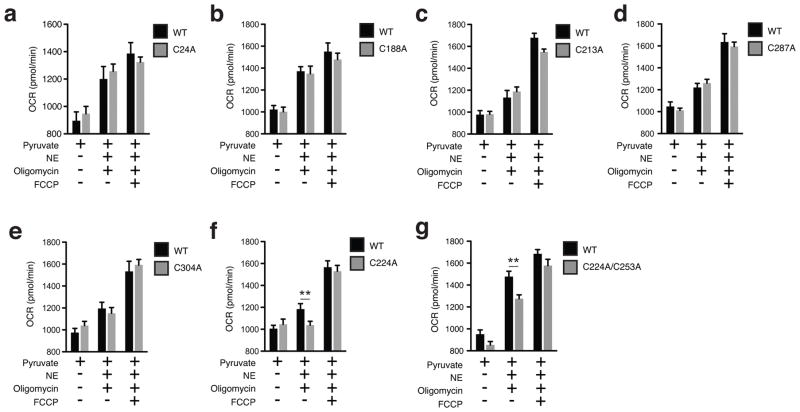
The UCP1 Cys-mutant cells were subjected to NE and oligomycin to examine the effect of adrenergic activation on leak respiration. NE stimulated rapid oxidation of protein cysteine residues (Extended Data Fig. 6g) that was concomitant with increases in OCR (Extended Data Fig. 6h). As expected, adipocytes lacking UCP1 exhibited a substantial reduction in respiration compared to WT UCP1 cells following 100 nM NE and oligomycin treatment, with ~35% of total leak OCR determined to be UCP1-dependent (Fig. 4e). While replacing the majority of UCP1 cysteines with alanine sites had no effect (Extended Data Fig. 7a–e), individual modification of Cys253 substantially inhibited UCP1-dependent leak respiration (Fig. 4f). Interestingly, individual modification of Cys224 also inhibited UCP1 leak respiration (Extended Data Fig. 7f). We additionally generated a C224A/C253A double mutant (Extended Data Fig. 6c,d), which exhibited compromise of UCP1-dependent respiration comparable to the individual mutations (Extended Data Fig. 7g).
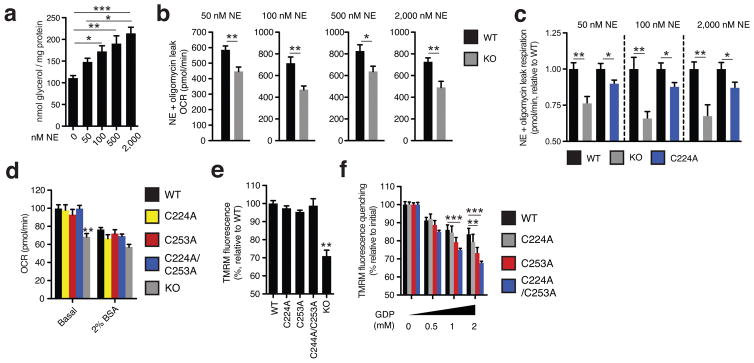
Replacement of the redox sensitive Cys253 inhibited adrenergic activation of UCP1 by NE, so we next tested whether this site played an obligatory or sensitizing role in this context. To do so, we titrated NE (50 nM - 2,000 nM) to trigger variable levels of adrenergic stimulation in brown adipocytes (Extended Data Fig. 8a). All concentrations of NE were sufficient to activate WT UCP1-dependent leak respiration, which was consistently ~25–35% of total leak respiration (Fig. 4g and Extended Data Fig. 8b). UCP1-dependent respiration in C253A cells was substantially inhibited following stimulation with 50 nM NE, however this inhibition was overcome dose-dependently by increasing NE concentrations (Fig. 4g). Thus, increased adrenergic stimulus could overcome inhibition by Cys253 replacement, suggesting that Cys253 plays a sensitizing (as opposed to an obligatory) role in adrenergically stimulated uncoupled respiration by UCP1. In contrast, exposure to variable adrenergic stimulus did not substantially modify the degree of inhibition of UCP1-dependent leak respiration in UCP1 C224A cells (Extended Data Fig. 8c). So, as opposed to a specific effect through altering sensitivity to adrenergic activation as in the case of Cys253, Cys224 replacement may alter UCP1 structure/function more generally.
Moreover, permeabilizing adipocytes to dilute cytosolic purine nucleotides resulted in uncoupled respiration that was indistinguishable between WT and C253A cells (Extended Data Fig. 8d), and could be abrogated by sequestering of endogenous free fatty acids with BSA (Extended Data Fig. 8d). In this nucleotide-diluted state, WT and C253A UCP1 cells exhibited a comparably low membrane potential (Δψ) as assessed by tetramethylrhodamine methyl ester (TMRM) fluorescence (Extended Data. Fig. 8e). As expected, titration of GDP resulted in an increase in Δψ in UCP1 WT cells due to GDP-dependent inhibition of UCP11,20 (Extended Data Fig. 8f). Notably, the C253A and C224A/C253A mutants exhibited increased sensitivity to GDP-dependent inhibition (Extended Data Fig. 8f).
Taken together, these data indicate that acute regulation of thermogenesis in vivo can be driven by elevation of mitochondrial ROS levels. The thermogenic actions of mitochondrial ROS require consequent oxidation of BAT cellular thiols, and UCP1 – the major thermogenic effector – is a target of thiol oxidation. We identify UCP1 Cys253 as a sulfenylation site that is increasingly modified during thermogenesis, and provide evidence that this residue can modulate sensitivity to UCP1-dependent thermogenic respiration.
While UCP1 is identified here as a target of redox modification during thermogenesis, it is likely that other target proteins exist, which may act together to drive thermogenic respiration. In addition to establishing the role of thiol redox signaling in thermogenesis in vivo, these findings provide insight into the longstanding investigations on the relationship between mitochondrial ROS and UCP11,2,26,27. Interestingly, studies in this area have relied largely on the use of isolated mitochondria and reconstituted systems. Our data suggest that redox regulation of UCP1-dependent respiration is particularly relevant in cells and in vivo where both redox homeostasis and free fatty acid concentrations are subject to strict endogenous regulation; parameters that are necessarily divergent from in vitro conditions. Notably, a role for thiol redox status and UCP1-dependent uncoupling has been suggested in isolated BAT mitochondria28, while the importance of superoxide in particular for modulating UCP1 function is the subject of debate1,2,26,27. Previous investigation using a manganese superoxide dismutase (MnSOD) transgenic mouse model suggested that matrix superoxide did not modify UCP1 function27. This previous work suggests that the role of thiol redox status in UCP1-dependent respiration detailed here is not directly mediated by matrix superoxide, but reliant on other ROS and related molecules the levels of which are not compromised by elevated MnSOD expression10.
Our data are consistent with a model whereby redox modification of Cys253 sensitizes purine nucleotide inhibited UCP1 to uncoupling due to adrenergic stimulus (Fig. 4j), which is compatible with fatty acid mediated activation and shuttling20. This model reconciles the apparent sensitizing role of both redox status and UCP1 Cys253 with the sufficient role of fatty acids for UCP1-dependent uncoupling1, as well as previous observations that cysteines are not essential for UCP1 activity in reconstituted systems25. However, previous study of UCP1 cysteines utilized yeast expression systems that are subject to protein misfolding and artifactual uncoupling29. Although Cys224 was not identified here as a target for reversible redox modification it appears to affect UCP1-dependent respiration, albeit distinctly from the sensitizing role of Cys253. It could be that this site is modified by other ROS-dependent species that are known to interact with UCP1 cysteines30. Additionally, these sites may also be important for UCP1 structure/function independent of redox-modification. Finally, it is worth noting that UCP1 Cys253 is conserved to a high degree across a number of mitochondrial carriers, including UCP2, UCP3, and AAC. This suggests that redox modification of this site may be a pervasive signaling modality for mitochondrial carriers in physiology and pathophysiology.
METHODS
Animal procedures and ethics statement
Animal experiments were performed according to procedures approved by the Institutional Animal Care and Use Committee (IACUC) of the Beth Israel Deaconess Medical Center. Unless otherwise stated, mice used were male C57BL/6J (8–12 weeks of age; Jackson Laboratories, USA), and housed in a temperature-controlled (20–22°C) room on a 12 h-light/dark cycle.
In vivo compound administration
All compounds administered to mice in vivo were injected at the stated dose i.p. 10 min prior to subsequent interventions unless otherwise stated.
Body temperature and cold exposure
Body temperature and cold exposure experiments were assessed using a mouse rectal probe (World Precision Instruments). When studying acute activation of thermogenesis, mice were housed from birth at 20–22°C to allow for recruitment of thermogenic adipose tissue7. Prior to individual housing at 4°C, mice were placed at thermoneutrality (30°C) for 3 days which allows for both maintenance BAT UCP1 protein content33 and measurement of acute induction of BAT thermogenesis upon cold exposure. Upon exposure to 4°C, temperature was measured every 30 min. When studying body temperature following 4°C acclimation, WT and Ucp1−/− mice (equal number of male and female mice in each group) were acclimated using established protocols: mice were individually housed for one week at 15°C, one week at 10°C, and 24 hrs at 4°C prior to the experiment.
EMG determination of muscle shivering
Mice were individually restrained to limit non-shivering muscle activity and two EMG wires were inserted subcutaneously above the nuchal muscles in the back of the neck. EMG leads were connected to a computerized data acquisition system via a communicator. EMG was recorded at thermoneutrality to determine non-shivering basal nuchal muscle activity, prior to placement of mice at 4°C. EMG data were collected and burst activity was determined as described previously34. Briefly, EMG data were collected from the implanted electrodes at a sampling rate of 2 kHz using LabChart 8 Pro Software (ADInstruments, Colorado Springs, CO). The raw signal was converted to root mean square (RMS) activity. RMS activity was analyzed for shivering bursts in 10s windows.
Metabolic phenotyping
Whole-body energy metabolism was evaluated using a Comprehensive Lab Animal Monitoring System (CLAMS, Columbia Instruments). For 6 hr measurements, mice were acclimated in the metabolic chambers for 48 hours prior to experiments to minimize stress from the housing change. CO2 and O2 levels were collected every 12 or 32 minutes for each mouse over the period of the experiment. For acute measurements, CO2 and O2 levels were collected every 10 seconds. 1 mg/kg CL 316,243 (Sigma-Aldrich) was injected i.p. into mice at the indicated times.
Assessment of mitochondrial aconitase inactivation in mouse BAT
Aconitase activity was measured as described previously35. In brief, following the relevant in vivo intervention mouse BAT was rapidly excised and homogenized in mitochondrial isolation buffer (250 mM sucrose, 2 mM EDTA, 10 mM sodium citrate, 0.6 mM MnCl2, 100 mM Tris-HCl, pH 7.4) followed by mitochondrial isolation by differential centrifugation. Samples (1–2 mg mitochondrial protein) were added to a 96-well plate and 190 ml assay buffer (50 mM Tris-HCl (pH 7.4), 0.6 mM MnCl2, 5 mM sodium citrate, 0.2 mM NADP+, 0.1% (v/v) Triton X-100, 0.4 U/ml ICDH). Absorbance was measured at 340 nm for 7 min at 37°C. To control for mitochondrial content aconitase activity was normalized to citrate synthase activity36 and expressed the result as a percentage of control levels.
Assessment of lipid lydroperoxides in mouse BAT
Lipid hydroperoxide content in mouse BAT was estimated by rapid snap freezing of BAT tissue followed by lipid extraction and assessment using a modified ferric thiocyanate assay (Cayman Chemical Lipid Hyroperoxide Assay Kit) according to the manufacturers instructions.
Assessment of cysteine redox status by gel shift
Cysteine redox status of Prx3 and UCP1 was measured as described previously16,37. Following the relevant in vivo intervention mouse BAT was rapidly excised and homogenized in 100 mM N-ethyl maleimide (NEM), 1 mM EGTA, 50 mM Tris-HCl, pH 7.4. Samples were incubated at 37 °C for 5 min prior to the addition of SDS (2% final) and further incubation at 37 °C for 10 min. 37 °C incubations proceeded in a thermomixer at 1300 RPM. Samples were then precipitated in five volumes of ice-cold acetone to remove excess NEM prior to resuspension in 1 mM EGTA, 2% SDS, 50 mM Tris-HCl, pH 7.4 containing a polyelthylene glycol polymer conjugated to maleimide (PEG-Mal). Resuspended samples were incubated for 30 min at 37 °C prior to a second acetone precipitation to remove excess PEG-Mal prior to sample resuspension and immunoblot detection by standard methods described below. For UCP1 experiments, to ensure gel shift signals were specific to reversible cysteine oxidation, oxidized samples were separately treated with TCEP prior to differential labelling as described above. Calibrating number of UCP1 cysteines oxidized was achieved by treating TCEP reduced samples with increasing proportion of Peg-Mal:NEM to generate a cysteine-dependent ladder37. In addition, to ensure higher molecular weight signals were specific to UCP1, UCP1 antibody specificity was tested in BAT. It should be noted that while the UCP1 antibody used here is highly specific for UCP1 in BAT (Extended Data Fig 4c), the same antibody in in vitro brown adipocytes can generate non-specific signals at MW > 35 kDa. So, the UCP1 gel shift assay as described here is only compatible with in vivo tissue experiments.
Assessment of BAT reduced and oxidized glutathione content by mass spectrometry
Reduced and oxidized glutathione were profiled in negative ionization mode by liquid chromatography tandem mass spectrometry (LC-MS) methods as described previously38. Data were acquired using an ACQUITY UPLC (Waters Corp, Milford MA) coupled to a 5500 QTRAP triple quadrupole mass spectrometer (AB SCIEX, Framingham MA). Tissue homogenates (30 μL) were extracted using 120 μL of 80% methanol containing 0.05 ng/μL inosine-15N4, 0.05 ng/μL thymine-d4, and 0.1 ng/μL glycocholate-d4 as internal standards (Cambridge Isotope Laboratories, Inc., Tewksbury MA). The samples were centrifuged (10 min, 9,000 × g, 4ºC) and the supernatants (10 μL) were injected directly onto a 150 × 2.0 mm Luna NH2 column (Phenomenex, Torrance CA). The column was eluted at a flow rate of 400 μL/min with initial conditions of 10% mobile phase A (20 mM ammonium acetate and 20 mM ammonium hydroxide (Sigma-Aldrich) in water (VWR)) and 90% mobile phase B (10 mM ammonium hydroxide in 75:25 v/v acetonitrile/methanol (VWR)) followed by a 10 min linear gradient to 100% mobile phase A. The ion spray voltage was −4.5 kV and the source temperature was 500°C. Raw data were processed using MultiQuant 2.1 software (AB SCIEX, Framingham MA) for automated peak integration. LC-MS data were processed and visually inspected using TraceFinder 3.1 software (Thermo Fisher Scientific; Waltham, MA).
Assessment of BAT protein thiol redox status using Iodo-TMT
Following the relevant in vivo intervention mouse BAT was rapidly excised and homogenized in 20% (w/v) TCA to stabilize thiols. The homogenate was incubated on ice for 30 min and then pelleted for 30 min at 16000 g at 4 °C. The pellet was washed with 10% and 5% (w/v) TCA and then resuspended in 80 μl denaturing alkylating buffer (DAB; 6 M urea, 2% (w/v) SDS, 200 mM Tris-HCl, 10 mM EDTA, 100 μM DTPA, 10 μM neocuprine). The contents of one vial of Iodo-TMT6 reagent (Thermo Scientific) was added to each of three biological replicate samples to label reduced cysteine residues at 37 °C and 1400 rpm for 1 h. Sample protein was precipitated with 5 volumes of ice-cold acetone, incubated at −20 °C for 2 h, and pelleted at 4 °C and 16000 g for 30 min. The amount of protein to be processed was optimized to ensure saturation of thiol labelling by the Iodo-TMT reagent as per the manufacturer’s instructions. The pellet was washed twice with ice-cold acetone and then re-solubilized in 80 μl DAB containing 1 mM tris(2- carboxyethyl)phosphine (TCEP), reducing previously reversibly oxidised cysteine residues in the presence of a second, distinct Iodo-TMT6 reagent. Proteins were incubated at 37 °C and 1400 rpm for 1h, precipitated and resuspended for protease digestion. Following digestion, Iodo-TMT labeled cysteine-containing peptides were enriched using the anti-TMT resin as per the manufacturers instructions.
Profiling of redox sensitive protein targets
Proteins with cysteine thiols exhibiting differential redox status (defined as > 10% shift in cysteine oxidation status upon cold exposure) were assessed for Gene Ontology (GO) term enrichment39. The total identified population of cysteine thiol containing proteins was utilized as the reference background. Enriched GO terms were filtered after benjamini-hochberg correction at an adjusted p-value < 0.1. All data analysis was performed using R (R Core Team, Vienna, Austria, http://www.R-project.org).
Assessment of protein thiol sulfenic acids
Following the relevant interventions, tissue or cellular samples were prepared adapting a protocol used previously to stabilize endogenous protein sulfenic acids40. Briefly, samples were homogenized in 50 mM Tris base, containing 100 mM NaCl, 100 μM DTPA, 0.1% SDS, 0.5% sodium doxycholate, 0.5% Triton-X 100, 5 mM dimedone. To minimize lysis-dependent oxidation, buffers were bubbled with argon prior to use. Samples were incubated for 15 min at room temperature, at which point SDS was added to a final concentration of 1% and samples were incubated for a further 15 min. Following dimedone treatment, 10 mM TCEP and 50 mM NEM were added and samples were incubated for a further 15 min at 37 °C to reduce and alkylate all non-sulfenic acid protein cysteine residues. Protein sulfenic acids were then assessed by immunoblotting against dimedone (1:1000 antibody dilution).
Targeted assessment of UCP1 cysteine sulfenylation status using dimedone-MS
Following dimedone and NEM labelling of samples as described above, samples were resolved by SDS-PAGE and bands in the UCP1 containing region of the gel (30 – 35 kDa) were excised, destained with acetonitrile and subjected to dehydration by speed vacuum concentrator. Gel bands were rehydrated with digestion buffer (75 uL of 50 mM HEPES and 500 ng of trypsin (Promega) and subjected to 12 hrs of digestion at 37 °C. Peptides were extracted and labeled with TMT 10 reagents (Thermo Fisher) as previously described41.
Protein digestion
Protein pellets were dried and resuspended in 8 M urea containing 50 mM HEPES (pH 8.5). Protein concentrations were measured by BCA assay (Thermo Scientific) prior to protease digestion. Protein lysates were diluted to 4 M urea and digested with LysC (Wako, Japan) in a 1/100 enzyme/protein ratio overnight. Protein extracts were diluted further to a 1.0 M urea concentration, and trypsin (Promega) was added to a final 1/200 enzyme/protein ratio for 6 hours at 37 °C. Digests were acidified with 20 μL of 20% formic acid (FA) to a pH ~2, and subjected to C18 solid-phase extraction (Sep-Pak, Waters).
LC-MS/MS parameters
All spectra were acquired using an Oribtrap Fusion mass spectrometer (Thermo Fisher) in line with an Easy-nLC 1000 (Thermo Fisher Scientific) ultra-high pressure liquid chromatography pump. Peptides were separated onto a 100 μM inner diameter column containing 1 cm of Magic C4 resin (5 μm, 100 Å, Michrom Bioresources) followed by 30 cm of Sepax Technologies GP-C18 resin (1.8 μm, 120 Å) with a gradient consisting of 9–30% (ACN, 0.125% FA) over 180 min at ~250 nl/min. For all LC-MS/MS experiments, the mass spectrometer was operated in the data-dependent mode. We collected MS1 spectra at a resolution of 120,000, with an AGC target of 150,000 and a max injection time of 100 ms. The ten most intense ions were selected for MS2 (excluding 1 z ions). MS1 precursor ions were excluded using a dynamic window (75 seconds +/− 10 ppm). The MS2 precursors were isolated with a quadrupole mass filter set to a width of 0.5 Th. For the MS3 based TMT quantitation, MS2 spectra were collected at an AGC of 4,000, max injection time of 150 ms, and CID collision energy of 35%. MS3 spectra were acquired with the same Orbitrap parameters as the MS2 method except HCD collision energy was increased to 55%. Synchronous-precursor-selection (SPS) was enabled to include up to six MS2 fragment ions for the MS3 spectrum.
Data processing and MS2 spectra assignment
A compilation of in-house software was used to convert .raw files to mzXML format, as well as to adjust monoisotopic m/z measurements and erroneous peptide charge state assignments. Assignment of MS2 spectra was performed using the SEQUEST algorithm42. All experiments utilized the Mouse UniProt database (downloaded 4/10/2014) where reversed protein sequences and known contaminants such as human keratins were appended. SEQUEST searches were performed using a 20 ppm precursor ion tolerance, while requiring each peptide’s N/C terminus to have trypsin protease specificity and allowing up to two missed cleavages. Iodo-TMT tags on cysteine residues residues (+329.226595 Da) was set as static modifications, while methionine oxidation (+15.99492 Da) was set as variable modifications. For targeted assessment of UCP1 cysteine sulfenylation, TMT tags on lysine residues and peptide N termini (+ 229.16293 Da), NEM on cysteine residues (+ 125.047679 Da) were set as static modifications and oxidation of methionine residues (+ 15.99492 Da) and dimedone on cysteine residues (+ 13.020401 Da versus NEM) as variable modifications. Determination of sulfenylation status of the Cys253 peptide was determined by comparing TMT reporter ion abundance of the dimedone-alkylated and NEM-alkylated peptides as a proportion of total precursor ion intensity. An MS2 spectra assignment false discovery rate (FDR) of less than 1% was achieved by applying the target-decoy database search strategy43. Protein filtering was performed using an in-house linear discrimination analysis algorithm to create one combined filter parameter from the following peptide ion and MS2 spectra metrics: XCorr, ΔCn score, peptide ion mass accuracy, peptide length and missed-cleavages44. Linear discrimination scores were used to assign probabilities to each MS2 spectrum for being assigned correctly, and these probabilities were further used to filter the dataset to a 1% protein-level false discovery rate.
Determination of Iodo-TMT reporter ion intensities and quantitative data analysis
For quantification, a 0.03 m/z window centered on the theoretical Th value of each reporter ion was utilized for the nearest signal intensity. Reporter ion intensities were adjusted to correct for the isotopic impurities from the different TMT reagents (manufacturer specifications). The signal to noise values for all peptides were summed within each TMT channel. For each peptide, a total minimum sum signal to noise value of 200 and an isolation purity greater than 70% was required45. Percentage cysteine oxidation status of protein thiols was calculated as the percentage of the cysteine containing peptide (total or mitochondrial) labeled with Iodo-TMT(129,130,131) for each condition over the sum of the reduced peptide labeled with Iodo-TMT(126,127,128) plus reversibly oxidized labeled peptide (129,130,131): (Oxidized peptide 129,130,131)/(reduced peptide 126,127,128 + oxidized peptide 129,130,131) × 100.
Primary brown adipocyte preparation and differentiation
Interscapular brown adipose stromal vascular fraction was obtained from 2–6 day old pups as described previously46. Interscapular brown adipose was dissected, washed in PBS, minced, and digested for 45 min at 37 °C in PBS containing 1.5 mg ml−1 collagenase B, 123 mM NaCl, 5 mM KCl, 1.3 mM CaCl2, 5 mM glucose, 100 mM HEPES, and 4 % essentially fatty acid-free BSA. Tissue suspension was filtered through a 40 μm cell strainer and centrifuged at 600 g for 5 min to pellet the SVF. The cell pellet was resuspended in adipocyte culture medium and plated. Primary brown preadipocytes were counted and plated in the evening, 12 hr before differentiation at 15,000 cells per well of a seahorse plate. Preadiopyce plating was scaled according to surface area. The following morning brown preadipocytes were induced to differentiate for two days with an adipogenic cocktail (1 μM rosiglitazone, 0.5 mM IBMX, 5 μM dexamethasone, 0.114 μg ml−1 insulin, 1 nM T3, and 125 μM Indomethacin) in adipocyte culture medium. Two days following induction, cells were re-fed every 48 hours with adipocyte culture medium containing 1 μM rosiglitazone and 0.5 μg ml−1 insulin. Cells were fully differentiated by day 5 post-induction.
Cellular respirometry of primary brown adipocytes
Cellular OCR of primary brown adipocytes was determined using a Seahorse XF24 Extracellular Flux Analyzer. Adipocytes were plated and differentiated in XF24 V7 cell culture microplates. Prior to analysis adipocyte culture medium was changed to respiration medium consisting of DMEM lacking NaHCO3 (Sigma), 1.85 g L−1 NaCl, 3 mg L−1 phenol red, 2% fatty acid free BSA, and 1 mM sodium pyruvate, pH 7.4. Basal respiration was determined to be the OCR in the presence of substrate (1 mM sodium pyruvate) alone. ATP-synthase independent respiration was determined following addition of 2.5 μM oligomycin. Leak respiration was determined following addition of 2.5 μM oligomycin and 100 nM NE. Maximal respiration was determined following addition of 2 μM FCCP. To determine OCR following plasma membrane permeabilization, cells were treated with 50 μg/ml saponin, and sequestration of free fatty acids following permeabilization was achieved through addition of 2 % fatty acid free BSA.
Cloning, construct design, and site-directed mutagenesis
RNA from murine BAT was reverse-transcribed and used as template for PCR of Ucp1. Sequences for Ucp1 amplification were as follows: sense: CAC CAT GGT GAA CCC GAC AAC TTC C; antisense: TTA TGT GGT ACA ATC CAC TG. PCR fragments were gel-purified and cloned into the pENTR™/D-TOPO® entry vector according to the manufacturer’s instructions (Invitrogen; K2400). Cloned Ucp1 was shuttled into the pAd/CMV/V5-DEST Gateway® vector, and confirmed by sequencing. Cysteine mutants were generated using the Quik-Change site-directed mutagenesis kit (Stratagene). Primers for generating mutants are as follows: Ucp1 C24A forward 5′-AGCCGGAGTTTCAGCTGCCCTGGCAGATATCATC-3′, reverse 5′-GATGATATCTGCCAGGGCAGCTGAAACTCCGGCT-3′; Ucp1 C188A forward 5′-TGAGAAATGTCATCATCAATGCTACAGAGCTGGTAACATATG-3′, reverse 5′-CATATGTTACCAGCTCTGTAGCATTGATGATGACATTTCTCA-3′; UCP1 C213A forward 5′-TGGCAGATGACGTCCCCGCCCATTTACTGTCAGCTC-3′, reverse 5′-GAGCTGACAGTAAATGGGCGGGGACGTCATCTGCCA-3′; Ucp1 C224A forward 5′-TCTTGTTGCCGGGTTTGCCACCACACTCCTGGCC-3′, reverse 5′-GGCCAGGAGTGTGGTGGCAAACCCGGCAACAAGA-3′; Ucp1 C253A forward 5′-CCCAAGCGTACCAAGCGCTGCGATGTCCATGTAC-3′, reverse 5′-GTACATGGACATCGCAGCGCTTGGTACGCTTGGG-3′; Ucp1 C287A forward 5′-GGAACGTCATCATGTTTGTGGCCTTTGAACAGCTGAAAAAAG-3′, reverse 5′-CTTTTTTCAGCTGTTCAAAGGCCACAAACATGATGACGTTCC-3′; Ucp1 C304A forward 5′-CAGACAGACAGTGGATGCTACCACATAAGGATCC-3′, reverse 5′-GGATCCTTATGTGGTAGCATCCACTGTCTGTCTG-3′.
Production of adenovirus and transduction of cysteine-null UCP1 mutants
pAd/CMV/V5-DEST/Ucp1 was linearized with PacI and transfected (3 μg) into 293A cells with lipofectamine® 2000 (Invitrogen). Crude adenovirus was generated according to the manufacturer’s instructions (Invitrogen; V493-20). Crude adenovirus was amplified by infecting 293A cells, and purified using the Fast Trap Adenovirus Purification and Concentration Kit (EMD Millipore). Virus was quantified by examining viral DNA. Briefly, viral particles were treated with Proteinase K and DNA was isolated with phenol and chloroform/isoamylalcohol (24:1). Preliminary experiments with titrations of viral transductions in Ucp1−/− adipocytes were used to determine the amount of virus yielding a Ucp1 mRNA and protein level similar to the level detected from Ucp1+/+ adipocytes. For subsequent experiments, primary brown adipocytes were transduced with purified adenovirus in the evening of day 3 post-differentiation with medium replacement the following morning. Adipocytes were used for experiments on day 5 post-differentiation.
Structural modeling of UCP1
A comparative model of UCP1 was built by using the structure of the bovine AAC19. This structure corresponds to the “c-state” of the carrier - open to the MIM. The protein sequence of human UCP1 was taken from UniProt. To align the AAC and UCP1 sequences, MUSCLE47 and manual editing in Jalview48 were used. To improve the quality of the comparative models, the alignments were edited to remove the N- and C-terminal residues of the UCP1 sequences that do not align with resolved residues in the AAC structure, and to place gaps in the UCP1 sequences so as to minimize the distance between these residues in the initial target structure. Fifty comparative models of human UCP1 were built from the AAC structure and the sequence alignment by using MODELLER. The structure with the lowest MODELLER energy score was taken as the best representative structure. The cardiolipin molecules of the AAC were added to the modeled UCP1 structure by aligning the two structures, and copying the lipid molecules21,22,49. This structure was examined and figures produced by using the PyMOL molecular visualization system (The PyMOL Molecular Graphics System, Version 1.4.1, Schrödinger, LLC.).
Assessment of superoxide production in primary brown adipocytes
ROS production was estimated by oxidation of DHE and ratiometric assessment as described previously35. Cells were plated and differentiated onto 96-well plates suitable for fluorescence analysis. Prior to imaging, cell media was removed and replaced with imaging buffer (156 mM NaCl, 1.25 mM KH2PO4, 3 mM KCl, 2 mM MgCl2, 10 mM HEPES, pH 7.4) supplemented with 10 mM sodium pyruvate. Cells were loaded with 5 μM DHE (Invitrogen), which remained present throughout the timecourse. DHE was excited at 355 nm and the emitted signal was acquired at 460 nm. Oxidized DHE was excited at 544 nm and emission was acquired at 590 nm.
Assessment of mitochondrial membrane potential in permeabilized primary brown adipocytes
Mitochondrial membrane potential was measured in permeabilized cells using TMRM (Life Technologies) in dequench mode. In this mode, mitochondrial depolarization causes redistribution of a high concentration of signal quenched TMRM from mitochondria to the cytosol, such that the lower concentration results in dequenching and an increase in fluorescence50. Cells were pre-loaded at room temperature with imaging buffer containing 1 μM TMRM. TMRM fluorescence was excited at 544 nm and emission was collected at 590 nm.
Quantitative RT-PCR
Total RNA was extracted from frozen tissue using TRIzol (Invitrogen), purified with RNeasy Mini spin columns (QIAGEN) and reverse transcribed using a High-Capacity cDNA Reverse Transcription kit (Applied Biosystems). The resultant cDNA was analyzed by qRT–PCR. Briefly, 20 ng cDNA and 150 nmol of each primer were mixed with SYBR GreenER™ qPCR SuperMix (Applied Biosystems). Reactions were performed in a 384-well format using an ABI PRISM 7900HT real time PCR system (Applied Biosystems). Relative mRNA levels were calculated using the comparative CT method and normalized to cyclophilin mRNA. The following primers were used in these studies: Cyclophilin forward: 5′-GGA GAT GGC ACA GGA GGA A-3′, reverse: 5′-GCC CGT AGT GCT TCA GCT T-3′; Ucp1 forward 5′-ACTGCCACACCTCCAGTCATT-3′, reverse 5′-CTTTGCCTCACTCAGGATTGG-3′; Dio2 forward 5′-CAGTGTGGTGCACGTCTCCAATC-3′, reverse 5′-TGAACCAAAGTTGACCACCAG-3′; Pgc1α forward 5′-CCCTGCCATTGTTAAGACC-3′, reverse 5′-TGCTGCTGTTCCTGTTTTC-3′; PPARγ forward 5′-TGAAAGAAGCGGTGAACCACTG-3′, reverse 5′-TGGCATCTCTGTGTCAACCATG-3′; Pgc1β forward 5′-CTGACGTGGACGAGCTTTCA-3′, reverse 5′-CGTCCTTCAGAGCGTCAGAG-3′; Nrf2 forward 5′-CCAGCTACTCCCAGGTTGCC-3′, reverse 5′-GGGATATCCAGGGCAAGCGA-3′; Ap2 5′-AAGGTGAAGAGCATCATAACCCT-3′, reverse 5′-TCACGCCTTTCATAACACATTCC-3′.
Glycerol release
Adipocytes were incubated in respiration medium absent BSA and treated with indicated concentrations of NE for 2 h prior to collection of medium and quantification of glycerol using free glycerol reagent (Sigma-Aldrich) relative to glycerol standard and normalized to protein content.
Immunoblot analysis
Immunodetection following SDS-PAGE utilized the following antibodies: UCP1 (Abcam ab10983), Prx3 (Abcam ab16751), Dimedone (Millipore 07-2139), Vinculin (Sigma V9264), ATP5A and NDUFB8 (Abcam ab110413), ATGL (CST 2138), ATGL pS406 (Abcam ab135093), HSL (CST 4107), HSL pS660 (CST 4126), pPKA substrate (CST 9624s), PPARγ (CST 2435S).
Statistical Analyses
Data were expressed as mean ± s.e.m. and P values were calculated using two-tailed Student’s t-test for pairwise comparisons, one-way analysis of variance (ANOVA) for multiple comparisons, and two-way ANOVA for multiple comparisons involving two independent variables. ANOVA analyses were subjected to Bonferroni’s post-hoc test. Sample sizes were determined on the basis of previous experiments using similar methodologies. For in vivo studies, mice were randomly assigned to treatment groups. Mass spectrometric analyses were blinded to experimental conditions.
Extended Data
Extended Data Figure 1.
Assessing superoxide in brown adipocytes and effect of mitochondria-targeted compounds on shivering, body temperature, and movement. a, NE stimulates superoxide dependent oxidation of DHE in primary brown adipocytes (n = 5). b, Effect of i.p. decyl-TPP on core body temperature following acute cold exposure (n = 10). c,d Representative (c) raw and (d) RMS mouse EMG traces at thermoneutrality and following acute cold exposure ± MitoQ, NAC, or curare (0.3 mg/kg). e, Quantification of muscle burst frequency as determined by EMG at thermoneutrality and following acute cold exposure ± MitoQ or NAC (n = 3). f, Absolute VO2 consumed immediately prior to acute CL treatment described in Fig. 1f (n = 5). g, Effect of i.p CL ± MitoQ on movement as assessed by number of beam breaks (n = 8). NS, not significant. Data are mean ± s.e.m. of at least three replicates. *P < 0.05, **P < 0.01, ***P<0.001 (two-tailed Student’s t-test for pairwise comparisons, one-way ANOVA for multiple comparisons, two-way ANOVA for multiple comparisons involving two independent variables).
Extended Data Figure 2.
Assessing thiol redox status in vivo and the effect of NAC on movement. a, Mass spectrometric quantification of BAT reduced and oxidized glutathione at thermoneutrality and following acute cold exposure (n = 5). b, Scheme for quantitative assessment of protein thiol redox status by ratiometric labeling of BAT protein cysteine thiols. In vivo BAT thiol status is stabilized by protein precipitation in 20% TCA31. Unmodified cysteine thiols are labeled with “light” Iodo-TMT tags (126,127,128). Following removal of light Iodo-TMT, reversibly modified protein thiols are reduced with TCEP in the presence of “heavy” Iodo-TMT (129,130,131). Samples are combined and subjected to trypsin digestion. Ratiometric assessment of Iodo-TMT labeled peptides provides a quantitative profile of overall protein cysteine thiol redox status. c, Average % oxidation status of total BAT and BAT mitochondrial protein thiols at thermoneutrality and following acute cold exposure (n = 3). d, Effect of i.p NAC on movement as assessed by number of beam breaks (vehicle, n = 11; NAC, n = 7). Data are mean ± s.e.m. of at least three replicates. *P < 0.05, ***P<0.001 (two-tailed Student’s t-test for pairwise comparisons, one-way ANOVA for multiple comparisons, two-way ANOVA for multiple comparisons involving two independent variables).
Extended Data Figure 3.
Assessing thermogenic gene expression, adrenergic response parameters, and strategy for UCP1 cysteine thiol redox status. a, b, Quantitative polymerase chain reaction (qPCR) analysis of mRNA of proteins involved in thermogenesis in (a) BAT and (b) iWAT (n = 5). c, d, Immunoblot analysis of (c) PPARγ and (d) lipolytic phosphorylation cascade in BAT following cold exposure ± MitoQ. e, f, Raw OCR of primary brown adipocytes under basal conditions and following NE stimulation + oligomycin to determine leak respiration ± (e) MitoQ (n = 10) or (f) NAC (vehicle and 1 mM NAC n = 8; 0.1 mM NAC n = 7). g,h, OCR of primary brown adipocytes lacking UCP1 under basal conditions and following NE stimulation + oligomycin ± (g) MitoQ (n = 10) and (h) NAC (n = 10). i, Cys-redox mass shift strategy. Following in vivo interventions mouse BAT is excised and unmodified protein thiols are labeled with N-ethylmaleimide (NEM), following which reversibly oxidized thiols are chemically reduced and labeled with polyethyleneglycol maleimide (PEG-Mal) allowing for determination of cysteine oxidation status on UCP1. Data are mean ± s.e.m. of at least five replicates. *P < 0.05, **P < 0.01, (two-tailed Student’s t-test for pairwise comparisons, one-way ANOVA for multiple comparisons, two-way ANOVA for multiple comparisons involving two independent variables).
Extended Data Figure 4.
Assessing UCP1 reversible cysteine oxidation status in vivo by immunoblot and mass spectrometry. a, Calibration of UCP1 cysteine gel shift immunoblot. Calibration of cysteine-dependent shifts by incubation of BAT protein with TCEP and different ratios of NEM and PEG-Mal indicates that a single PEG-mal labelling event shifts UCP1 by ~10 kDa above the native molecular weight. b, Calibration of UCP1 cysteine oxidation status indicates that the gel shift observed upon cold exposure (lane 1) is cysteine dependent, as TCEP pretreatment results in a loss of the shift (lane 2). In addition, the cysteine-dependent mass shift is due to a single oxidation event as determined by including the calibrating markers (lanes 4–6). c, Calibration of specificity of UCP1 antibody in BAT. d, Reducing and non-reducing SDS-PAGE analysis of UCP1 to monitor cysteine dependent and independent inter-protein interactions during acute cold exposure. e, Scheme for identification of sulfenylated cysteines on UCP1 by dimedone labeling and mass spectrometry. Following acute cold exposure BAT protein thiols are differentially alkylated with dimedone to selectively label sulfenylated thiols and NEM to label non-sulfenylated thiols. Samples are subjected to trypsin digestion, followed by Lys-TMT labeling, and MS quantification of UCP1 cysteine containing peptides in their dimedone and NEM alkylated forms. Two technical points should be noted in this strategy when interpreting relative quantitation of NEM and dimedone-alkylated peptides. First, these differently alkylated peptides may not necessarily ionize with the same efficiency. Second, NEM is reported to react with sulfenic acids albeit less efficiently than with free thiols32, which should be factored in when considering the order of addition of dimedone/NEM and potential underestimation of sulfenylation status. f, (Top) Amino acid sequence alignment of UCP1 proteins highlighting the candidate cysteine residues contained within the mouse protein and their level of conservation across various species. (Bottom) Summary of MS determination of UCP1 cysteine sulfenylation status. Six of seven UCP1 cysteines were identified, with all but one being identified exclusively in the unmodified (NEM-alkylated state). Cys253 is identified as dimedone labeled, indicating that it is a site for sulfenylation.
Extended Data Figure 5.
Structure of human UCP1 modeled on the AAC crystal structure including bound cardiolipin and sulfenylation on Cys253. a, Entire UCP1 modeled structure including bound cardiolipin (green), and Cys253 in the oxidized sulfenic acid form. b, UCP1 region containing Cys253 in the oxidized sulfenic acid form. Cys253 localizes to a hydrophobic pocket between two matrix facing helices. Hydrophobic residues (pink) surround the Cys253 thiol, and a hydrogen bond between Arg238 and Glu261 (aqua) is proximal. These residues that stabilize interaction between the matrix facing helices are likely important for stabilization of the purine bound “c-state” of the carrier. Two separate cardiolipin (green) binding domains are localized proximal to Cys253 within the UCP1 modeled structure.
Extended Data Figure 6.
Assessing transduced UCP1 constructs, OCR, and sulfenylation in brown adipocytes. a, qPCR analysis of UCP1 mRNA in wildtype (WT), and UCP1−/− brown adipocytes transduced with WT and cysteine null UCP1 mutants (n = 4). b, Immunoblot of UCP1 protein in WT and UCP1−/− brown adipocytes transduced with WT and cysteine null UCP1 mutants. c, Immunoblot analysis of UCP1 protein in UCP1−/− brown adipocytes transduced with C224A/C253A double mutant compared to WT. d, Densitometry analysis of transduced UCP1 forms relative to WT across separate transduction experiments (n = 4; C224A/C253A n = 3). e,f, Summary of basal (e) and maximal (f) OCR of primary brown adipocytes containing cysteine-null UCP1 mutants. Raw OCR values provided in Extended Data Fig. 7. g, Immunodetection of protein sulfenic acid levels in primary brown adipocytes in the seconds following treatment with 100 nM NE. h, Timecourse of brown adipocyte OCR following stimulation with 100 nM NE (n = 12). Data are mean ± s.e.m. of at least three replicates.
Extended Data Figure 7.
Assessing OCR under basal and FCCP stimulated maximal respiration, and following NE stimulation + oligomycin in UCP1−/− primary brown adipocytes transduced with UCP1 cysteine null mutants. a–g, Raw basal, maximal, and UCP1-dependent OCR from representative experiments of WT and UCP1−/− brown adipocytes transduced with (a) UCP1 C24A (WT n = 11; C24A n = 12), (b) C188A (n = 7), (c) UCP1 C213A (n = 19), (d) UCP1 C287A (WT n = 9; C287A n = 10), (e) UCP1 C304A (WT n = 7; C304A n = 10), (f) UCP1 C224A (WT n = 9; C224A n = 10), (g) UCP1 C224A/C253A (n = 8). Data are mean ± s.e.m. of at least seven replicates. **P < 0.01, (two-tailed Student’s t-test for pairwise comparisons)
Extended Data Figure 8.
Assessing UCP1-dependent respiration and uncoupling following increasing degrees of adrenergic stimulus. a, glycerol release from brown adipocytes as an index of adrenergic stimulus and lipolysis in response to increasing concentrations of NE (n = 4; 0 and 2000 nM NE n = 6). b, Representative raw NE + oligomycin leak OCR values in WT and UCP1−/− brown adipocytes following stimulation with a range of NE concentrations indicates that UCP1-dependent leak respiration is consistently ~25–35% of total leak OCR (50 nM n = 9; 100 nM n = 7; 500 nM n = 8; 2000 nM n = 6) c, Assessment of UCP1-dependent leak respiration following stimulation by various concentrations of NE + oligomycin. Comparison of WT and UCP1−/− OCR (replotted data from Fig. 4 for comparison) indicates that UCP1-dependent respiration is consistently ~25–35% of leak respiration. Comparison of UCP1 WT and C224A indicates that degree of UCP1 inhibition by C224A is relatively stable across various NE concentrations (n = 8; C224A 100 nM NE n = 9, 2,000 nM NE n = 14). d, Plasma membrane permeabilized OCR of brown adipocytes ± endogenous fatty acid depletion with BSA (WT n = 30; KO n = 20; C224A n = 9; C253A n = 8; C224A/C253A n = 10). e, Comparison of UCP1-dependent uncoupling absent purine nucleotide inhibition in plasma membrane permeabilized brown adipocytes (n = 6; C224A/C253A, KO n = 4). f, Comparison of UCP1-dependent uncoupling following titration of GDP in permeabilized adipocytes containing WT UCP1, UCP1 C224A, C253A, and C224A/C253A (n = 6; C224A/C253A n = 12). Data are mean ± s.e.m. of at least four replicates. *P < 0.05, **P < 0.01, ***P<0.001 (two-tailed Student’s t-test for pairwise comparisons, one-way ANOVA for multiple comparisons).
Supplementary Material
Acknowledgments
Supported by the JPB Foundation and National Institutes of Health (DK31495) to B.M.S. and by grants from Human Frontiers Science Program (E.T.C) and the Canadian Institutes for Health Research (L.K). We gratefully acknowledge Mike Murphy, Yuriy Kirichok, and Ambre Bertholet for many helpful discussions. We also thank Mike Murphy for providing MitoQ.
Footnotes
Author Contributions: E.T.C designed research, carried out biochemical, cellular, and in vivo experiments, analyzed data and co-wrote the paper. L.K designed and carried out cellular and mutagenesis experiments. M.P.J and K.A.P carried out and analyzed data from mass spectrometric experiments. G.Z.L carried out cellular experiments. C.B.C and S.P.G oversaw mass spectrometric experiments. A.J.R designed and carried out structural modeling. E.T.C and B.M.S directed the research and co-wrote the paper, with assistance from all other authors.
References
- 1.Nicholls DG. The physiological regulation of uncoupling proteins. Biochimica et biophysica acta. 2006;1757:459–466. doi: 10.1016/j.bbabio.2006.02.005. [DOI] [PubMed] [Google Scholar]
- 2.Divakaruni AS, Brand MD. The regulation and physiology of mitochondrial proton leak. Physiology. 2011;26:192–205. doi: 10.1152/physiol.00046.2010. [DOI] [PubMed] [Google Scholar]
- 3.Yoneshiro T, et al. Recruited brown adipose tissue as an antiobesity agent in humans. The Journal of clinical investigation. 2013;123:3404–3408. doi: 10.1172/JCI67803. [DOI] [PMC free article] [PubMed] [Google Scholar]
- 4.Wu J, et al. Beige adipocytes are a distinct type of thermogenic fat cell in mouse and human. Cell. 2012;150:366–376. doi: 10.1016/j.cell.2012.05.016. [DOI] [PMC free article] [PubMed] [Google Scholar]
- 5.Cox AG, Peskin AV, Paton LN, Winterbourn CC, Hampton MB. Redox potential and peroxide reactivity of human peroxiredoxin 3. Biochemistry. 2009;48:6495–6501. doi: 10.1021/bi900558g. [DOI] [PubMed] [Google Scholar]
- 6.Rodriguez-Cuenca S, et al. Consequences of long-term oral administration of the mitochondria-targeted antioxidant MitoQ to wild-type mice. Free radical biology & medicine. 2010;48:161–172. doi: 10.1016/j.freeradbiomed.2009.10.039. [DOI] [PubMed] [Google Scholar]
- 7.Cannon B, Nedergaard J. Nonshivering thermogenesis and its adequate measurement in metabolic studies. The Journal of experimental biology. 2011;214:242–253. doi: 10.1242/jeb.050989. [DOI] [PubMed] [Google Scholar]
- 8.Ukropec J, Anunciado RP, Ravussin Y, Hulver MW, Kozak LP. UCP1-independent thermogenesis in white adipose tissue of cold-acclimated Ucp1−/− mice. The Journal of biological chemistry. 2006;281:31894–31908. doi: 10.1074/jbc.M606114200. [DOI] [PubMed] [Google Scholar]
- 9.Himms-Hagen J, et al. Effect of CL-316,243, a thermogenic beta 3-agonist, on energy balance and brown and white adipose tissues in rats. The American journal of physiology. 1994;266:R1371–1382. doi: 10.1152/ajpregu.1994.266.4.R1371. [DOI] [PubMed] [Google Scholar]
- 10.Collins Y, et al. Mitochondrial redox signalling at a glance. Journal of cell science. 2012;125:801–806. doi: 10.1242/jcs.098475. [DOI] [PubMed] [Google Scholar]
- 11.Seo YH, Carroll KS. Profiling protein thiol oxidation in tumor cells using sulfenic acid-specific antibodies. Proceedings of the National Academy of Sciences of the United States of America. 2009;106:16163–16168. doi: 10.1073/pnas.0903015106. [DOI] [PMC free article] [PubMed] [Google Scholar]
- 12.Finkel T. From sulfenylation to sulfhydration: what a thiolate needs to tolerate. Science signaling. 2012;5:pe10. doi: 10.1126/scisignal.2002943. [DOI] [PubMed] [Google Scholar]
- 13.Atkuri KR, Mantovani JJ, Herzenberg LA, Herzenberg LA. N-Acetylcysteine--a safe antidote for cysteine/glutathione deficiency. Current opinion in pharmacology. 2007;7:355–359. doi: 10.1016/j.coph.2007.04.005. [DOI] [PMC free article] [PubMed] [Google Scholar]
- 14.Wikstrom JD, et al. Hormone-induced mitochondrial fission is utilized by brown adipocytes as an amplification pathway for energy expenditure. The EMBO journal. 2014;33:418–436. doi: 10.1002/embj.201385014. [DOI] [PMC free article] [PubMed] [Google Scholar]
- 15.Li Y, Fromme T, Schweizer S, Schottl T, Klingenspor M. Taking control over intracellular fatty acid levels is essential for the analysis of thermogenic function in cultured primary brown and brite/beige adipocytes. EMBO reports. 2014;15:1069–1076. doi: 10.15252/embr.201438775. [DOI] [PMC free article] [PubMed] [Google Scholar]
- 16.Requejo R, et al. Measuring mitochondrial protein thiol redox state. Methods in enzymology. 2010;474:123–147. doi: 10.1016/S0076-6879(10)74008-8. [DOI] [PubMed] [Google Scholar]
- 17.Martinez-Acedo P, Gupta V, Carroll KS. Proteomic analysis of peptides tagged with dimedone and related probes. Journal of mass spectrometry: JMS. 2014;49:257–265. doi: 10.1002/jms.3336. [DOI] [PMC free article] [PubMed] [Google Scholar]
- 18.Nelson KJ, et al. Use of dimedone-based chemical probes for sulfenic acid detection methods to visualize and identify labeled proteins. Methods in enzymology. 2010;473:95–115. doi: 10.1016/S0076-6879(10)73004-4. [DOI] [PMC free article] [PubMed] [Google Scholar]
- 19.Pebay-Peyroula E, et al. Structure of mitochondrial ADP/ATP carrier in complex with carboxyatractyloside. Nature. 2003;426:39–44. doi: 10.1038/nature02056. [DOI] [PubMed] [Google Scholar]
- 20.Fedorenko A, Lishko PV, Kirichok Y. Mechanism of fatty-acid-dependent UCP1 uncoupling in brown fat mitochondria. Cell. 2012;151:400–413. doi: 10.1016/j.cell.2012.09.010. [DOI] [PMC free article] [PubMed] [Google Scholar]
- 21.Lee Y, Willers C, Kunji ER, Crichton PG. Uncoupling protein 1 binds one nucleotide per monomer and is stabilized by tightly bound cardiolipin. Proceedings of the National Academy of Sciences of the United States of America. 2015;112:6973–6978. doi: 10.1073/pnas.1503833112. [DOI] [PMC free article] [PubMed] [Google Scholar]
- 22.Ruprecht JJ, et al. Structures of yeast mitochondrial ADP/ATP carriers support a domain-based alternating-access transport mechanism. Proceedings of the National Academy of Sciences of the United States of America. 2014;111:E426–434. doi: 10.1073/pnas.1320692111. [DOI] [PMC free article] [PubMed] [Google Scholar]
- 23.Modriansky M, Murdza-Inglis DL, Patel HV, Freeman KB, Garlid KD. Identification by site-directed mutagenesis of three arginines in uncoupling protein that are essential for nucleotide binding and inhibition. The Journal of biological chemistry. 1997;272:24759–24762. doi: 10.1074/jbc.272.40.24759. [DOI] [PubMed] [Google Scholar]
- 24.Divakaruni AS, Humphrey DM, Brand MD. Fatty acids change the conformation of uncoupling protein 1 (UCP1) The Journal of biological chemistry. 2012;287:36845–36853. doi: 10.1074/jbc.M112.381780. [DOI] [PMC free article] [PubMed] [Google Scholar]
- 25.Arechaga I, et al. Cysteine residues are not essential for uncoupling protein function. The Biochemical journal. 1993;296(Pt 3):693–700. doi: 10.1042/bj2960693. [DOI] [PMC free article] [PubMed] [Google Scholar]
- 26.Echtay KS, et al. Superoxide activates mitochondrial uncoupling proteins. Nature. 2002;415:96–99. doi: 10.1038/415096a. [DOI] [PubMed] [Google Scholar]
- 27.Silva JP, et al. SOD2 overexpression: enhanced mitochondrial tolerance but absence of effect on UCP activity. The EMBO journal. 2005;24:4061–4070. doi: 10.1038/sj.emboj.7600866. [DOI] [PMC free article] [PubMed] [Google Scholar]
- 28.Mailloux RJ, Adjeitey CN, Xuan JY, Harper ME. Crucial yet divergent roles of mitochondrial redox state in skeletal muscle vs. brown adipose tissue energetics. FASEB journal: official publication of the Federation of American Societies for Experimental Biology. 2012;26:363–375. doi: 10.1096/fj.11-189639. [DOI] [PubMed] [Google Scholar]
- 29.Stuart JA, Harper JA, Brindle KM, Jekabsons MB, Brand MD. A mitochondrial uncoupling artifact can be caused by expression of uncoupling protein 1 in yeast. The Biochemical journal. 2001;356:779–789. doi: 10.1042/0264-6021:3560779. [DOI] [PMC free article] [PubMed] [Google Scholar]
- 30.Malingriaux EA, et al. Fatty acids are key in 4-hydroxy-2-nonenal-mediated activation of uncoupling proteins 1 and 2. PloS one. 2013;8:e77786. doi: 10.1371/journal.pone.0077786. [DOI] [PMC free article] [PubMed] [Google Scholar]
- 31.Held JM, et al. Targeted quantitation of site-specific cysteine oxidation in endogenous proteins using a differential alkylation and multiple reaction monitoring mass spectrometry approach. Molecular & cellular proteomics: MCP. 2010;9:1400–1410. doi: 10.1074/mcp.M900643-MCP200. [DOI] [PMC free article] [PubMed] [Google Scholar]
- 32.Reisz JA, Bechtold E, King SB, Poole LB, Furdui CM. Thiol-blocking electrophiles interfere with labeling and detection of protein sulfenic acids. The FEBS journal. 2013;280:6150–6161. doi: 10.1111/febs.12535. [DOI] [PMC free article] [PubMed] [Google Scholar]
- 33.Gospodarska E, Nowialis P, Kozak LP. Mitochondrial turnover: a phenotype distinguishing brown adipocytes from interscapular brown adipose tissue and white adipose tissue. The Journal of biological chemistry. 2015;290:8243–8255. doi: 10.1074/jbc.M115.637785. [DOI] [PMC free article] [PubMed] [Google Scholar]
- 34.Hodges MR, et al. Defects in breathing and thermoregulation in mice with near-complete absence of central serotonin neurons. The Journal of neuroscience: the official journal of the Society for Neuroscience. 2008;28:2495–2505. doi: 10.1523/JNEUROSCI.4729-07.2008. [DOI] [PMC free article] [PubMed] [Google Scholar]
- 35.Chouchani ET, et al. Ischaemic accumulation of succinate controls reperfusion injury through mitochondrial ROS. Nature. 2014;515:431–435. doi: 10.1038/nature13909. [DOI] [PMC free article] [PubMed] [Google Scholar]
- 36.Srere PA. Controls of citrate synthase activity. Life sciences. 1974;15:1695–1710. doi: 10.1016/0024-3205(74)90172-6. [DOI] [PubMed] [Google Scholar]
- 37.Hurd TR, et al. Inactivation of pyruvate dehydrogenase kinase 2 by mitochondrial reactive oxygen species. The Journal of biological chemistry. 2012;287:35153–35160. doi: 10.1074/jbc.M112.400002. [DOI] [PMC free article] [PubMed] [Google Scholar]
- 38.Townsend MK, et al. Reproducibility of metabolomic profiles among men and women in 2 large cohort studies. Clinical chemistry. 2013;59:1657–1667. doi: 10.1373/clinchem.2012.199133. [DOI] [PMC free article] [PubMed] [Google Scholar]
- 39.Huang da W, Sherman BT, Lempicki RA. Systematic and integrative analysis of large gene lists using DAVID bioinformatics resources. Nature protocols. 2009;4:44–57. doi: 10.1038/nprot.2008.211. [DOI] [PubMed] [Google Scholar]
- 40.Klomsiri C, et al. Use of dimedone-based chemical probes for sulfenic acid detection evaluation of conditions affecting probe incorporation into redox-sensitive proteins. Methods in enzymology. 2010;473:77–94. doi: 10.1016/S0076-6879(10)73003-2. [DOI] [PMC free article] [PubMed] [Google Scholar]
- 41.Kazak L, et al. A Creatine-Driven Substrate Cycle Enhances Energy Expenditure and Thermogenesis in Beige Fat. Cell. 2015;163:643–655. doi: 10.1016/j.cell.2015.09.035. [DOI] [PMC free article] [PubMed] [Google Scholar]
- 42.Eng JK, McCormack AL, Yates JR. An approach to correlate tandem mass spectral data of peptides with amino acid sequences in a protein database. Journal of the American Society for Mass Spectrometry. 1994;5:976–989. doi: 10.1016/1044-0305(94)80016-2. [DOI] [PubMed] [Google Scholar]
- 43.Elias JE, Gygi SP. Target-decoy search strategy for increased confidence in large-scale protein identifications by mass spectrometry. Nature methods. 2007;4:207–214. doi: 10.1038/nmeth1019. [DOI] [PubMed] [Google Scholar]
- 44.Huttlin EL, et al. A tissue-specific atlas of mouse protein phosphorylation and expression. Cell. 2010;143:1174–1189. doi: 10.1016/j.cell.2010.12.001. [DOI] [PMC free article] [PubMed] [Google Scholar]
- 45.McAlister GC, et al. MultiNotch MS3 enables accurate, sensitive, and multiplexed detection of differential expression across cancer cell line proteomes. Analytical chemistry. 2014;86:7150–7158. doi: 10.1021/ac502040v. [DOI] [PMC free article] [PubMed] [Google Scholar]
- 46.Kir S, et al. Tumour-derived PTH-related protein triggers adipose tissue browning and cancer cachexia. Nature. 2014;513:100–104. doi: 10.1038/nature13528. [DOI] [PMC free article] [PubMed] [Google Scholar]
- 47.Edgar RC. MUSCLE: multiple sequence alignment with high accuracy and high throughput. Nucleic acids research. 2004;32:1792–1797. doi: 10.1093/nar/gkh340. [DOI] [PMC free article] [PubMed] [Google Scholar]
- 48.Waterhouse AM, Procter JB, Martin DM, Clamp M, Barton GJ. Jalview Version 2--a multiple sequence alignment editor and analysis workbench. Bioinformatics. 2009;25:1189–1191. doi: 10.1093/bioinformatics/btp033. [DOI] [PMC free article] [PubMed] [Google Scholar]
- 49.Crichton PG, et al. Trends in thermostability provide information on the nature of substrate, inhibitor, and lipid interactions with mitochondrial carriers. The Journal of biological chemistry. 2015;290:8206–8217. doi: 10.1074/jbc.M114.616607. [DOI] [PMC free article] [PubMed] [Google Scholar]
- 50.Davidson SM, Yellon D, Duchen MR. Assessing mitochondrial potential, calcium, and redox state in isolated mammalian cells using confocal microscopy. Methods in molecular biology. 2007;372:421–430. doi: 10.1007/978-1-59745-365-3_30. [DOI] [PubMed] [Google Scholar]
Associated Data
This section collects any data citations, data availability statements, or supplementary materials included in this article.


