

Abstract
BACKGROUND
Functional Gastrointestinal Disorders (FGIDs) are among the most common outpatient diagnoses in pediatric primary care and gastroenterology. There is limited data on the inpatient burden of childhood FGIDs in the U.S. The aim of this study was to evaluate the inpatient admission rate, length of stay, and associated costs related to FGIDs from 1997–2009.
METHODS
We analyzed the Kids’ Inpatient Sample Database (KID) for all subjects in which constipation (ICD-9 codes: 564.0–564.09), abdominal pain (ICD-9 codes: 789.0–789.09), irritable bowel syndrome (IBS) (ICD-9 code: 564.1), abdominal migraine (ICD-9 code:346.80 and 346.81)dyspepsia (ICD-9 code: 536.8) or fecal incontinence (ICD-codes: 787.6–787.63) was the primary discharge diagnosis from 1997–2009. The KID is the largest publicly available all-payer inpatient database in the U.S., containing data from 2–3 million pediatric hospital stays yearly.
KEY RESULTS
From 1997–2009, the number of discharges with a FGID primary diagnosis increased slightly from 6,348,537 to 6,393,803. The total mean cost per discharge increased significantly from $6115 to $18,058 despite the length of stay remaining relatively stable. Constipation and abdominal pain were the most common FGID discharge diagnoses. Abdominal pain and abdominal migraine discharges were most frequent in the 10–14 year age group. Constipation and fecal incontinence discharges were most frequent in the 5–9 year age group. IBS discharge was most common for the 15–17 year age group.
CONCLUSIONS AND INFERENCES
Hospitalizations and associated costs in childhood FGIDs have increased in number and cost in the U.S. from 1997–2009. Further studies to determine optimal methods to avoid unnecessary hospitalizations and potentially harmful diagnostic testing are indicated.
Keywords: Inpatient admission rates, length of stay, associated costs, Constipation, Dyspepsia, abdominal pain, fecal incontinence, functional GI disorders, epidemiology, pediatric
INTRODUCTION
Functional gastrointestinal disorders (FGIDs) are among the most common digestive health problems in children (1, 2). FGIDs particularly common in children include chronic constipation, abdominal pain, irritable bowel syndrome (IBS), dyspepsia, abdominal migraine, and fecal incontinence. FGIDs have an international prevalence rate between 1.6–29.6% across age groups and diagnoses (3–6). About one third of pediatric patients with FGIDs continue to complain of these issues into adulthood, despite treatment (7, 8) (9). FGIDs in children are associated with overall lower quality of life, and studies have found a negative impact school and family life (10, 11). The economic burden associated with FGIDs represents a significant portion of healthcare resources. For example, a study evaluating costs in 2009 found that pediatric patients with chronic constipation have significantly greater annual mean total costs than healthy controls ($3430 compared to $1099) (12). Similarly, a 2010 study found children with chronic abdominal pain have an annual average expenditure of $6104 per person for consultations and investigational exams alone (13). While studies that analyze the cost of irritable bowel syndrome (IBS), dyspepsia or fecal incontinence in children are lacking, adult patients with IBS use 50% more healthcare resources than those without irritable bowel syndrome, and care of adult patients with IBS involves more than $20 billion per year in both direct and indirect expenditures (14). It has been described that adults with IBS have a mean inpatient cost of $446(15), adults with dyspepsia had an average of $805 in direct medical costs (16) and adults with fecal incontinence had an average total cost of $4110 per person (17). Although usually only outpatient treatment is required, children and adolescent patients with FGIDs may be admitted to the hospital either for further work up or for pain control when they have failed outpatient management (18). It has been suggested that the evaluation of these patients is expensive, increasing resource utilization and health care costs (18), but to our knowledge there is no published information regarding inpatient costs of children with FGIDs. Therefore the aim of this study was to analyze the inpatient burden of common childhood FGIDs including constipation, abdominal pain, IBS, dyspepsia, abdominal migraine, and fecal incontinence.
METHODS
To obtain a population-based estimate of national trends, we used the Kids’ Inpatient Database (KID) from the Healthcare Cost and Utilization Project (HCUP), which is sponsored by the Agency for Healthcare Research and Quality, Rockville, MD. The KID is the only all-payer inpatient care database in the United States for children and is stratified according to geographic region, ownership, location, teaching status and bed size. The KID contains data from approximately 2–3 million pediatric hospital discharges. The 1997 KID is drawn from 22 States and contains information on patients 18 years old or younger. The 2009 KID contains discharge data from 44 states and includes children who are 20 or younger. This large database is an excellent representative sample of the U.S. population of youths. The KID database provides only administrative data for analysis, and the discharge diagnoses are coded using the International Classification of Disease, Ninth Revision (ICD-9) codes. Patient specific clinical data are not available.
We queried the KID database for all subjects in which constipation (ICD-9 codes: 564.0–564.09); abdominal pain (ICD-9 codes: 789.0–789.09), dyspepsia (ICD-9 code: 536.8), irritable bowel syndrome (ICD-9 code:564.1), abdominal migraine (ICD-9 code:346.80 and 346.81) or fecal incontinence (ICD-codes: 787.6–787.63) was the primary discharge diagnosis from 1997,2000, 2003, 2006 and 2009. For 1997 and 2009 a detailed query of patients and hospital characteristics was also performed.(see below) The KID query provides a graphical user link which enables user to get data on multiple demographic and hospital variables, and we obtained detailed information from the 1997 and the 2009 KID data, giving us the most complete information spanning over a decade.
VARIABLES RECORDED
Patient demographics included age and gender. The recorded hospital characteristics were location (Northeast, Midwest, South or West) (metropolitan vs. non-metropolitan area), type (teaching vs. non-teaching), size (small, medium or large) and whether it was a children’s hospital or not. As per the HCUPnet definition, a metropolitan area has a population of at least 50,000 people. Areas with population less than 50,000 are considered non-metropolitan. A hospital is considered a teaching hospital if it has an AMA-approved residency program as indicated by the American Hospital Association Annual Survey, if it is a member of the Council of Teaching Hospitals, or if it has a ratio of full-time equivalent interns and residents to beds of 0.25 or higher. The definition of bed size varied according to the hospital location and teaching status. The range for small hospitals was from 1 to 299 beds, 25 to 499 bed for medium hospitals and 45 to 500 or more beds for large hospitals. Payer status for all discharges was also considered. “Hospital charges” is defined as the amount the hospital charged for the entire hospital stay, not including professional (MD) fees. “Aggregate charges” or the “national bill” is defined as the sum of all charges for all hospital stays in the U.S. “Length of stay” is defined as the number of nights the patient remained in the hospital.
STATISTICS
Trends in hospital charges, length of stay and number of discharges were evaluated using multiple regression. Plots of outcomes against year were used to assess the need for curvilinear terms and a polynomial term included if appropriate. Formal statistical inference employed the non-parametric bootstrap due to the non-Normal distribution of the data. Admission rates for each disease, compared between 1997 and 2009 employed Poisson regression with admission count as the dependent variable and total admissions as the offset. The independent variable was dummy coded such that model parameters represent the ratio of admission rate in 2009 to that in 1997.
RESULTS
General Trends in Hospital Discharges, Length of Stay, and Costs
Discharges
A total of 6,348,537 discharges in 1997 and a similar 6,393,803 discharges in 2009 were included. The most common FGID associated with hospitalization was abdominal pain with 18,492 in 1997, and 14,420 in 2009, followed by constipation with 3,739 in 1997 and 7,980 in 2009 (Figure 2). Discharges with a principal diagnosis of IBS, fecal incontinence, and abdominal migraine were much less frequent, each under 500, but all showed an increase between 1997 and 2009. There were statistically significant decreases in the number of discharges for abdominal pain and constipation (Table 1), while there were small increases in the number of discharges for dyspepsia and abdominal migraine (Table 1) and non-significant trends for fecal incontinence and IBS (Table 1).
Figure 2.
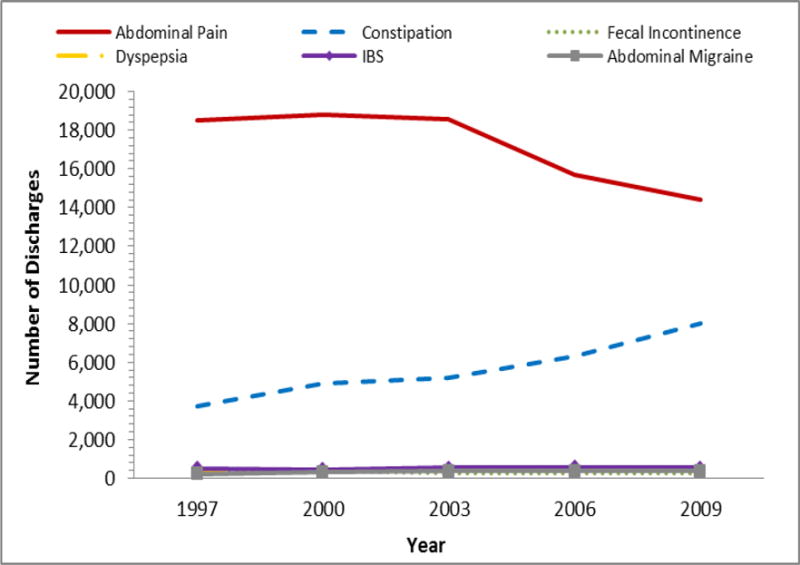
The number of hospital discharges with a principal diagnosis of an FGID from 1997 to 2009.
Table 1.
Hospital Discharges for FGID in Children in 1997
| Category | Categorical Variable | Constipation per 10,000 discharges | Ab. Pain per 10,000 discharges | IBS per 10,000 discharges | Dyspepsia per 10,000 discharges | F. Incont per 10,000 discharges | Ab. Migraine per 10,000 discharges | 1997 Total [N %)] |
|---|---|---|---|---|---|---|---|---|
| All Discharges | 5.9 | 29.1 | 0.8 | 0.5 | 0.4 | 0.3 | 6,348,537 (100%) | |
| Mean Age | <1 | 0.8 | 1.0 | 0.1 | * | 4,436,817 (70%) | ||
| Age Group | 1–4 | 16.1 | 23.3 | 0.9 | * | 610,084 (10%) | ||
| 5–9 | 31.6 | 113.3 | 2.0 | 1.2 | 3.3 | 1.5 | 378,876 (6%) | |
| 10–14 | 22.7 | 177.7 | 5.9 | 2.0 | 2.6 | 2.6 | 384,626 (6%) | |
| 15–17 | 6.5 | 102.1 | 3.5 | 0.8 | 0.4 | 0.9 | 538,133 (8%) | |
| Sex | Male | 6.4 | 24.7 | 0.5 | 0.4 | 0.6 | 0.3 | 3,236,156 (51%) |
| Female | 5.3 | 33.7 | 1.1 | 0.5 | 0.2 | 0.3 | 3,111,196 (49%) | |
| Payer | Medicare | 39.1 | * | 12,783 (0.2%) | ||||
| Medicaid | 6.0 | 20.1 | 0.2 | 0.4 | 0.5 | 0.2 | 2,315,510 (36%) | |
| Private insurance | 6.0 | 34.2 | 1.1 | 0.6 | 0.4 | 0.4 | 3,408,243 (54%) | |
| Uninsured | 4.6 | 40.0 | 0.7 | * | 349,251 (6%) | |||
| Other | 5.0 | 26.9 | 2.4 | 0.7 | 241,755 (4%) | |||
| Median Income for Zip code | Low ($0–35,999) | * | * | * | ||||
| Not low ($36,000+) | * | * | * | |||||
| Teaching Status | Nonteaching | 4.2 | 29.0 | 0.7 | 0.3 | 0.2 | 0.2 | 3,721,436 (59%) |
| Teaching | 8.4 | 29.3 | 0.9 | 0.6 | 0.6 | 0.5 | 2,627,101 (41%) | |
| Location | Non-metropolitan | 4.9 | 41.8 | 0.8 | 0.5 | * | 938,059 (15%) | |
| Metropolitan | 6.1 | 26.9 | 0.8 | 0.4 | 0.4 | 0.4 | 5,410,478 (85%) | |
| Bed size | Small | 6.9 | 35.1 | 0.8 | 0.8 | 0.4 | 0.3 | 1,089,029 (17%) |
| Medium | 6.2 | 30.7 | 0.6 | 0.3 | 0.4 | 0.5 | 2,040,119 (32%) | |
| Large | 5.3 | 26.1 | 0.9 | 0.5 | 0.4 | 0.3 | 3,219,388 (51%) | |
| Region | Northeast | 7.1 | 36.7 | 0.8 | 0.6 | 0.5 | 0.5 | 1,227,093 (19%) |
| Midwest | 5.3 | 29.3 | 1.1 | 0.3 | 0.3 | 0.5 | 1,420,206 (22%) | |
| South | 4.7 | 24.5 | 0.8 | 0.4 | 0.3 | 0.2 | 2,217,049 (35%) | |
| West | 7.3 | 29.7 | 0.5 | 0.5 | 0.6 | 0.4 | 1,484,188 (23%) | |
| Children’s Hospital | Not a children’s hospital | 3.8 | 28.5 | 0.7 | 0.2 | 0.2 | 0.2 | 4,824,690 (76%) |
| Children’s hospital | 12.5 | 31.0 | 1.2 | 1.1 | 1.1 | 0.7 | 1,523,846 (24%) |
data not available
percentages may not add up to 100% due to missing data
Costs
The average cost per hospitalization for FGID increased from $6115 in 1997 to $18,058 in 2009. Pediatric patients discharged with a primary diagnosis of abdominal pain faced the greatest increase in average cost per hospital stay, with the mean total cost per hospitalization increasing from $3558 to $13,331 (Figure 3); in contrast, the length of hospital stay increased only from 1.7 to 2.0 days from 1997 and 2009, respectively. IBS had the second highest mean increase in total charges, increasing from $5278 in 1997 to $18,853 in 2009 (Figure 1). Abdominal migraine had the third highest mean total increase in charges, increasing from $4876 in 1997 to $15,139 in 2009 (Figure 1). Dyspepsia was also the most expensive disorder to treat with a 183.2% increase in mean total charges from $12,674 in 1997 to $35,898 in 2009 (Figure 1). Finally, a diagnosis of fecal incontinence had an average total costs increase of 100.5% from $6,609 in 1997 to $13,252 in 2009 (Figure 1).
Figure 3.
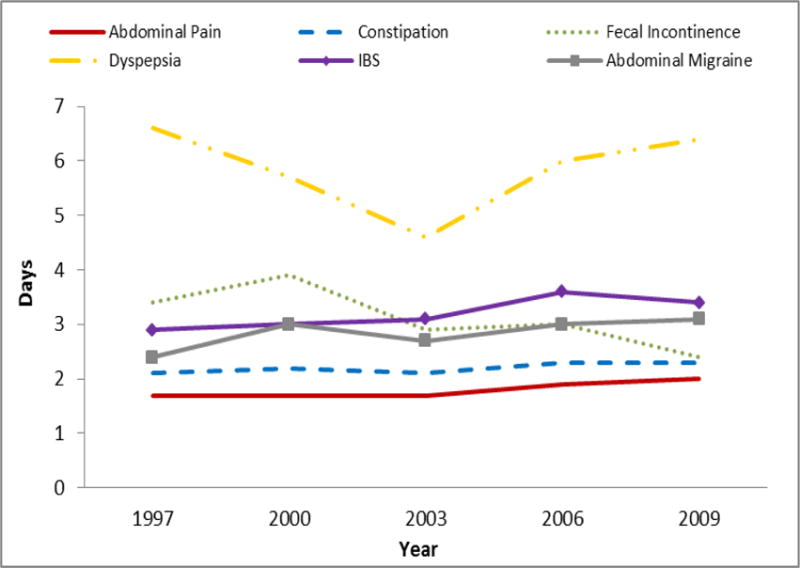
The mean length of inpatient stay of patients with a principal diagnosis of an FGID from 1997 to 2009.
Figure 1.
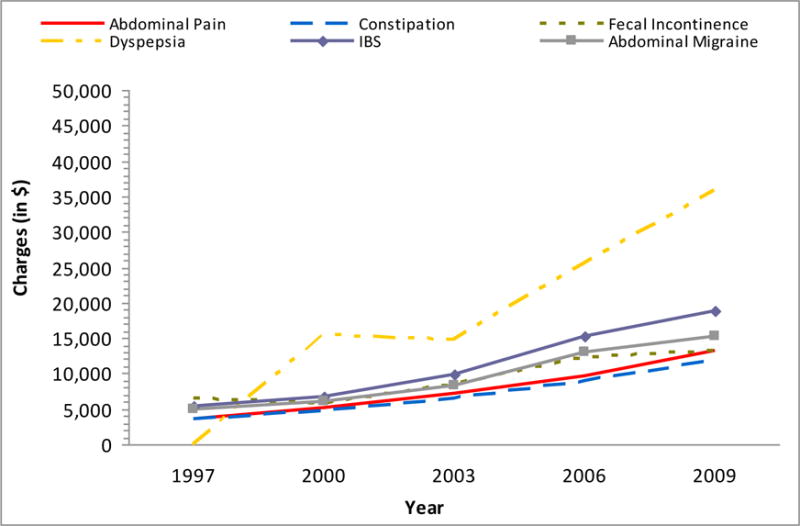
The total mean charge per discharge with a principal diagnosis of an FGID from 1997 to 2009.
Length of Stay
In contrast to costs the length of hospital stay (LoS) changed only slightly for all disorders with the trends for abdominal pain and IBS being the only disorders for which the change in LoS reached statistical significance.
Findings Based on Individual FGID
Abdominal pain
Overall, admissions for abdominal pain reduced between 1997 (29.1/10000) and 2009 (22.6/10000) with RR= (0.77, 95% CI 0.76, 0.79), p<0.001. This was generally true across the board with only admissions where the payer was ‘other’ increasing by 17% and where the hospital was a dedicated children’s’ hospital increasing by 35% (Table 2). The degree of reduction was however quite variable with the greatest reduction being in <1 year olds (RR=0.44) and the least for admission paid for by Medicaid (RR=0.90).
Table 2.
Hospital Discharges for FGID in Children in 2009
| Category | Categorical Variable | Constipation per 10,000 discharges | Ab. Pain per 10,000 discharges | IBS per 10,000 discharges | Dyspepsia per 10,000 discharges | F. Incont per 10,000 discharges | Ab. Migraine per 10,000 discharges | 2009 Total [N %)] |
|---|---|---|---|---|---|---|---|---|
| All Discharges | 12.5 | 22.6 | 0.9 | 0.7 | 0.4 | 0.6 | 6,393,803 (100%) | |
| Mean Age | <1 | 1.1 | 0.4 | 0.2 | * | 4,600,709 (72%) | ||
| Age Group | 1–4 | 34.1 | 22.7 | 1.9 | 0.6 | 564,824 (9%) | ||
| 5–9 | 68.4 | 96.2 | 1.9 | 1.7 | 4.2 | 2.5 | 358,203 (6%) | |
| 10–14 | 55.7 | 136.9 | 5.0 | 2.8 | 2.2 | 4.2 | 372,437 (6%) | |
| 15–17 | 20.7 | 88.2 | 5.5 | 1.8 | 0.4 | 2.3 | 497,630 (8%) | |
| Sex | Male | 12.6 | 18.2 | 0.6 | 0.6 | 0.6 | 0.5 | 3,257,597 (51%) |
| Female | 12.1 | 26.4 | 1.2 | 0.8 | 0.3 | 0.7 | 3,106,442 (49%) | |
| Payer | Medicare | 19.8 | 31.1 | * | 11,590 (0.2%) | |||
| Medicaid | 12.4 | 18.1 | 0.5 | 0.7 | 0.5 | 0.4 | 3,026,032 (47%) | |
| Private insurance | 12.6 | 27.0 | 1.2 | 0.8 | 0.4 | 0.8 | 2,893,683 (45%) | |
| Uninsured | 8.2 | 19.2 | * | 263,406 (4%) | ||||
| Other | 17.0 | 31.3 | 1.3 | 1.0 | 0.9 | 189,087 (3%) | ||
| Median Income for Zip code | Low ($0–35,999) | 12.1 | 22.0 | 0.6 | 0.6 | 0.6 | 0.4 | 1,877,468 (29%) |
| Not low ($36,000+) | 12.7 | 22.8 | 1.0 | 0.8 | 0.4 | 0.7 | 4,383,149 (69%) | |
| Teaching Status | Nonteaching | 5.3 | 18.9 | 0.4 | 0.2 | 0.1 | 0.3 | 2,931,945 (46%) |
| Teaching | 18.0 | 25.4 | 1.2 | 1.2 | 0.8 | 0.9 | 3,107,982 (49%) | |
| Location | Non-metropolitan | 6.3 | 24.4 | 0.4 | * | 702,613 (11%) | ||
| Metropolitan | 12.6 | 22.0 | 0.9 | 0.8 | 0.5 | 0.6 | 5,337,315 (83%) | |
| Bed size | Small | 12.3 | 26.2 | 0.6 | * | 0.6 | 636,202 (10%) | |
| Medium | 11.5 | 21.1 | 0.6 | 0.8 | 0.3 | 0.5 | 1,551,542 (24%) | |
| Large | 11.9 | 22.1 | 0.9 | 0.7 | 0.5 | 0.6 | 3,852,184 (60%) | |
| Region | Northeast | 14.2 | 27.4 | 1.0 | 1.0 | * | 0.7 | 1,069,226 (17%) |
| Midwest | 13.2 | 21.1 | 1.1 | 0.7 | 0.5 | 0.6 | 1,374,615 (22%) | |
| South | 10.6 | 20.7 | 0.8 | 0.6 | 0.6 | 0.6 | 2,472,511 (39%) | |
| West | 13.7 | 23.5 | 0.7 | 0.9 | 0.4 | 0.5 | 1,477,451 (23%) | |
| Children’s Hospital | Not a children’s hospital | 5.5 | 16.3 | 0.4 | 0.2 | 0.1 | 0.3 | 4,364,196 (68%) |
| Children’s hospital | 32.7 | 41.9 | 2.1 | 2.2 | 1.6 | 1.5 | 1,421,308 (22%) |
percentages may not add up to 100% due to missing data
Constipation
Rates of admission for constipation increased both overall (RR=2.12, 95% CI 2.04, 2.20) and across all categories (Tables 1 and 2). The elevation in admission rates was highest where the payer was “other” (RR=3.39), followed by 15–17 year olds (RR=3.19) and was lowest among non-metropolitan hospitals (RR=1.30).
Fecal incontinence
Rates of admission for fecal incontinence were relatively stable between 1997 and 2009 (RR=1.09, 95% CI 0.92, 1.29; p=0.3). The largest increase was in the South (RR=2.00) while the largest decrease was in non-teaching hospitals (RR=0.35). Tables 1 and 2 report however that the majority of the relative rates were close to 1.0 (no change) and not statistically significant.
Functional dyspepsia
Rates of admission for functional dyspepsia generally increased between 1997 and 2009 with an overall relative rate of 1.62 (95% CI 1.39, 1.87). The greatest increase was in medium-size hospitals (RR=3.08) followed by the Midwest (RR=2.16). The only statistically significant decrease was in non-teaching hospitals (RR=0.56).
Irritable bowel syndrome
Rates of admission for IBS were stable overall relative rate of 1.07(95% CI 0.95, 1.21; p=0.3). There was increase when the payer was Medicaid (RR=2.10) and a lesser increase among children’s hospitals (RR=1.73). There were several categories where decreases were report, including where the payer was “other” (RR=0.53), non-teaching hospitals (RR=0.56) and non-metropolitan hospitals (RR=0.58).
Abdominal migraine
Rates of admission for abdominal migraine generally increased between 1997 and 2009 with an overall relative rate of 1.76 (95% CI 1.49, 2.07). The largest increase was in the South (RR=3.69), followed by children’s services (RR=2.12). The rate of admission for abdominal migraine did not decrease in any category.
DISCUSSION
The results of this study indicate that FGIDs, particularly abdominal pain and constipation, are common causes for hospitalization in children and are associated with significant medical costs. From 1997 to 2009, the average inpatient costs for all FGIDs has increased significantly, while length of hospital stay remained relatively static. The number of discharges either increased or remained static for all FGIDs except abdominal pain.
Abdominal pain was the leading inpatient discharge diagnosis for pediatric FGIDs with 22.6/10,000 discharges followed by constipation with 12.5/10,000 discharges in 2009. The hospital discharge rates of IBS, dyspepsia, fecal incontinence and abdominal migraine were all less than 1/10,000 discharges in 2009. Interestingly, we noticed a decrease in the number of discharges for abdominal pain by 22.0% starting in 2003. This phenomenon may correlate with an increase in the outpatient performance of diagnostic procedures including outpatient bowel ‘cleanouts’(19) and early detection of celiac disease (20). The frequency of constipation discharges also increased significantly by 112% from 5.9/10,000 discharges in 1997 to 12.5/10,000 discharges in 2009. The reasons for this increase are unclear, however it is possible that the increasing rate of obesity, which has been associated with constipation, may explain some of this increase (21, 22). Other potential explanations include the increasing use of medications for which constipation is a side effect including those commonly used to treat attention deficit hyperactivity disorder (ADHD) (e.g. tricyclic antidepressants) (23),(24). It is likely that our findings underestimate the actual prevalence of hospitalizations for constipation, since constipation is the underlying condition for many children who are given a discharge diagnosis of fecal incontinence (25). It is also impossible to know the medical history of the children that were admitted for constipation, but it is possible the admission could have been for a bowel ‘cleanout’ after failing outpatient treatment, as disimpaction is one of the steps that have been recommended by national organizations as important in the treatment of children with constipation (26), and until recently were performed in the hospital, (26). Another possibility is that constipation may be a common discharge diagnosis given to children admitted for the evaluation of abdominal pain, and that those inpatients are receiving bowel ‘cleanouts’ to try to decrease the stool burden in an effort to decrease the pain. The diagnosis of constipation in many of those patients with abdominal pain is made by plain abdominal X-rays (KUB), a practice that is well established in many pediatric centers, even though multiple studies and meta-analyses have shown the lack of sensitivity and specificity of a KUB to diagnose constipation (27). Also, it is important to note that even though there is limited information associating abdominal pain with constipation (28) multiple studies have failed to show a relationship between constipation and abdominal pain, and those children continue to seek medical care for their functional abdominal pain after discharge. Therefore, this is an area in which educational intervention may allow the correct diagnosis of FGIDs and provide better treatments that follow the biopsychosocial model.
The cost for all hospitalizations of pediatric FGIDs increased significantly from 1997 to 2009. This increase in hospital costs may be attributed to medical inflation, performance of more procedures, or the increasing admittance to specialized centers such as children’s hospitals. For example, for almost all FGIDs, children were more likely to be admitted to a children’s hospital than a non-children’s hospital and to a teaching hospital than a non-teaching hospital. Merenstein et al (29) reported that free-standing children’s hospitals had a higher charge per admission for the following common diagnoses: asthma, dehydration, pneumonia, and diarrhea, while Gupta et al (30) reported that charges at children’s hospitals were about 10% higher for children with asthma. Similar findings have been reported in adults. A study by Zimmerman et al. (31) found that adults treated in teaching hospitals versus non-teaching hospitals had significantly greater hospital bills per night, most likely due to the greater number of consultations per patient. Although the costs are generally greater in children’s hospitals, they have been shown to be better equipped and have been demonstrated to have superior outcomes (32) than other hospitals for some patients and certain procedures, such as subspecialty surgery, special-needs children, oncology regimens, and rare problems (29). Unfortunately, the present study cannot determine if the care received in children’s hospital resulted in better outcomes.
We noted that the cost of constipation among pediatric FGID patients increased by 221.5% from $3693 to $11,873 and the mean length of stay only increased slightly from 2.1 to 2.3 days. This increase in cost may be related to the fact that inpatient disimpaction for severely constipated patients usually includes NG administration of lavage solutions (34). Interestingly, dyspepsia had the highest average cost of all pediatric FGIDs between 1997 and 2009. This finding may be explained because an upper GI endoscopy is usually indicated in patients presenting with dyspepsia. Similarly, a host of tests including an abdominal ultrasound, serum amylase, lipase, and serum amino-transferases are used to assess whether or not the dyspepsia is related to pancreatic or biliary diseases (35). Most of those children also undergo gastric emptying by scintigraphic methods to establish the presence of gastroparesis. A recent study of children showed that the average cost of the evaluation of a child with suspected gastroparesis was $9014(36). The high cost of dyspepsia discharges may also be directly related to our finding that children discharged with dyspepsia had the longest length of stay on average of all pediatric FGID inpatients, an observation which may be due to the fact that children with functional dyspepsia struggle eating due to the pain and need to stay in the hospital longer in order to receive nutrition.
We also observed some other trends. In discharges of abdominal pain and abdominal migraine, patients were more likely to be 10–14 years old, which is likely the case because appendicitis is highest in 10 to 14 year olds (37) and patients are typically admitted for observation because of the possibility of appendicitis and they are discharged with abdominal pain if testing and imaging for appendicitis is negative. Additionally, patients with discharge diagnoses of constipation and fecal incontinence were more likely to be in the 5–9 year old age group, the age when constipation is more prevalent. Similarly, this agrees with prior findings that the rate of pediatric IBS is highest in the 13–17 age group (3, 38, 39). The prevalence of FGIDs in these age groups is consistent with the findings of several studies done in the past (6, 40–42). In the present study, abdominal pain and IBS are more prevalent in girls and constipation and fecal incontinence are more prevalent in boys, which is consistent with prior studies.
Future efforts to try to understand why the cost is increasing will be necessary. One possibility could be related to the fact that the diagnosis of FGIDs is still inappropriately considered a diagnosis of exclusion in many instances, and the inpatient evaluation may entail more expensive tests, as has been shown recently.(13, 18) Multiple studies have documented the lack of utility of invasive tests in children with abdominal pain (13). Another recent trend has included the use of CT scans in the acute evaluation of abdominal pain in children to exclude appendicitis, and after appendicitis is excluded, intestinal inflammation is frequently seen leading to more studies, including colonoscopy to exclude inflammatory bowel disease, a practice that has been shown to have low yield (33). The recent introduction of screening stool tests (like calprotectin) to determine if there is underlying intestinal inflammation may also reduce the costs of evaluation as a negative test has been shown to be highly specific in excluding inflammatory bowel disease, avoiding costly colonoscopies (43) Therefore, it is possible that better education of providers that deal with children with abdominal pain in FGIDs and the utility of specific testing in children with pain may have a major impact in lowering the costs of evaluation incurred in the evaluation of these patients.
There are limitations to our data. The most important one is that our analysis is based on coding of selected ICD-9-CM codes. There are clear limitations to the accuracy of this type of data collection, but the professional coding used by The KID strengthens our investigation (44–47). On the other hand, the diagnosis was based on the individual discharging physician making the diagnosis of FGIDs, and the diagnostic criteria may not be accurate according to established Rome criteria. Therefore one main limitation is that we do not have any validation of the diagnosis. However the data represents real life events occurring in non-selected hospitals across the nation and merits further studies, as the work up and evaluation of children that are eventually diagnosed as having FGIDs shows tremendous costs. Further studies to understand better the clinical characteristics of these patients are needed to be able to tailor interventions to decrease costs, either by better education of the providers on the diagnosis and evaluation of children with FGIDs as well as in the most cost effective performance of testing when they are needed.
In conclusion, pediatric hospital discharges for FGIDs have increased in cost and frequency, particularly for constipation, IBS, dyspepsia and abdominal migraine, in the United States from 1997 to 2009. In order to reduce the inpatient burden of FGIDs in children, it will be necessary to conduct prospective studies to further understand the drivers behind these increased hospitalizations and costs, and more importantly to find interventions to avoid hospitalizations and testing. Better education on the diagnostic evaluation and treatment of FGIDs in children is needed, and we speculate would have a major impact in the costs incurred in the evaluation of these patients.
Figure 4a.

The age distribution of patients discharged with a principal diagnosis of an FGID in 1997.
Figure 4b.
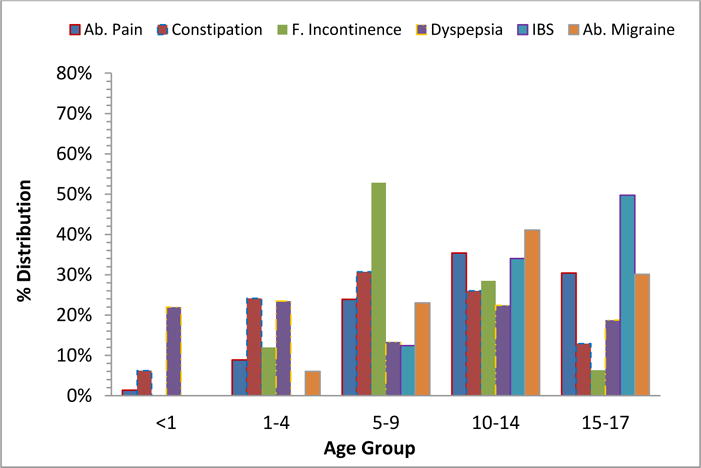
The age distribution of patients discharged with a principle diagnosis of an FGID in 2009.
Figure 5a.
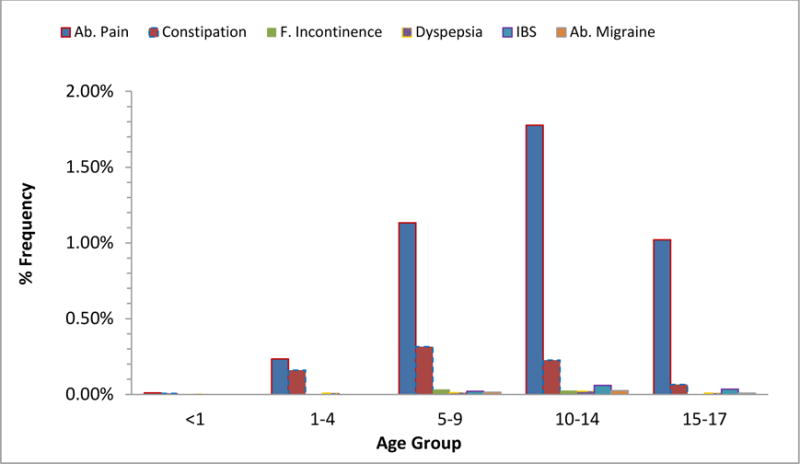
The frequency of patients discharged with a principle diagnosis of an FGID in 1997.
Figure 5b.
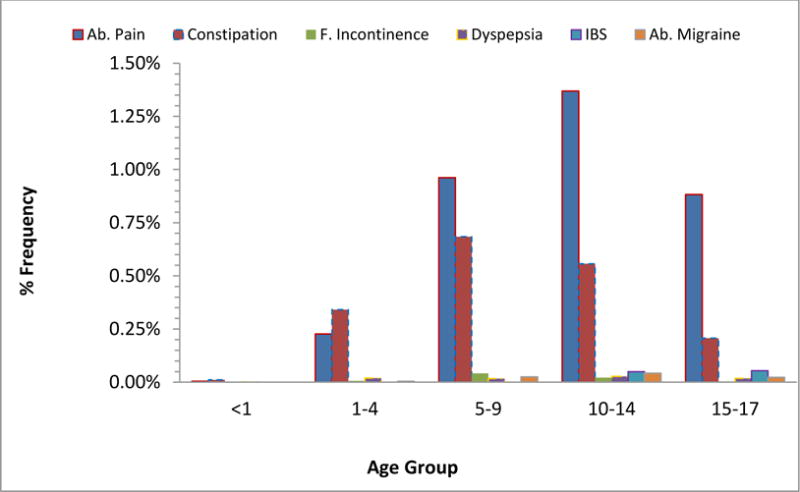
The frequency of patients discharged with a principle diagnosis of an FGID in 2009.
Key messages.
Hospitalizations and associated costs in childhood functional gastrointestinal disorders (FGID)s have increased in number and cost in the U.S. from 1997–2009
This study evaluates the inpatient admission rate, length of stay, and associated costs related to FGIDs from 1997 to 2009 in the U.S. We analyzed the Kids’ Inpatient Sample Database (KID) for discharges associated with FGIDs. Analysis of trends based on discharge diagnosis, age group, geographical regions, and type and size of hospital was done
We found that from 1997–2009, the number of discharges with a FGID primary diagnosis, and the mean cost per discharge increased.
Acknowledgments
Funding: This work was supported in part by NIH K24DK082792A (Dr. Nurko)
Abbreviations
- U.S.
United States
- FGID
functional gastrointestinal disorder
- KID
Kids’ Inpatient Sample Database
- IBS
irritable bowel syndrome
- HCUP
Healthcare Cost and Utilization Project
- LoS
length of stay
- KUB
kidneys, ureters, and bladder x-ray
Footnotes
Financial Disclosure: The authors have no financial relationships relevant to this article to disclose.
Potential Conflicts of Interest: The authors have no conflicts of interest relevant to this article to disclose.
Contributers’ Statements
Richard Park, Sage Mikami, Jack LeClair: Carried out the initial analyses and drafted the initial manuscript
Anthony Lembo: Conceptualized and designed the study, drafted the initial manuscript, and reviewed and revised the manuscript
Saurabh Sethi, Samuel Nurko: Conceptualized and designed the study, and interpreted, reviewed and revised the manuscript
Andrea Bollom, Cara Lembo, Vivian Cheng, Elizabeth Friedlander: Critical review and interpretation of data and revision of the manuscript
Mike Jones: Carried out statistical analyses and interpretation and reviewed and revised the manuscript
All authors approved the final manuscript as submitted and agree to be accountable for all aspects of the work.
References
- 1.Youssef NN, Langseder AL, Verga BJ, Mones RL, Rosh JR. Chronic childhood constipation is associated with impaired quality of life: a case-controlled study. Journal of pediatric gastroenterology and nutrition. 2005;41:56–60. doi: 10.1097/01.mpg.0000167500.34236.6a. [DOI] [PubMed] [Google Scholar]
- 2.Rippel SW, Acra S, Correa H, Vaezi M, Di Lorenzo C, Walker LS. Pediatric patients with dyspepsia have chronic symptoms, anxiety, and lower quality of life as adolescents and adults. Gastroenterology. 2012;142:754–761. doi: 10.1053/j.gastro.2011.12.043. [DOI] [PMC free article] [PubMed] [Google Scholar]
- 3.Hyams JS, Burke G, Davis PM, Rzepski B, Andrulonis PA. Abdominal pain and irritable bowel syndrome in adolescents: a community-based study. The Journal of pediatrics. 1996;129:220–226. doi: 10.1016/s0022-3476(96)70246-9. [DOI] [PubMed] [Google Scholar]
- 4.van den Berg MM, Benninga MA, Di Lorenzo C. Epidemiology of childhood constipation: a systematic review. The American journal of gastroenterology. 2006;101:2401–2409. doi: 10.1111/j.1572-0241.2006.00771.x. [DOI] [PubMed] [Google Scholar]
- 5.Caperell K, Pitetti R, Cross KP. Race and acute abdominal pain in a pediatric emergency department. Pediatrics. 2013;131:1098–1106. doi: 10.1542/peds.2012-3672. [DOI] [PubMed] [Google Scholar]
- 6.van der Wal MF, Benninga MA, Hirasing RA. The prevalence of encopresis in a multicultural population. Journal of pediatric gastroenterology and nutrition. 2005;40:345–348. doi: 10.1097/01.mpg.0000149964.77418.27. [DOI] [PubMed] [Google Scholar]
- 7.van Ginkel R, Reitsma JB, Buller HA, van Wijk MP, Taminiau JA, Benninga MA. Childhood constipation: longitudinal follow-up beyond puberty. Gastroenterology. 2003;125:357–363. doi: 10.1016/s0016-5085(03)00888-6. [DOI] [PubMed] [Google Scholar]
- 8.Loening-Baucke V. Constipation in early childhood: patient characteristics, treatment, and longterm follow up. Gut. 1993;34:1400–1404. doi: 10.1136/gut.34.10.1400. [DOI] [PMC free article] [PubMed] [Google Scholar]
- 9.Rasquin A, Di Lorenzo C, Forbes D, et al. Childhood functional gastrointestinal disorders: child/adolescent. Gastroenterology. 2006;130:1527–1537. doi: 10.1053/j.gastro.2005.08.063. [DOI] [PMC free article] [PubMed] [Google Scholar]
- 10.Ammoury RF, Pfefferkorn Mdel R, Croffie JM. Functional gastrointestinal disorders: past and present. World journal of pediatrics: WJP. 2009;5:103–112. doi: 10.1007/s12519-009-0021-6. [DOI] [PubMed] [Google Scholar]
- 11.Sagawa T, Okamura S, Kakizaki S, Zhang Y, Morita K, Mori M. Functional gastrointestinal disorders in adolescents and quality of school life. Journal of gastroenterology and hepatology. 2013;28:285–290. doi: 10.1111/j.1440-1746.2012.07257.x. [DOI] [PubMed] [Google Scholar]
- 12.Liem O, Harman J, Benninga M, Kelleher K, Mousa H, Di Lorenzo C. Health utilization and cost impact of childhood constipation in the United States. The Journal of pediatrics. 2009;154:258–262. doi: 10.1016/j.jpeds.2008.07.060. [DOI] [PubMed] [Google Scholar]
- 13.Dhroove G, Chogle A, Saps M. A million-dollar work-up for abdominal pain: is it worth it? Journal of pediatric gastroenterology and nutrition. 2010;51:579–583. doi: 10.1097/MPG.0b013e3181de0639. [DOI] [PubMed] [Google Scholar]
- 14.American College of Gastroenterology Task Force on Irritable Bowel S. Brandt LJ, Chey WD, et al. An evidence-based position statement on the management of irritable bowel syndrome. The American journal of gastroenterology. 2009;104(Suppl 1):S1–35. doi: 10.1038/ajg.2008.122. [DOI] [PubMed] [Google Scholar]
- 15.Nyrop KA, Palsson OS, Levy RL, et al. Costs of health care for irritable bowel syndrome, chronic constipation, functional diarrhoea and functional abdominal pain. Alimentary pharmacology & therapeutics. 2007;26:237–248. doi: 10.1111/j.1365-2036.2007.03370.x. [DOI] [PubMed] [Google Scholar]
- 16.Lacy BE, Weiser KT, Kennedy AT, Crowell MD, Talley NJ. Functional dyspepsia: the economic impact to patients. Alimentary pharmacology & therapeutics. 2013;38:170–177. doi: 10.1111/apt.12355. [DOI] [PubMed] [Google Scholar]
- 17.Xu X, Menees SB, Zochowski MK, Fenner DE. Economic cost of fecal incontinence. Diseases of the colon and rectum. 2012;55:586–598. doi: 10.1097/DCR.0b013e31823dfd6d. [DOI] [PubMed] [Google Scholar]
- 18.Coffelt TA, Bauer BD, Carroll AE. Inpatient characteristics of the child admitted with chronic pain. Pediatrics. 2013;132:e422–429. doi: 10.1542/peds.2012-1739. [DOI] [PubMed] [Google Scholar]
- 19.Kierkus J, Horvath A, Szychta M, et al. High-versus low-volume polyethylene glycol plus laxative versus sennosides for colonoscopy preparation in children. Journal of pediatric gastroenterology and nutrition. 2013;57:230–235. doi: 10.1097/MPG.0b013e3182950ef5. [DOI] [PubMed] [Google Scholar]
- 20.Tanpowpong P, Broder-Fingert S, Katz AJ, Camargo CA., Jr Age-related patterns in clinical presentations and gluten-related issues among children and adolescents with celiac disease. Clinical and translational gastroenterology. 2012;3:e9. doi: 10.1038/ctg.2012.4. [DOI] [PMC free article] [PubMed] [Google Scholar]
- 21.Mokdad AH, Bowman BA, Ford ES, Vinicor F, Marks JS, Koplan JP. The continuing epidemics of obesity and diabetes in the United States. JAMA: the journal of the American Medical Association. 2001;286:1195–1200. doi: 10.1001/jama.286.10.1195. [DOI] [PubMed] [Google Scholar]
- 22.Brownson RC, Boehmer TK, Luke DA. Declining rates of physical activity in the United States: what are the contributors? Annual review of public health. 2005;26:421–443. doi: 10.1146/annurev.publhealth.26.021304.144437. [DOI] [PubMed] [Google Scholar]
- 23.Bet PM, Hugtenburg JG, Penninx BW, Hoogendijk WJ. Side effects of antidepressants during long-term use in a naturalistic setting. European neuropsychopharmacology: the journal of the European College of Neuropsychopharmacology. 2013 doi: 10.1016/j.euroneuro.2013.05.001. [DOI] [PubMed] [Google Scholar]
- 24.Froehlich TE, Lanphear BP, Epstein JN, Barbaresi WJ, Katusic SK, Kahn RS. Prevalence, recognition, and treatment of attention-deficit/hyperactivity disorder in a national sample of US children. Archives of pediatrics & adolescent medicine. 2007;161:857–864. doi: 10.1001/archpedi.161.9.857. [DOI] [PubMed] [Google Scholar]
- 25.Benninga MA, Buller HA, Heymans HS, Tytgat GN, Taminiau JA. Is encopresis always the result of constipation? Archives of disease in childhood. 1994;71:186–193. doi: 10.1136/adc.71.3.186. [DOI] [PMC free article] [PubMed] [Google Scholar]
- 26.Constipation Guideline Committee of the North American Society for Pediatric Gastroenterology H, Nutrition. Evaluation and treatment of constipation in infants and children: recommendations of the North American Society for Pediatric Gastroenterology, Hepatology and Nutrition. Journal of pediatric gastroenterology and nutrition. 2006;43:e1–13. doi: 10.1097/01.mpg.0000233159.97667.c3. [DOI] [PubMed] [Google Scholar]
- 27.Berger MY, Tabbers MM, Kurver MJ, Boluyt N, Benninga MA. Value of abdominal radiography, colonic transit time, and rectal ultrasound scanning in the diagnosis of idiopathic constipation in children: a systematic review. The Journal of pediatrics. 2012;161:44–50. e41–42. doi: 10.1016/j.jpeds.2011.12.045. [DOI] [PubMed] [Google Scholar]
- 28.Gijsbers CF, Kneepkens CM, Vergouwe Y, Buller HA. Occult constipation: faecal retention as a cause of recurrent abdominal pain in children. European journal of pediatrics. 2014;173:781–785. doi: 10.1007/s00431-013-2257-3. [DOI] [PubMed] [Google Scholar]
- 29.Merenstein D, Egleston B, Diener-West M. Lengths of stay and costs associated with children’s hospitals. Pediatrics. 2005;115:839–844. doi: 10.1542/peds.2004-1622. [DOI] [PubMed] [Google Scholar]
- 30.Gupta RS, Bewtra M, Prosser LA, Finkelstein JA. Predictors of hospital charges for children admitted with asthma. Ambulatory pediatrics: the official journal of the Ambulatory Pediatric Association. 2006;6:15–20. doi: 10.1016/j.ambp.2005.07.001. [DOI] [PubMed] [Google Scholar]
- 31.Zimmerman JE, Shortell SM, Knaus WA, et al. Value and cost of teaching hospitals: a prospective, multicenter, inception cohort study. Critical care medicine. 1993;21:1432–1442. doi: 10.1097/00003246-199310000-00009. [DOI] [PubMed] [Google Scholar]
- 32.Garcia FA, Miller HB, Huggins GR, Gordon TA. Effect of academic affiliation and obstetric volume on clinical outcome and cost of childbirth. Obstetrics and gynecology. 2001;97:567–576. doi: 10.1016/s0029-7844(00)01219-9. [DOI] [PubMed] [Google Scholar]
- 33.Min SB, Nylund CM, Abbas MI, et al. Thickened gastrointestinal wall findings on computed tomography in children: a reason for endoscopy? Journal of pediatric gastroenterology and nutrition. 2013;57:305–310. doi: 10.1097/MPG.0b013e3182952eaa. [DOI] [PubMed] [Google Scholar]
- 34.Rockney RM, McQuade WH, Days AL, Linn HE, Alario AJ. Encopresis treatment outcome: long-term follow-up of 45 cases. Journal of developmental and behavioral pediatrics: JDBP. 1996;17:380–385. doi: 10.1097/00004703-199612000-00002. [DOI] [PubMed] [Google Scholar]
- 35.Mayerle J, Dummer A, Sendler M, et al. Differential roles of inflammatory cells in pancreatitis. Journal of gastroenterology and hepatology. 2012;27(Suppl 2):47–51. doi: 10.1111/j.1440-1746.2011.07011.x. [DOI] [PubMed] [Google Scholar]
- 36.Chogle A, Saps M. Gastroparesis in children: the benefit of conducting 4-hour scintigraphic gastric-emptying studies. Journal of pediatric gastroenterology and nutrition. 2013;56:439–442. doi: 10.1097/MPG.0b013e31827a789c. [DOI] [PubMed] [Google Scholar]
- 37.Bundy DG, Byerley JS, Liles EA, Perrin EM, Katznelson J, Rice HE. Does this child have appendicitis? JAMA: the journal of the American Medical Association. 2007;298:438–451. doi: 10.1001/jama.298.4.438. [DOI] [PMC free article] [PubMed] [Google Scholar]
- 38.Caplan A, Walker L, Rasquin A. Validation of the pediatric Rome II criteria for functional gastrointestinal disorders using the questionnaire on pediatric gastrointestinal symptoms. Journal of pediatric gastroenterology and nutrition. 2005;41:305–316. doi: 10.1097/01.mpg.0000172749.71726.13. [DOI] [PubMed] [Google Scholar]
- 39.Miele E, Simeone D, Marino A, et al. Functional gastrointestinal disorders in children: an Italian prospective survey. Pediatrics. 2004;114:73–78. doi: 10.1542/peds.114.1.73. [DOI] [PubMed] [Google Scholar]
- 40.Rajindrajith S, Devanarayana NM, Benninga MA. Review article: faecal incontinence in children: epidemiology, pathophysiology, clinical evaluation and management. Alimentary pharmacology & therapeutics. 2013;37:37–48. doi: 10.1111/apt.12103. [DOI] [PubMed] [Google Scholar]
- 41.Mortimer MJ, Kay J, Jaron A. Clinical epidemiology of childhood abdominal migraine in an urban general practice. Developmental medicine and child neurology. 1993;35:243–248. doi: 10.1111/j.1469-8749.1993.tb11629.x. [DOI] [PubMed] [Google Scholar]
- 42.Abu-Arafeh I, Russell G. Prevalence and clinical features of abdominal migraine compared with those of migraine headache. Archives of disease in childhood. 1995;72:413–417. doi: 10.1136/adc.72.5.413. [DOI] [PMC free article] [PubMed] [Google Scholar]
- 43.Van de Vijver E, Schreuder AB, Cnossen WR, Muller Kobold AC, van Rheenen PF, North Netherlands Pediatric IBDC Safely ruling out inflammatory bowel disease in children and teenagers without referral for endoscopy. Archives of disease in childhood. 2012;97:1014–1018. doi: 10.1136/archdischild-2011-301206. [DOI] [PubMed] [Google Scholar]
- 44.Hsia DC, Krushat WM, Fagan AB, Tebbutt JA, Kusserow RP. Accuracy of diagnostic coding for Medicare patients under the prospective-payment system. The New England journal of medicine. 1988;318:352–355. doi: 10.1056/NEJM198802113180604. [DOI] [PubMed] [Google Scholar]
- 45.Wilchesky M, Tamblyn RM, Huang A. Validation of diagnostic codes within medical services claims. Journal of clinical epidemiology. 2004;57:131–141. doi: 10.1016/S0895-4356(03)00246-4. [DOI] [PubMed] [Google Scholar]
- 46.Albertsen PC, Kamens EA. Variations in coding practices among Connecticut urologists for the Medicare population. Connecticut medicine. 1990;54:508–511. [PubMed] [Google Scholar]
- 47.Fisher ES, Whaley FS, Krushat WM, et al. The accuracy of Medicare’s hospital claims data: progress has been made, but problems remain. American journal of public health. 1992;82:243–248. doi: 10.2105/ajph.82.2.243. [DOI] [PMC free article] [PubMed] [Google Scholar]