Abstract
Plasma insulin oscillations are known to have physiological importance in the regulation of blood glucose. In insulin-secreting β-cells of pancreatic islets, K(ATP) channels play a key role in regulating glucose-dependent insulin secretion. In addition, they convey oscillations in cellular metabolism to the membrane by sensing adenine nucleotides, and are thus instrumental in mediating pulsatile insulin secretion. Blocking K(ATP) channels pharmacologically depolarizes the β-cell plasma membrane and terminates islet oscillations. Surprisingly, when K(ATP) channels are genetically knocked out, oscillations in islet activity persist, and relatively normal blood glucose levels are maintained. Compensation must therefore occur to overcome the loss of K(ATP) channels in K(ATP) knockout mice. In a companion study, we demonstrated a substantial increase in Kir2.1 protein occurs in β-cells lacking K(ATP) because of SUR1 deletion. In this report, we demonstrate that β-cells of SUR1 null islets have an upregulated inward rectifying K+ current that helps to compensate for the loss of K(ATP) channels. This current is likely due to the increased expression of Kir2.1 channels. We used mathematical modeling to determine whether an ionic current having the biophysical characteristics of Kir2.1 is capable of rescuing oscillations that are similar in period to those of wild-type islets. By experimentally testing a key model prediction we suggest that Kir2.1 current upregulation is a likely mechanism for rescuing the oscillations seen in islets from mice deficient in K(ATP) channels.
Author summary
Pulsatile insulin secretion is important for the proper regulation of blood glucose, and disruption of this pulsatility is a hallmark of type II diabetes. An ion channel was discovered more than three decades ago that conveys the metabolic state of insulin-secreting β-cells to the plasma membrane because it is blocked by ATP and opened by ADP, and thereby controls the activity of these electrically-excitable cells on a rapid time scale according to the prevailing blood glucose level. In addition to setting the appropriate level of insulin secretion, K(ATP) channels play a key role in generating the oscillations in cellular activity that underlie insulin pulsatility. It is therefore surprising that oscillations in activity persist in islets in which the K(ATP) channels are genetically knocked out. In this combined modeling and experimental study, we demonstrate that the role played by K(ATP) current in wild-type β-cells can be taken over by an inward-rectifying K+ current which, we show here, is upregulated in β-cells from SUR1 knockout mice. This result helps to resolve a mystery in the field that has remained elusive for more than a decade, since the first studies showing oscillations in SUR1-/- islets.
Introduction
Insulin is secreted from pancreatic islet β-cells in response to elevated blood glucose. Islet activity is oscillatory, with periods ranging from tens of seconds to several minutes, and this is reflected in the reported periods of pulsatile insulin secretion [1–4]. Plasma insulin oscillations play a physiological role in blood glucose regulation [5–8]. A recent study showed that the action of insulin on the liver to lower plasma glucose is more profound when insulin is delivered to the liver in a pulsatile fashion [9], and earlier studies showed that plasma insulin oscillations are disrupted in type II diabetics and their near relatives [10–12].
At stimulatory levels of glucose β-cells exhibit electrical bursting, and Ca2+ that enters the cells during each burst evokes a pulse of insulin secretion [7,13,14]. Several mechanisms have been proposed to explain this bursting electrical activity [15–18]. A recent mathematical model that combines two of these mechanisms can reproduce bursting having a wide range of periods, as seen in experimental studies [19]. One mechanism produces fast oscillations, while the other produces slow oscillations and both can oscillate independently, prompting the name Dual Oscillator Model (DOM). In the DOM, the fast component of bursting results from the negative feedback of Ca2+ on the membrane potential via Ca2+-activated K+ channels and, indirectly, via K(ATP) channel activation. The slow component, in contrast, is due to oscillations in glycolysis that occur as the result of actions of the allosteric enzyme phosphofructokinase (PFK)[20,21]. The subsequent oscillatory ATP production acts through ATP-sensitive K+ channels (K(ATP) channels) to produce oscillations in K(ATP) current, which turns the bursts of electrical activity on and off [22,23].
K(ATP) channels play a crucial role coupling cell metabolism to membrane potential. These channels are comprised of four inwardly rectifying K+ channel subunits (Kir6.2) and four sulfonylurea receptor subunits (SUR1) arranged in an octomeric array (for review see [24]). A mutation in the genes coding for either subunit prevents K(ATP) channels from being trafficked normally to the plasma membrane or alters their sensitivity to adenine nucleotides, leading to persistent hyperinsulinemic hypoglycemia of infancy (PHHI) in humans, a condition characterized by high insulin secretion that occurs even when blood glucose is low [25–27]. High secretion results from the permanent depolarization of the β-cell membrane that is due to the lack of normally hyperpolarizing K(ATP) current. Surprisingly, in SUR1 homozygous knockout mice (SUR1-/- mice), lacking K(ATP) channels, islets typically still exhibit electrical bursting (although the glucose sensitivity of bursting in these islets is largely abrogated), and blood glucose levels are relatively normal unless the animals are metabolically stressed [28,29]. Similarly, islets from Kir6.2 knockout mice exhibit slow Ca2+ oscillations, similar to those observed in wild-type islets which are known to be due to bursting electrical activity [30]. In these mice, compensation must therefore occur to overcome the loss of the large hyperpolarizing K(ATP) current. Indeed, when the K(ATP) channels of wild type islets are acutely blocked by sulfonylurea drugs, β-cells spike continuously from a sustained depolarized level [31–33]. We hypothesized that such compensation could be achieved through the upregulation of another hyperpolarizing K+ channel that impersonates K(ATP) channels in sensing cellular metabolism [34]. In a companion study (Vadrevu et al, manuscript in preparation), we demonstrated that the upregulation of Kir2.1 channel protein in islets from SUR1-/- mice (KO islets) could mediate this compensation. In the current report, we demonstrate that SUR1 KO islets exhibit sustained Ca2+ oscillations at stimulatory levels of glucose, and that the amount of inward rectifying K+ current is increased in these K(ATP) channel KO cells. Using mathematical modeling, we explored the functional role of this current on the electrical activity of islet β-cells when K(ATP) channels are absent. In particular, we investigated whether this inward-rectifying K+ current has the ability to rescue normal electrical bursting pattern in β-cells of SUR1-/- mouse islets.
Kir2.1 channels conduct large inward currents at voltages below the K+ Nernst potential (VK) and smaller outward currents at voltages above VK. This diode-like property, or inward rectification, is caused by blockade of the channels by intracellular ions and polyamines when the cell membrane is depolarized [35–37]. Kir2.1 channels also contain consensus sites for phosphorylation by protein kinase A (PKA) and studies show that PKA potentiates Kir2.1 current [38–40]. One study shows that a phosphatase inhibitor can prevent rundown of the Kir2.1 current that is activated by PKA, which indicates activation of the channels is regulated by protein phosphorylation [41]. Since PKA activity is cAMP-dependent, changes in the cAMP concentration in the β-cell can in principle regulate Kir2.1 channel activity. Recent studies employing FRET-based sensors and TIRF microscopy showed that glucose induces cAMP oscillations in mouse β-cells [42,43], which may be accounted for by oscillations in metabolism [44]. It is therefore possible that, in KO cells, metabolic oscillations drive cAMP oscillations which in turn drive oscillations in Kir2.1 current, and this replaces oscillations in K(ATP) current as the mechanism for bursting electrical activity. We illustrate how this works with the model, and make predictions that are subsequently confirmed experimentally and thereby support the hypothesis that Kir2.1 channel upregulation is a feasible mechanism which can rescue electrical bursting in SUR1-/- mouse islets lacking K(ATP) channels.
Materials and methods
Ethics statement
The animal protocol used was in accordance with the guidelines of the University of Michigan Institutional Animal Care and Use Committee (IACUC).
Islet preparation
Pancreatic islets were isolated from 3–4 month old male Swiss-Webster mice as in [45]. Islets were hand picked into fresh Kreb’s solution and then transferred to culture dishes containing RPMI-1640 supplemented with 10% FBS, glutamine and penicillin-streptomycin. Islets were cultured overnight at 37°C in an incubator. Electrophysiological recordings were made from islets cultured for 72 hours or less.
Electrophysiology
Patch electrodes were pulled (P-97, Sutter Instrument Co., Novato, CA) from borosilicate glass capillaries (Warner Instrument Inc., Hamden, CT) and had resistances of 8–10 M-ohm when filled with an internal buffer containing (in mM): 28.4 K2SO4, 63.7 KCl, 11.8 NaCl, 1 MgCl2, 20.8 HEPES and 0.5 EGTA at pH7.2. The electrodes were then backfilled with the same solution but containing amphotericin B at 0.3 mg/ml to allow membrane perforation. Islets were transferred from culture dishes into a 0.5 ml recording chamber held at 32–34°C. Islets were visualized using an inverted epifluorescence microscope (Olympus IX50, Tokyo, Japan). Pipette seals obtained were > 1 G-ohms. Recordings were made using an extracellular solution containing (in mM): 135 NaCl, 2.5 CaCl2, 4.8 KCl, 1.2 MgCl2, 20 HEPES, and 11.1 glucose.
Voltage ramps
After the establishment of a perforated patch, cells were voltage-clamped to a holding potential of -60 mV, and a 2-second voltage ramp from -120 to -50 mV was applied, as in [32]. Evoked currents were digitized at 10 kHz after filtering at 2.9 kHz. The protocols were generated using Patchmaster software (v2x32; HEKA Instruments).
Fura-2 imaging of cytosolic Ca2+ and pharmacological treatments
Pancreatic islets were cultured overnight in RPMI medium containing 5 mM glucose and on the day of experiments were transferred to fresh media containing 2.5 μM Fura-PE2-AM for 30 min. Following incubation, islets were loaded into a glass-bottomed chamber mounted onto the microscope stage. The chamber was perfused at 0.3 mL/min with 11 mM glucose solution and the ambient temperature was maintained at 33°C using inline solution and chamber heaters (Warner Instruments). Excitation was provided by a TILL Polychrome V monochromator (TILL Scientific, Germany) with light output set to 10% maximum. Excitation (x) or emission (m) filters (ET type; Chroma Technology, Bellows Falls, VT) were used in combination with an FF444/521/608-Di01 dichroic (Semrock, Lake Forest, IL) as follows: Fura-2, 340/10x and 380/10x, 535/30m (R340x/380x – 535m); A single region of interest was used to quantify the average response of each islet using MetaMorph software (Molecular Devices). In one set of experiments, after three oscillations were recorded, the solution was switched to a solution containing 11 mM glucose with thapsigargin (1 μM). In another set of experiments, the solution was switched to one containing 11 mM glucose and 8-Bromoadenosine 3’,5’-cyclic monophosphate (8-Br-cAMP) (50 μM).
Modeling
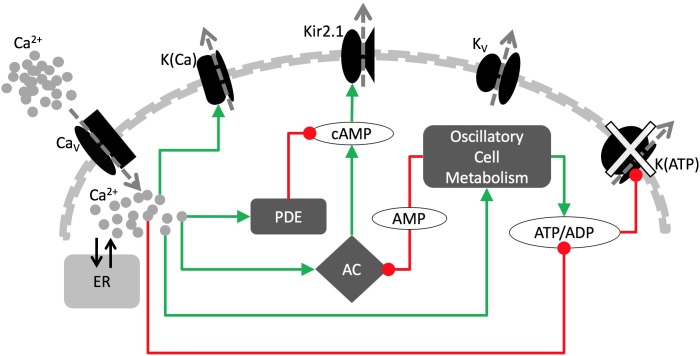
We used an 8-variable model consisting of ordinary differential equations, illustrated in Fig 1. This Dual Oscillator Model (DOM) has electrical, Ca2+, and metabolic components [23,46]. We focus our description on elements of the model that are most important for this study, but all equations and tables of parameter values are given in Supporting Information. (The computer codes, using the CVODE solver implemented in XPPAUT, can be downloaded as freeware from www.math.fsu.edu/~bertram/software/islet.) In the DOM, the fast oscillatory component is based on negative Ca2+ feedback onto the membrane potential through Ca2+-sensitive K+ current (IK(Ca)). This mechanism can drive fast bursting. The second oscillatory component is due to metabolic oscillations, which result from the activity of the allosteric enzyme phosphofructokinase (PFK). In the process of glycolysis, PFK catalyzes the phosphorylation of fructose 6-phosphate (F6P) to fructose 1,6-bisphosphate (FBP). The activity of PFK is increased by its product FBP, so that increased FBP increases the reaction rate and causes a sharp rise in FBP. This eventually depletes the substrate of the reaction, F6P, and turns off flux through PFK, resulting in a reduction in FBP. This allows the substrate, F6P, to recover and the cycle to restart. Oscillatory FBP levels in turn cause oscillations in pyruvate, the end product of glycolysis and the substrate for mitochondrial respiration. The oscillatory glycolytic input results in oscillatory levels of the nucleotide concentrations (ATP, ADP and AMP). The membrane potential is then affected through the action of ATP and ADP on K(ATP) channels, which can drive slow bursting in the model.
Fig 1. The key components of the model.
Green arrows are for stimulatory and red circles are for inhibitory pathways. In the wild-type cells, bursting is paced by metabolic oscillations acting on K(ATP) channels. In the KO cells, genetic disruption of K(ATP) channels leads to increased Kir2.1 current, which now drives bursting.
Equations for the dynamics of cAMP were recently added to an earlier version of the DOM [44] and it was shown that this version was capable of producing cAMP oscillations in model β-cells. We employed these equations, where the cAMP concentration is determined by the difference between its production by adenylyl cyclase (VAC) and degradation by phosphodiesterases (VPDE):
| (1) |
where,
| (2) |
| (3) |
where c is the cytosolic free Ca2+ concentration, which stimulates both AC and PDE. Cytosolic AMP (AMPc) inhibits AC and thus the production of cAMP [47–49]. We modified the VAC equation from the original model to incorporate a higher-order dependence on AMP. In the model, slow cAMP oscillations are the result of AMP oscillations and the accompanying Ca2+ oscillations, which are both the product of glycolytic oscillations. The details of the cAMP dynamics are given in [44].
In the DOM, the rate of change of the membrane potential of a wild type β-cell is given by a conductance-based Hodgkin-Huxley type equation:
| (4) |
where, Cm is the membrane capacitance, IK is the delayed rectifier K+ current, ICa is a voltage-sensitive Ca2+ current, IK(Ca) is a Ca2+-sensitive K+ current and IK(ATP) is an ATP-sensitive K+ current. The rate of change of the free cytosolic Ca2+ concentration is:
| (5) |
where terms labeled by Jmem and JER represent the Ca2+ flux across the plasma membrane and net flux out of the endoplasmic reticulum (ER), respectively. Here, fcyt is the fraction of free to total cytosolic Ca2+, α converts current to flux, kpmca is the Ca2+ pumping rate across the plasma membrane, kleak is the rate of the Ca2+ leak from the ER and kSERCA is the Ca2+ pumping rate into the ER. The ER Ca2+ concentration (cer) is also dynamic and given by:
| (6) |
where fer is the ratio of the free Ca2+ in the ER and Vcte is the ratio of the volume of the cytosol to the volume of the ER compartment. The equation for the Ca2+-sensitive K+ current (IK(Ca)) is,
| (7) |
where, gK(Ca) is the maximal conductance of the current, and ω is the following Ca2+-dependent activation function,
| (8) |
where Kc is the affinity constant.
In the KO-cells lacking K(ATP) channels there is no IK(ATP) present. In the model KO-cells, K(ATP) current is replaced by the following Kir2.1-mediated inward-rectifying K+ current:
| (9) |
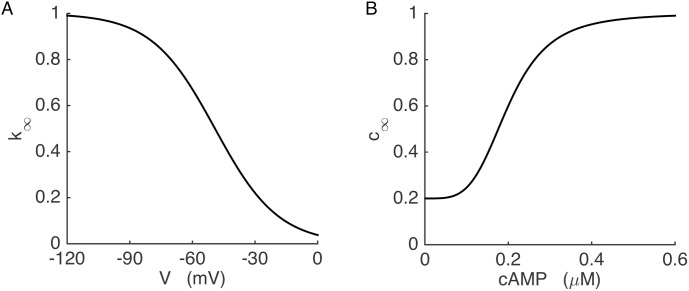
Here gKir is the maximal Kir2.1 channel conductance, k∞ is the voltage-dependent block of the channel by polyamines which is the cause of the inward rectification, and c∞ is the cAMP-dependent activation of the channels. We use a Boltzmann function to describe k∞:
| (10) |
where VKir is the half activation potential and sKir is the slope factor that determines the sensitivity to the voltage. The resulting voltage-dependent k∞ curve is shown in Fig 2A and is parameterized according to [50]. Kir2.1 current has both cAMP dependent and independent components [38], which are incorporated into the activation function c∞ as follows:
| (11) |
where αcamp is the cAMP independent component, and the cAMP dependency of the current is described by the second term. The c∞ function is illustrated in Fig 2B.
Fig 2. The Kir2.1 channel conductance depends on voltage and the cAMP concentration.
(A) Voltage-dependent blockade of the Kir2.1 current. (B) cAMP-dependent activation of the Kir2.1 current.
Results
An inward-rectifying K+ current is upregulated in SUR1-/- pancreatic β-cells
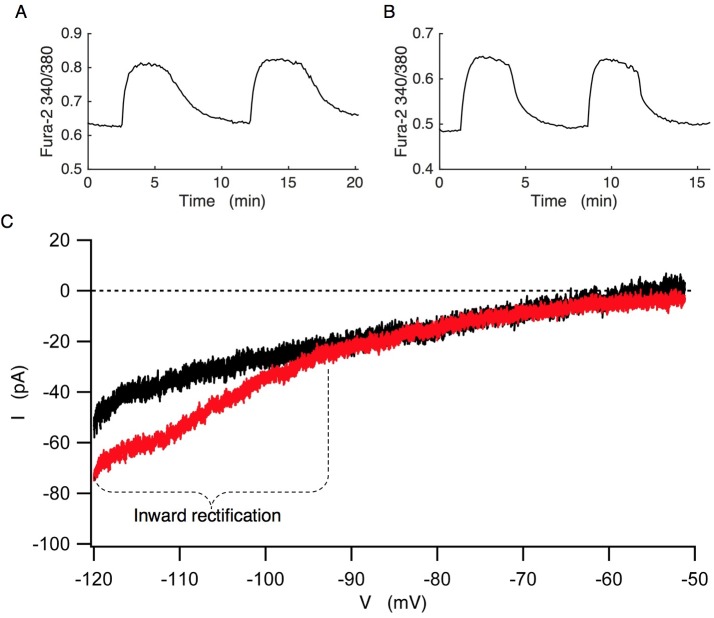
Ca2+ and membrane potential oscillations in SUR1-/- islets lacking functional K(ATP) channels were reported previously [28,51]. Our fura-2 Ca2+ measurements verified that slow cytosolic Ca2+ oscillations persisted in both wild-type (Fig 3A) and KO-islets (Fig 3B) perfused with 11 mM glucose. These data show that our SUR1-/- islets recapitulate the Ca2+ oscillations observed in [28,51].
Fig 3.
Fura-2 Ca2+ measurements from wild-type (A) and SUR1-/- islets (B) at 11 mM glucose. The change in Ca2+ is expressed as the Fura-2 340/380 ratio. (C) Comparison of I-V curves from wild-type (black) and SUR1-/- (red) β-cells. The wild-type recording is representative of n = 6 islets isolated from 4 mice. The SUR1-/- recording is representative of n = 8 islets isolated from 5 mice. The SUR1-/- islets exhibited significant inward rectification at more negative potentials compared to cells from wild-type islets.
We recently identified an increase in Kir2.1 channel protein in islets isolated from SUR1-/- mice (Vadrevu et al, manuscript in preparation). To verify the electrophysiological functionality of these channels in the β-cell membrane of KO islets, we measured current-voltage relations of wild-type and KO cells using the perforated patch clamp technique in peripheral islet β-cells. Fig 3C shows current recordings elicited by voltage ramp commands from -120 mV to -50 mV (see Materials and Methods) applied to wild-type islets (black) and K(ATP) KO islets (red).
In wild-type islets, the current-voltage relation is largely linear beyond about -110 mV (Fig 3C, black) (n = 6 islets from 4 mice), while in the KO cells the evoked current was more nonlinear, exhibiting inward rectification (Fig 3C, red). The strong inward rectification is likely due to current from the upregulated Kir2.1 inward-rectifying K+ channels that we report in a companion study (Vadrevu et al, manuscript in preparation), supporting a functional role for the upregulated Kir2.1 channel protein.
The model demonstrates that Kir2.1 channel upregulation can rescue bursting in SUR-/- islets
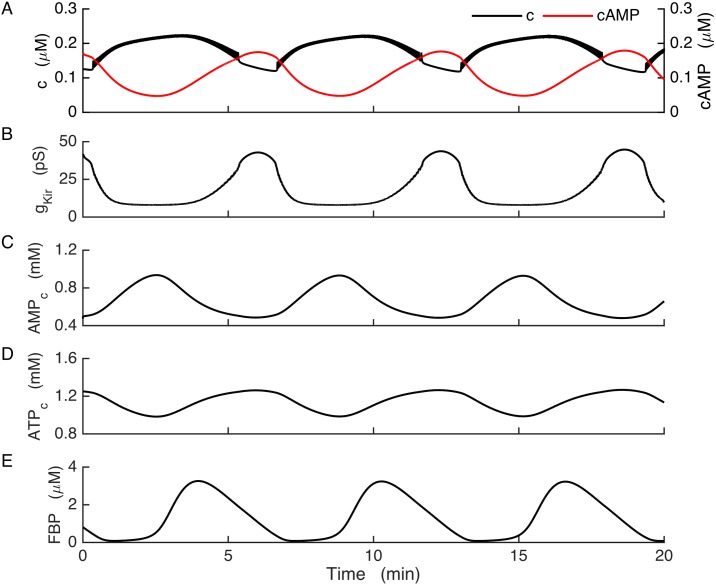
Fig 4 illustrates slow bursting produced by the model for the case of wild-type cells. The oscillations in the free Ca2+ concentration observed here (Fig 4A) result from the bursting electrical activity described earlier. The burst timing in this case is controlled by the slow glycolytic oscillations, which are reflected by the FBP time course as shown (Fig 4E). FBP oscillations in turn cause oscillations in downstream metabolic components, including cytosolic AMP and ATP (Fig 4C and 4D). The conductance of K(ATP) channels (gK(ATP)) is dependent on ADP and ATP levels, and oscillations in the concentrations of these nucleotides cause K(ATP) conductance (Fig 4B) and concomitantly K(ATP) current to oscillate and drive slow busting. The slow cAMP oscillations are modulated by Ca2+ and AMP, but in the model of the wild-type β-cells cAMP has no impact on the cell’s electrical activity.
Fig 4. Bursting in wild-type model cells.
Slow glycolytic oscillations drive bursting through actions on the K(ATP) current. (A) cAMP declines at the start of each Ca2+ plateau. (B) K(ATP) channel conductance. (C-D) Adenine nucleotide concentrations in the cytosol. (E) Slow glycolytic oscillations are reflected in the FBP time course.
If the key K(ATP) channels are removed, the model cell spikes continuously, as is seen experimentally when a K(ATP) channel blocker like tolbutamide is applied to a wild-type islet [31–33]. The upregulated Kir2.1 conductance shown in Fig 3C would be expected to also provide hyperpolarizing current, but can it rescue the bursting oscillations that are normally driven by K(ATP) current? To answer this, we replaced K(ATP) current in the model with Kir2.1 current to simulate the case for KO cells. The properties of this model current are discussed in Materials and Methods and are shown in Fig 2. A key feature of the Kir2.1 channels is their activation by cAMP [38–40].
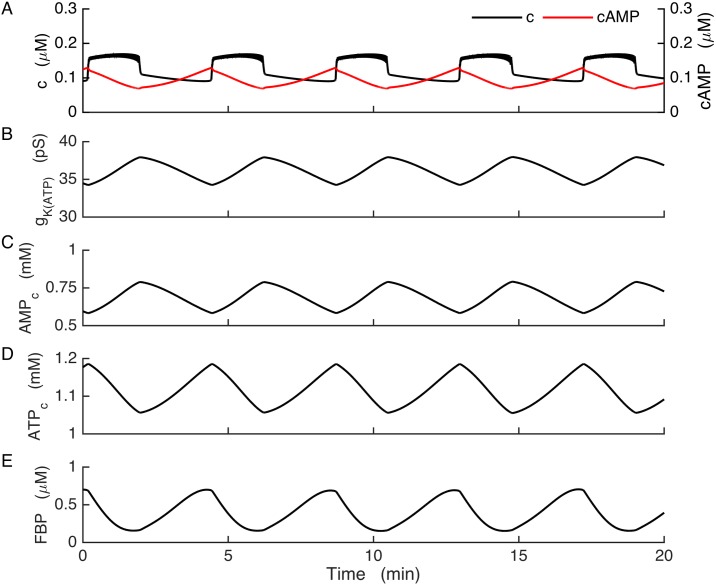
In Fig 5 we show that if Kir2.1 is sufficiently up-regulated, it can rescue slow bursting in model cells lacking K(ATP). In the model of the KO condition, slow glycolytic oscillations now drive slow AMPc oscillations (Fig 5C) that cause the cAMP concentration to oscillate (Fig 5A, red). cAMP in turn activates the Kir2.1 channels and results in oscillations in the Kir2.1 conductance (Fig 5B). This causes the membrane potential to switch between the active and silent phases, which drives bursting and Ca2+ oscillations as in the wild-type case (Fig 5A, black). The shape of the burst is largely determined by the details of the V and cAMP dependence of the Kir2.1 channels, which in our model is calibrated by data from a human isoform of the channel expressed in human embryonic kidney cells. Differences of channel properties between mouse and human would change the shape of the burst, but not the burst mechanism (unless channel differences were drastic). A robust property of the burst mechanism is that the cAMP concentration peaks during the silent phase in the KO model cells, unlike the wild-type model cells where cAMP peaks at the beginning of the active phase. This peak in cAMP is reflected in the Kir2.1 conductance. Fig 5B shows the moving average of this conductance, where averaging is done over a window of 6 s to filter out fast V-dependent changes. Like cAMP, the Kir2.1 conductance peaks during the silent phase, and the subsequent decline in this conductance starts the next burst. Although the ATP concentration also oscillates (Fig 5D), it does not affect the membrane potential in this case since there are no K(ATP) channels to sense changes in nucleotides.
Fig 5. Bursting in the model KO cells, where K(ATP) current is replaced with Kir2.1 current.
Glycolytic oscillations drive bursting through a cAMP-dependent pathway. (A) Ca2+ and cAMP concentrations oscillate in anti-phase. (B) Conductance of the Kir2.1 current, time averaged over a window of 6 s to remove fast variations and highlight the cAMP-dependent slow dynamics. (C) AMPc oscillations contribute to the production of cAMP oscillations. (D) ATPc oscillates due to oscillations in glycolysis. (E) FBP is the product of the PFK enzyme that is responsible for glycolytic oscillations. For this simulation, the glucokinase reaction rate was increased from 0.09 μM/ms to 0.14 μM/ms and kFBP was increased from 0.8 to 0.95.
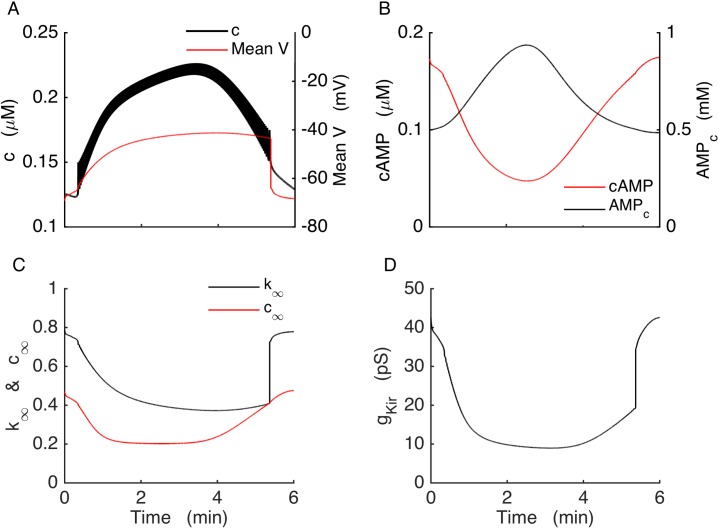
In the wild-type model cells, cAMP had no effect on membrane potential or any other components of the model. However, in the model we made of the KO cells, cAMP, acting through Kir2.1 channels, is now the key to slow bursting. To further understand how this occurs, a slow burst is shown in more detail in Fig 6. In this figure, voltage is averaged over the duration of each spike to illustrate mean voltage (Fig 6A, red). This allows us to focus on the slower burst waveform. The figure begins with the system in the silent phase, where Kir2.1 conductance is high (Fig 6D) due to elevated cAMP concentration (Fig 6B, red) and a relatively hyperpolarized voltage (Fig 6A, red). As glycolytic activity declines near the end of the silent phase AMPc slowly increases (Fig 6B, black). This, in turn, reduces the cAMP concentration by inhibiting adenylyl cyclase, thereby reducing Kir2.1 channel activation (Fig 6C, red). The resulting decline in Kir2.1 conductance initiates an active phase of electrical activity, further reducing Kir2.1 conductance due to voltage-dependent channel blockade as the cell depolarizes (Fig 6C, black). Cytosolic Ca2+ now increases due to Ca2+ influx through voltage-dependent Ca2+ channels and this activates Ca2+-ATPase pumps through ATP hydrolysis, further increasing the AMPc. This causes cAMP to decline rapidly. By the middle of the active phase AMP reaches its peak and then starts to decline. This decline, despite the continued rise in c, is due to the upstroke of the glycolytic oscillator, which facilitates the production of ATP at the expense of ADP and AMP. Decreased AMPc disinhibits adenylyl cyclase and cAMP again starts to increase. The cytosolic Ca2+ concentration starts to decrease only after cAMP is elevated enough to significantly activate Kir2.1 current (Fig 6C, red), eventually terminating the active phase.
Fig 6. In the model KO cells, bursting is driven by the Kir2.1 current, which is regulated by voltage and the cAMP concentration.
(A) Mean V and c during a burst. Voltage is averaged over each spike. (B) The cAMP and cytosolic AMP concentrations. (C) Dynamics of the Kir2.1 channel activation (c∞) and inactivation (k∞). (D) Kir2.1 conductance during a burst.
Oscillations are terminated by 8-Br-cAMP
The KO model relies on the action of cAMP oscillations on Kir2.1 channels to drive electrical bursting and Ca2+ oscillations in the SUR1-/- islets. If cAMP is tonically elevated, then the subsequent tonic activation of Kir2.1 should hyperpolarize the islet, terminating electrical bursting and Ca2+ oscillations, and bringing the intracellular Ca2+ concentration to a low level. We performed this manipulation by adding 8-Bromoadenosine 3’,5’-cyclic monophosphate (8-Br-cAMP) to wild-type and SUR1-/- islets. This is a membrane permeant brominated derivative of cAMP that is resistant to degradation by cAMP phosphodiesterase, and is thus long lasting.
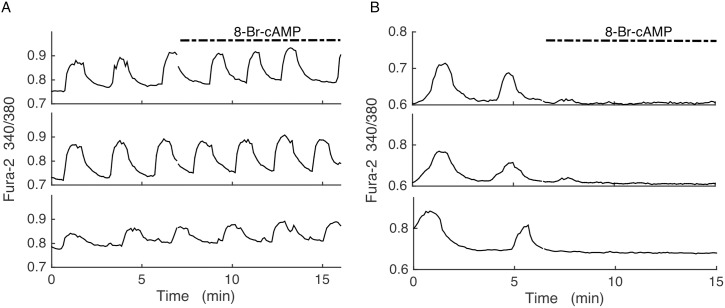
Application of 8-Br-cAMP (50 μM) to wild-type islets (N = 10) had little or no effect on Ca2+ oscillations, as shown in three representative islets (Fig 7A). In contrast, the same concentration applied to SUR1-/- islets terminated Ca2+ oscillations in all islets tested (N = 9), reducing the intracellular Ca2+ level to what is expected from a hyperpolarized islet (Fig 7B). This is consistent with the hypothesis that cAMP activates Kir2.1 channels, and that oscillations in cAMP drive oscillations in Ca2+ in SUR1-/- islets, but not wild-type islets.
Fig 7. Fura-2 Ca2+ measurements of islets in 11 mM glucose and, as indicated, 50 μM of the membrane permeable 8-Br-cAMP.
(A) Ca2+ oscillations in wild-type islets persist with little or no change upon application of 8-Br-cAMP. Representative of 10 islets. (B) Ca2+ oscillations in SUR1-/- islets are terminated by 8-Br-cAMP, and Ca2+ is at a low level. Representative of 9 islets.
Fast/slow analysis of the Kir2.1 model
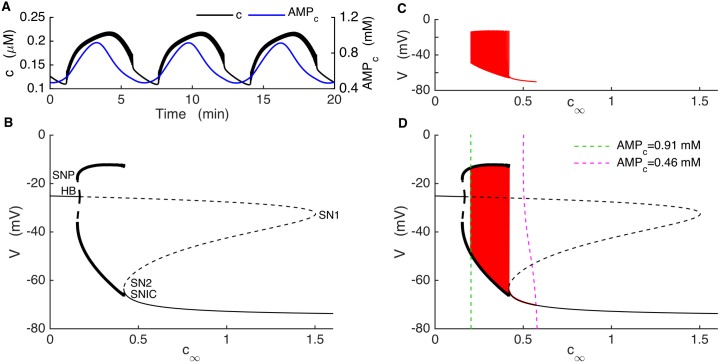
To better understand the dynamics of the bursting mechanism, and to help facilitate the design of new experiments, we performed a fast/slow analysis of the Kir2.1 model. Fast/slow analysis separates system variables into component fast and slow subsystems based on their respective time scales [52]. The slow variables are almost constant on the time scale of changes in the fast variables. Therefore, these variables can be treated as slowly-varying parameters of the fast subsystem. In our model, the fast variables are voltage (V), the activation variable for voltage-gated K+ current (n) and cytosolic Ca2+ (c). The variables that change on much slower time scales are fructose 6-phosphate (F6P), fructose 1,6-bisphosphate (FBP), ATPc, AMPc, cAMP and the Ca2+ concentration of the ER (cer). For comparison, Fig 8A shows a fast variable (c) shown together with a slow variable AMPc. At the start of a burst active phase c immediately jumps to a plateau and exhibits small oscillations due to the voltage spikes, and jumps down at the end of the active phase. In contrast, AMPc exhibits a slow rise and fall, with a peak near the middle of the active phase. We start the fast/slow analysis by setting cer to its mean value, since it is not a part of the primary oscillatory mechanism. The slow variables other than cer interact according to the following scheme:
where only cAMP directly affects the fast subsystem, through the cAMP-dependent activation variable of IKir (c∞). We first generate a bifurcation diagram of the fast subsystem with c∞ as the bifurcation parameter (Fig 8B), since the curve is simpler than that obtained using cAMP itself as the bifurcation parameter. For small values of c∞ the system is at a depolarized steady state, since the Kir2.1 current is largely turned off. These stable steady states make up the initial segment of the upper branch of the z-shaped curve (solid line), which we refer to as the z-curve. As c∞ is increased two branches of periodic solutions, one stable (bold solid curve) and one unstable (bold dashed curve), emerge at a saddle node of periodics (SNP) bifurcation. The branch of unstable limit cycles is created at a subcritical Hopf Bifurcation (HB), at which point the branch of stable steady states becomes unstable (dashed curve). The branch of unstable steady states turns at a saddle-node bifurcation (SN1), forming the middle branch of the z-curve. This branch turns at another saddle-node bifurcation (SN2) and forms the stable lower branch of the z-curve. The stable branch of periodic solutions reflects tonic spiking, and the minimum and maximum voltage values during a spike are shown as two separate curves. This branch terminates at the left knee of the z-curve at a saddle-node on invariant circle (SNIC) bifurcation.
Fig 8. Glycolytic oscillations drive bursting in the model KO cell.
(A) c (black) oscillates reflecting bursting electrical activity, while AMPc oscillates (blue) reflecting glycolytic oscillations. (B) Bifurcation diagram of the fast subsystem, with c∞ as bifurcation parameter. HB = Hopf bifurcation, SN = saddle-node bifurcation, SNIC = saddle-node on invariant circle bifurcation. Solid and dashed curves represent stable and unstable steady states, respectively, while bold solid and bold dashed curves represent stable and unstable limit cycles, respectively. (C) The burst trajectory projected onto the c∞-V plane. (D) Fast/slow analysis of bursting, with the burst trajectory (red) and c∞ curve superimposed onto the fast-subsystem bifurcation diagram. The c∞ curve is shown for AMPc at its minimum (dashed magenta) and maximum (dashed green) during a burst.
The burst trajectory is shown projected into the c∞-V plane in Fig 8C. The left portion of the trajectory reflects the active phase of the burst when the model cell is spiking. When the cell enters the silent phase c∞ first increases and then decreases to start a new active phase. This is the right portion of the trajectory. The burst trajectory is superimposed onto the z-curve in Fig 8D, along the c∞ curve (Eq 11). This curve depends on the cAMP concentration, which has the following steady state function:
| (12) |
where VAC is the rate of adenylyl cyclase production and is inhibited by AMPc (Eq 2). AMPc changes slowly during a burst (Fig 8A, blue) due to the activity of the glycolytic oscillator. The steady-state cytosolic Ca2+ concentration in Eq 12 (ciss) is given by:
| (13) |
where ICa is a function of V and cer is clamped at its mean value. This gives the voltage dependence to the c∞ curve.
During the burst, the glycolytic oscillator moves the c∞ curve back and forth. In Fig 8D the curve is plotted for values of AMPc at its minimum and its maximum during a burst. During a burst AMPc moves between these minimum and maximum values and shifts the c∞ curve back and forth. For small values of AMPc, the c∞ curve is shifted to the right (magenta dashed curve), intersecting the z-curve on the bottom stationary branch. At this point the system is in its hyperpolarized silent phase. As AMPc slowly increases the c∞ curve shifts to the left and the phase point follows it. When the curve passes the knee, the phase point is attracted to the periodic spiking branch, starting the active phase. The phase point follows the periodic branch to the left until AMPc reaches its maximum (green dashed curve). From here AMPc declines and shifts the c∞ curve rightward, bringing the phase point with it. The c∞ curve eventually reaches SN2 again and intersects the stable stationary branch initiating a silent phase. It keeps moving rightward as AMPc continues to decline, bringing the phase point with it. Eventually AMPc begins to rise, restarting the cycle. This is parabolic bursting since the spike frequency during a burst follows a parabolic time course, low at the beginning and the end as the phase point passes near the infinite-period SNIC bifurcation [53]. As the fast subsystem bifurcation diagram lacks a bistable region, the glycolytic oscillations are necessary for the production of bursting in the Kir2.1 model.
An alternate bursting mechanism
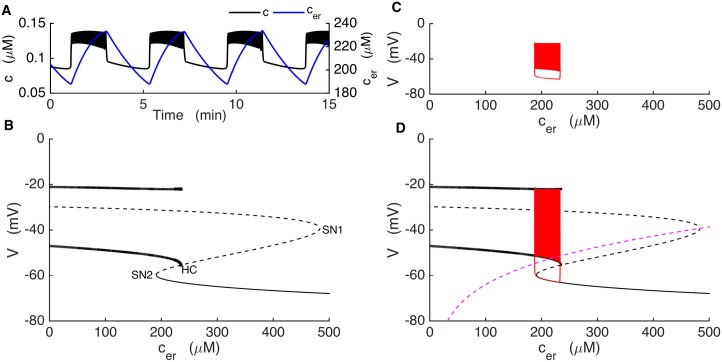
To address whether the upregulation of other types of K+ channels might yield effects similar to those of Kir2.1, we examined the effects of replacing K(ATP) current with an alternative hyperpolarizing constant-conductance or “leak” K+ current, instead of Kir2.1 current, and increased the K(Ca) channel conductance (Fig 9). With these modifications, bursting could be produced in the absence of K(ATP) due to Ca2+ feedback onto K(Ca) channels (Fig 9A). In this model, ER Ca2+, which played little or no role in bursting produced using the Kir2.1 model, became absolutely essential in driving the burst.
Fig 9. The model KO cell can produce bursting with upregulation of a constant-conductance (leak) K+ current and a K(Ca) conductance: gleak = 32.5 pS, gK(Ca) = 90 pS.
(A) Negative feedback of c (black) on the membrane potential and slow cer (blue) oscillations drive bursting. (B) The fast-subsystem bifurcation diagram exhibits an interval of bistability between the saddle-node bifurcation SN2 and the homoclinic bifurcation HC. (C) A projection of the burst trajectory. (D) Fast/slow analysis, with the burst trajectory (red) and the cer nullcline (magenta) superimposed on the fast-subsystem bifurcation diagram. The trajectory moves leftward during the silent phase and rightward during the active phase.
Glycolytic oscillations are now irrelevant since they do not change the membrane potential or contribute to burst generation in any way. The fast subsystem consists of three variables in this case, V, n, and c, and a slow variable cer, which we consider as a slowly-varying parameter of the fast subsystem. The fast-subsystem bifurcation diagram is shown in Fig 9B. Unlike with the Kir2.1 model (Fig 8), there is a bistable interval in the z-curve, where stable steady states coexist with stable periodic solutions (between the saddle-node bifurcation SN2 and the homoclinic bifurcation HC). The burst trajectory is projected into the cer-V plane in Fig 9C, and superimposed on the fast-subsystem bifurcation diagram in Fig 9D. Also superimposed is the cer nullcline, the curve where the cer derivative is 0. Bursting is produced as the trajectory moves to the left along the bottom stationary branch of the z-curve during the silent phase and to the right along the periodic branch during the active phase, utilizing the fast-subsystem bistability. This is standard square-wave or type 1 bursting that has been described previously for other models of bursting in β-cells and in neurons [52,54].
Experimental test distinguishes the two models
We have thus far described two possible ways in which the upregulation of hyperpolarizing K+ channels can rescue bursting in SUR1-/- β-cells. As one clear difference between the two alternative mechanisms is their dependence on ER Ca2+ concentration, we explored the consequences of manipulating the ER Ca2+ concentration as a way of determining which model is more likely the correct one. This can be done experimentally by blocking the Ca2+ pumps on the ER membrane (the SERCA pumps) using the agent thapsigargin [55].
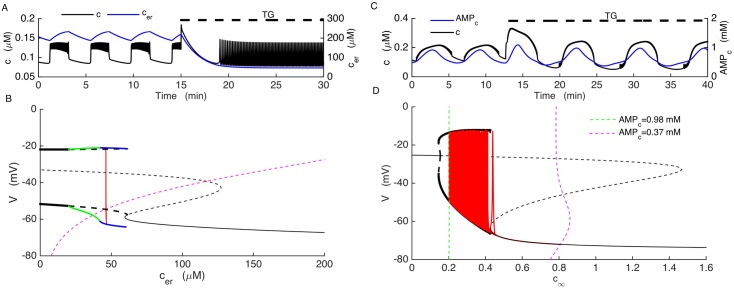
In the model, the parameter kSERCA is the Ca2+ pumping rate into the ER from the cytosol. To mimic the effect of thapsigargin we reduced kSERCA by a factor of 4. In the ER bursting model, this greatly lowered cer (Fig 10A, blue trace) and converted slow bursting into fast two-spike bursting (Fig 10A, black trace). In terms of the fast/slow analysis (Fig 9B), the reduction in kSERCA shifts the z-curve and cer nullcline far to the left. In addition, the periodic tonic spiking branch is destabilized through a period doubling bifurcation, and the resulting period doubled branch itself loses stability at a period doubling bifurcation. In fact, there is a period doubling cascade (green curve), leading ultimately to a branch of fast two-spike bursting (blue curve). The trajectory (red curve) moves to this latter curve at the new equilibrium value of cer. Thus, the slow bursting is replaced by very fast 2-spike bursting.
Fig 10. Distinct model predictions of the effects of partial inhibition of SERCA pumps with thapsigargin distinguishes the two models.
(A) In the model where bursting is driven by oscillations in the ER calcium concentration simulation of TG application reduces the cer (red) and terminates slow c oscillations (black). (B) In this model, the z-curve and cer nullcline are shifted far to the left and the periodic spiking branch is destabilized. The new stable periodic branch exhibits fast two-spike bursting at the value of cer at which the trajectory settles. (C) In the model in which bursting is driven by oscillations in the Kir2.1 current, bursting continues after TG application (black) because the AMPc oscillations (red) persist. (D) In this model, TG increases the amplitude of the AMPc oscillations, which shifts the c∞ curve further to the right and increases the period of oscillations, but the burst mechanism is unaltered.
In the Kir2.1 model, in contrast, bursting persisted even when SERCA pumps were inhibited (Fig 10C, black). This is because bursting in this case is driven by the activity of the glycolytic oscillator. Blocking SERCA pumps lowers mean cer, which affects the cytosolic Ca2+ level, but this only modulates the slow bursting pattern rather than abolishing it. Indeed, the fast/slow analysis illustrates that the burst mechanism is very similar in this case to what it was before the reduction in kSERCA (Fig 10D). The main difference is that the period of bursting is now increased, since the c∞ curve moves further to the right during the silent phase (Fig 10D, dashed magenta curve).
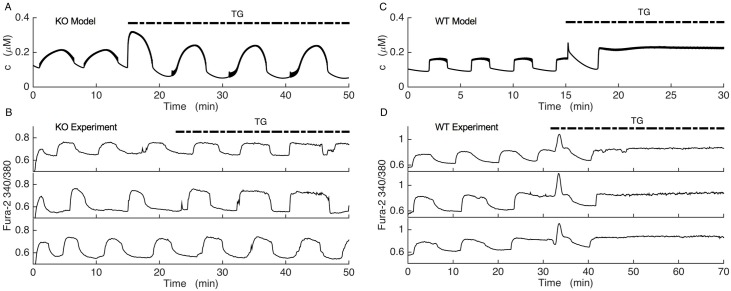
These simulations make a testable prediction that can eliminate one or the other of the compensation models. We subsequently tested the predictions in the lab, by treating oscillating SUR1-/- islets with thapsigargin (TG). Fig 11 shows the model prediction obtained with the Kir2.1 model on the top row and the results of the experiments on the bottom three rows (three SUR-/- islets and three wild-type islets are shown). TG application did not terminate slow Ca2+ oscillations in any of the SUR1-/- islets shown (Fig 11B), as predicted by the Kir2.1 model (Fig 11A). In fact, Ca2+ oscillations persisted in all 10 of the KO islets tested, with only a small change in the properties of the oscillations. Before TG treatment the oscillation period was 7.3 ± 1.2 min and the duty cycle (duration of elevated Ca2+ divided by the period) was 0.4 ± 0.08. After TG application there was a slight increase in period to 7.6 ± 1.1 min and the duty cycle increased to 0.6 ± 0.06. The slow Ca2+ decline that occurs at the end of each active phase prior to TG application, characteristic of Ca2+ leaking out of the ER and into the cytosol, was eliminated by the application of TG, as expected [56,57]. The persistence of oscillations when TG is applied is in clear contrast with the wild-type model (the model that has K(ATP) current) and wild-type islets, where in most of the wild-type islets tested TG converted slow oscillations (with period 10.6 ± 0.9 min and duty cycle 0.5 ± 0.06) to continuous spiking or fast bursting with an elevated cytosolic Ca2+ level (in 13 of 14 islets tested) (Fig 11C and 11D). A similar effect of TG on slow Ca2+ oscillations was previously observed in islets [58]. Since the response to TG confirms the prediction of the Kir2.1 model, but not the ER bursting model, we conclude that the Kir2.1 model is a more likely candidate to account for the compensation that occurs in SUR1-/- islets. That is, the data support the hypothesis that bursting observed in KO islets is due to compensatory upregulation of Kir2.1 channels.
Fig 11. Fura-2 Ca2+ measurements of SUR1-/- and wild-type islets compared with model simulations.
In the experiments, the change in Ca2+ is expressed as the fura-2 340/380 fluorescence ratio. (A) In the Kir2.1 model, the parameter kSERCA is reduced by a factor of 4 to mimic application of the SERCA pump blocker thapsigargin (TG). (B) Fura-2 Ca2+ measurements from 3 representative SUR1-/- islets. Islets were maintained in 11 mM glucose, and the irreversible SERCA pump blocker TG was applied as indicated. Slow Ca2+ oscillations persisted after TG application in all 10 KO islets tested, as predicted by the model. (C) In the wild-type model, parameter kSERCA was reduced by a factor of 4 to simulate TG application. D) Fura-2 Ca2+ measurements from 3 representative wild-type islets maintained in 11 mM glucose. TG was applied as indicated. Slow Ca2+ oscillations were replaced by sustained elevation in Ca2+ reflecting continuous spiking or fast bursting in 13 of 14 wild-type islets tested, as predicted.
Discussion
The primary aim of this modeling study was to help understand how islet β-cells can compensate for the genetic knockout of K(ATP) channels in SUR1-/- mice. One focus was on Kir2.1 channels, which we found to be upregulated in the SUR1-/- mice (Vadrevu et al, manuscript in preparation). We showed that upregulation of these channels can maintain bursting, even though the K(ATP) channels that normally couple metabolic oscillations to plasma membrane K+ channel activity are missing. This requires that the Kir channels have a dependence on cAMP, as has been reported previously for Kir2.1 channels [38–41]. It has also been reported that cAMP exhibits slow oscillations in insulin-secreting MIN6 cells [43] and in islet β-cells [42,43], a behavior which could reflect oscillations in the nucleotide AMP [44]. Indeed, we were not able to observe bursting in simulations of K(ATP) KO islets if AMP regulation of cAMP was omitted. We did, however, show an alternative mechanism that could produce bursting in the KO islets in a manner that is independent of Kir2.1 current. The two models made very different predictions for the effects of blocking Ca2+ pumps in the ER membrane, and subsequent experiments with the SERCA pump blocker thapsigargin supported the Kir2.1 model over the alternate model. Of course, we do not suggest that these are the only two models that might be capable of mediating bursting in the absence of K(ATP). For example, there are data showing that Mg:ATP can stimulate Kir channels, providing another means by which metabolic oscillations could cause bursting electrical activity [38]. We do show, however, that the two models examined herein are both feasible, and that they are experimentally discernable.
A key hypothesis that we make in the Kir2.1 model is that cAMP regulates Kir2.1 current in SUR1-/- islets, likely through PKA as described in [38–41], rather than direct metabolic regulation of the channels. A consequence of this hypothesis is that manipulations that increase the cAMP level should hyperpolarize the islet and terminate Ca2+ oscillations. Indeed, we found this to be the case. Application of 8-Br-cAMP had no apparent effect on Ca2+ oscillations in wild-type islets (Fig 7A), but terminated oscillations and brought Ca2+ to a resting level in SUR1-/- islets. This is what we predict, since we expect little or no expression of Kir2.1 channels in wild-type islets, but significant expression in SUR1-/- islets (Fig 3). The data of Fig 7 do not preclude the possibility that cAMP activates another type of K+ channel in SUR1-/- islets, but other data show that the upregulated current is an inward-rectifying K+ current (Fig 3). If this upregulated Kir current were regulated directly by metabolism rather than cAMP, it is hard to explain why increasing the cAMP level with membrane permeable 8-Br-cAMP would terminate Ca2+ oscillations and bring Ca2+ to a resting level.
Another hypothesis that we make is that cAMP oscillates in SUR1-/- islets. This has not yet been demonstrated, as it has been in wild-type islets [42,43]. However, we have previously reported that slow NAD(P)H oscillations persist in the SUR1-/- islets (Merrins et al, 2010), indicating the existence of metabolic oscillations which could drive cAMP oscillations as in our model. In glucose-stimulated wild-type islets the glycolytic product fructose 1,6-bisphosphate exhibits oscillations coincident with electrical bursting and Ca2+ oscillations [59], and there are slow oscillations in oxygen consumption [60] and NAD(P)H [61,62]. At present, we do not yet know if the metabolic oscillations in fact result in cyclic AMP oscillations in SUR1-/- islets.
The upregulation of Kir2.1 channels we propose might result from the expected increase in β-cell electrical activity that occurs when K(ATP) channel formation is disrupted by the genetic deletion of SUR1, although when this occurs developmentally is not clear. It is well established that dramatic changes in electrical activity can regulate the expression of ion channels in excitable cells [63–65]. This may result from the increased intracellular Ca2+ concentration that accompanies increased electrical activity, which can enhance gene expression [66,67]. This feedback process would guard against the production of excessive Ca2+ levels in the cell, which can in turn induce apoptosis [68].
One prediction of the Kir2.1 model is that the Ca2+ and cAMP oscillations should be 180° out of phase with one another in the KO cells (Fig 5A). This differs considerably from the wild-type case, where cAMP has a saw-tooth pattern and declines during the burst active phase and then rises during the silent phase (Fig 4A). While cAMP levels have been measured simultaneously with Ca2+ in MIN6 cells and the time course is in general agreement with the model [43], such measurements have not yet been made in SUR1-/- islets. A study performed in MIN6 β-cells in which Ca2+ oscillations were induced with the aid of the K+ channel blocker tetraethylammonium (TEA) showed oscillations in protein kinase A activity that was generally in phase with cAMP oscillations, indicating that the kinase kinetics were sufficiently fast to resolve the roughly 6-min oscillations in the cAMP concentration [69]. Our model would predict this, for both wild-type and SUR1-/- islets. The PKA oscillations could affect islet β-cells in ways other than or in addition to phosphorylation of Kir channels, such as phosphorylation of L-type Ca2+ channels as has been demonstrated in the TC3 β-cell line [70].
Glycolytic oscillations are well established in yeast [71], but until recently there was no direct evidence that they occur in islet β-cells. However, recent studies using a FRET sensor for the glycolytic enzyme pyruvate kinase provide direct evidence for the existence of glycolytic oscillations in islets [72,59]. These metabolic oscillations are readily transmitted to the membrane potential through the cyclic activity of K(ATP) channels [46](Fig 4), and we have now illustrated how these can drive bursting even in the absence of K(ATP) channels by utilizing the cAMP dependence of upregulated Kir2.1 channels. It is not obvious how Kir2.1 channel expression increases to an appropriate level so that bursting is produced when K(ATP) channels are missing, but it is plausible that channel compensation is achieved through the actions of Ca2+ on Ca2+-dependent activators or inhibitors of transcription factors. A further modeling study for the dynamic regulation of Kir2.1 channel expression is currently under way.
Supporting information
Equations and parameter values for the model.
(DOCX)
(TXT)
(TXT)
(PXP)
(TXT)
(TXT)
(TXT)
(TXT)
Acknowledgments
The authors thank Arthur Sherman for helpful discussions and for a critical reading of the manuscript.
Data Availability
All data are available as supporting data for this manuscript. Computer codes are available for free download at www.math.fsu.edu/~bertram/software/islet.
Funding Statement
This research was partially supported by grant number R01-DK46409 from the National Institute of Diabetes and Digestive and Kidney Diseases (https://www.niddk.nih.gov) to LSS and by grant number DMS-1612193 from the National Science Foundation (https://www.nsf.gov) to RB. The funders had no role in study design, data collection and analysis, decision to publish, or preparation of the manuscript.
References
- 1.Pørksen N. The in vivo regulation of pulsatile insulin secretion. Diabetologia. 2002;45: 3–20. doi: 10.1007/s001250200001 [DOI] [PubMed] [Google Scholar]
- 2.Nunemaker CS, Zhang M, Wasserman DH, McGuinness OP, Powers AC, Bertram R, et al. Individual mice can be distinguished by the period of their islet calcium oscillations: Is there an intrinsic islet period that is imprinted in vivo? Diabetes. 2005;54: 3517–3522. doi: 10.2337/diabetes.54.12.3517 [DOI] [PubMed] [Google Scholar]
- 3.Song SH, McIntyre SS, Shah H, Veldhuis JD, Hayes PC, Butler PC. Direct measurement of pulsatile insulin secretion form the portal vein in human subjects. J Clin Endocrinol Metab. 2007;85: 4491–4499. [DOI] [PubMed] [Google Scholar]
- 4.Matveyenko AV, Veldhuis JD, Butler PC. Measurement of pulsatile insulin secretion in the rat: Direct sampling from the hepatic portal vein. Am J Physiol. 2008;295: E569–E574. doi: 10.1152/ajpendo.90335.2008 [DOI] [PMC free article] [PubMed] [Google Scholar]
- 5.Matthews DR, Naylor BA, Jones RG. Pulsatile insulin has greater hypoglycemic effect than continuous delivery. Diabetes. 1983. 32(7): 617–621. doi: 10.2337/diabetes.32.7.617 [DOI] [PubMed] [Google Scholar]
- 6.Paolisso G, Scheen AJ, Giugliano D, Sgambato S, Albert A, Varricchio M, et al. Pulsatile insulin delivery has greater metabolic effects than continuous hormone administration in man: Importance of pulse frequency. J Clin Endocrinol Metab. The Endocrine Society; 1991;72: 607–615. doi: 10.1210/jcem-72-3-607 [DOI] [PubMed] [Google Scholar]
- 7.Hellman B. Pulsatility of insulin release—A clinically important phenomenon. Ups J Med Sci. 2009;114: 193–205. doi: 10.3109/03009730903366075 [DOI] [PMC free article] [PubMed] [Google Scholar]
- 8.Satin LS, Butler PC, Ha J, Sherman AS. Pulsatile insulin secretion, impaired glucose tolerance and type 2 diabetes. Molecular Aspects of Medicine. 2015. pp. 61–77. doi: 10.1016/j.mam.2015.01.003 [DOI] [PMC free article] [PubMed] [Google Scholar]
- 9.Matveyenko AV, Liuwantara D, Gurlo T, Kirakossian D, Dalla Man C, Cobelli C, et al. Pulsatile portal vein insulin delivery enhances hepatic insulin action and signaling. Diabetes. 2012;61: 2269–2279. doi: 10.2337/db11-1462 [DOI] [PMC free article] [PubMed] [Google Scholar]
- 10.Matthews DR, Lang DA, Burnett MA, Turner RC. Control of pulsatile insulin secretion in man. Diabetologia. 1983;24: 231–237. doi: 10.1007/BF00282705 [DOI] [PubMed] [Google Scholar]
- 11.O’Rahilly S, Turner RC, Matthews DR. Impaired pulsatile secretion of insulin in relatives of patients with non-insulin-dependent diabetes. N Engl J Med. 1988;318: 1225–1230. doi: 10.1056/NEJM198805123181902 [DOI] [PubMed] [Google Scholar]
- 12.Polonsky KS, Given BD, Hirsch LJ, Tillil H, Shapiro ET, Beebe C, et al. Abnormal patterns of insulin secretion in non-insulin-dependent diabetes mellitus. N Engl J Med. 1988;318: 1231–1239. doi: 10.1056/NEJM198805123181903 [DOI] [PubMed] [Google Scholar]
- 13.Gilon P, Shepherd RM, Henquin JC. Oscillations of secretion driven by oscillations of cytoplasmic Ca2+ as evidenced in single pancreatic islets. J Biol Chem. 1993;268: 22265–22268. [PubMed] [Google Scholar]
- 14.Bergsten P, Grapengiesser E, Gylfe E, Tengholm A, Hellman B. Synchronous oscillations of cytoplasmic Ca2+ and insulin release in glucose-stimulated pancreatic islets. J Biol Chem. 1994;269: 8749–8753. [PubMed] [Google Scholar]
- 15.Chay TR, Keizer J. Minimal model for membrane oscillations in the pancreatic β-cell. Biophys J. 1983;42: 181–190. doi: 10.1016/S0006-3495(83)84384-7 [DOI] [PMC free article] [PubMed] [Google Scholar]
- 16.Keizer J, Magnus G. ATP-sensitive potassium channel and bursting in the pancreatic β-cell. A theoretical study. Biophys J. 1989;56: 229–242. doi: 10.1016/S0006-3495(89)82669-4 [DOI] [PMC free article] [PubMed] [Google Scholar]
- 17.Fridlyand LE, Tamarina N, Philipson LH. Modeling of Ca2+ flux in pancreatic β-cells: Role of the plasma membrane and intracellular stores. Am J Physiol. 2003;285: E138–E154. doi: 10.1152/ajpendo.00194.2002 [DOI] [PubMed] [Google Scholar]
- 18.Cha CY, Nakamura Y, Himeno Y, Wang J, Fujimoto S, Inagaki N, et al. Ionic mechanisms and Ca2+ dynamics underlying the glucose response of pancreatic β-cells: A simulation study. J Gen Physiol. 2011;138: 21–37. doi: 10.1085/jgp.201110611 [DOI] [PMC free article] [PubMed] [Google Scholar]
- 19.Bertram R, Sherman A, Satin LS. Metabolic and electrical oscillations: Partners in controlling pulsatile insulin secretion. Am J Physiol. 2007;293: E890–E900. doi: 10.1152/ajpendo.00359.2007 [DOI] [PubMed] [Google Scholar]
- 20.Smolen P. A model for glycolytic oscillations based on skeletal muscle phosphofructokinase kinetics. J Theor Biol. 1995;174: 137–148. doi: 10.1006/jtbi.1995.0087 [DOI] [PubMed] [Google Scholar]
- 21.Tornheim K. Are metabolic oscillations responsible for normal oscillatory insulin secretion? Diabetes. 1997. 46(9):1375–1380. doi: 10.2337/diabetes.46.9.1375 [DOI] [PubMed] [Google Scholar]
- 22.Bertram R, Satin L, Zhang M, Smolen P, Sherman A. Calcium and glycolysis mediate multiple bursting modes in pancreatic islets. Biophys J. 2004;87: 3074–3087. doi: 10.1529/biophysj.104.049262 [DOI] [PMC free article] [PubMed] [Google Scholar]
- 23.Watts M, Fendler B, Merrins M, Satin LS, Bertram R, Sherman A. Calcium and metabolic oscillations in pancreatic islets: Who’s driving the bus? SIAM J Appl Dyn Syst. 2014;13: 683–703. doi: 10.1137/130920198 [DOI] [PMC free article] [PubMed] [Google Scholar]
- 24.Nichols CG. KATP channels as molecular sensors of cellular metabolism. Nature. 2006;440: 470–476. doi: 10.1038/nature04711 [DOI] [PubMed] [Google Scholar]
- 25.Kane C, Shepherd RM, Squires PE, Johnson PR, James RF, Milla PJ, et al. Loss of functional KATP channels in pancreatic β-cells causes persistent hyperinsulinemic hypoglycemia of infancy. Nat Med. 1996;2: 1344–1347. doi: 10.1038/nm1296-1344 [DOI] [PubMed] [Google Scholar]
- 26.Bennett K, James C, Hussain K. Pancreatic β-cell KATP channels: Hypoglycaemia and hyperglycaemia. Rev Endocr Metab Disord. 2010;11: 157–163. doi: 10.1007/s11154-010-9144-2 [DOI] [PubMed] [Google Scholar]
- 27.Shah P, Demirbilek H, Hussain K. Persistent hyperinsulinaemic hypoglycaemia in infancy. Semin Pediatr Surg. Elsevier; 2014;23: 76–82. doi: 10.1053/j.sempedsurg.2014.03.005 [DOI] [PubMed] [Google Scholar]
- 28.Düfer M, Haspel D, Krippeit-Drews P, Aguilar-Bryan L, Bryan J, Drews G. Oscillations of membrane potential and cytosolic Ca2+ concentration in SUR1-/- β-cells. Diabetologia. 2004;47: 488–498. doi: 10.1007/s00125-004-1348-0 [DOI] [PubMed] [Google Scholar]
- 29.Seghers V, Nakazaki M, DeMayo F, Aguilar-Bryan L, Bryan J. Sur1 knockout mice. A model for KATP channel-independent regulation of insulin secretion. J Biol Chem. 2000;275: 9270–9277. doi: 10.1074/jbc.275.13.9270 [DOI] [PubMed] [Google Scholar]
- 30.Ravier MA, Nenquin M, Miki T, Seino S, Henquin J- C. Glucose controls cytosolic Ca2+ and insulin secretion in mouse islets lacking adenosine triphosphate-sensitive K+ channels owing to a knockout of the pore-forming subunit Kir6.2. Endocrinology. 2009, 150(1):33–45. doi: 10.1210/en.2008-0617 [DOI] [PubMed] [Google Scholar]
- 31.Larsson O, Kindmark H, Brandstrom R, Fredholm B, Berggren PO. Oscillations in KATP channel activity promote oscillations in cytoplasmic free Ca2+ concentration in the pancreatic β-cell. Proc Natl Acad Sci U S A. 1996;93: 5161–5165. doi: 10.1073/pnas.93.10.5161 [DOI] [PMC free article] [PubMed] [Google Scholar]
- 32.Ren J, Sherman A, Bertram R, Goforth PB, Nunemaker CS, Waters CD, et al. Slow oscillations of KATP conductance in mouse pancreatic islets provide support for electrical bursting driven by metabolic oscillations. Am J Physiol. 2013;305: E805–E817. doi: 10.1152/ajpendo.00046.2013 [DOI] [PMC free article] [PubMed] [Google Scholar]
- 33.Gomis A, Valdeolmillos M. Regulation by tolbutamide and diazoxide of the electrical activity in mouse pancreatic β-cells recorded in vivo. Br J Pharmacol. 1998;123: 443–448. doi: 10.1038/sj.bjp.0701628 [DOI] [PMC free article] [PubMed] [Google Scholar]
- 34.Szollosi A, Nenquin M, Aguilar-Bryan L, Bryan J, Henquin J-C. Glucose stimulates Ca2+ influx and insulin secretion in 2-week-old β-cells lacking ATP-sensitive K+ channels. J Biol Chem. 2007;282: 1747–1756. doi: 10.1074/jbc.M609875200 [DOI] [PubMed] [Google Scholar]
- 35.Matsuda H, Saigusa A, Irisawa H. Ohmic conductance through the inwardly rectifying K+ channel and blocking by internal Mg2+. Nature. 1987;325: 156–159. doi: 10.1038/325156a0 [DOI] [PubMed] [Google Scholar]
- 36.Lopatin AN, Makhina EN, Nichols CG. Potassium channel block by cytoplasmic polyamines as the mechanism of intrinsic rectification. Nature. 1994. pp. 366–369. doi: 10.1038/372366a0 [DOI] [PubMed] [Google Scholar]
- 37.Bradley KK, Jaggar JH, Bonev AD, Heppner TJ, Flynn ER, Nelson MT, et al. Kir2.1 encodes the inward rectifier potassium channel in rat arterial smooth muscle cells. J Physiol. 1999;515 Pt 3: 639–651. doi: 10.1111/j.1469-7793.1999.639ab.x [DOI] [PMC free article] [PubMed] [Google Scholar]
- 38.Fakler B, Brändle U, Glowatzki E, Zenner HP, Ruppersberg JP. Kir2.1 inward rectifier K+ channels are regulated independently by protein kinases and ATP hydrolysis. Neuron. 1994;13: 1413–1420. doi: 10.1016/0896-6273(94)90426-X [DOI] [PubMed] [Google Scholar]
- 39.Zhang L, Liu QH, Liu CF, Zhai XW, Feng QL, Xu RL, et al. Zacopride selectively activates the Kir2.1 channel via a PKA signaling pathway in rat cardiomyocytes. Sci China Life Sci. 2013;56: 788–796. doi: 10.1007/s11427-013-4531-z [DOI] [PubMed] [Google Scholar]
- 40.Brugada P, Brugada R, Campuzano O, Sarquella-Brugada G, Brugada P, Brugada V, et al. Brugada syndrome 1992–2012: Twenty years of scientific progress In Cardiac Electrophysiology: From Cell to Bedside. Elsevier-Saunders, Philadelphia, 2014. 925–934. [Google Scholar]
- 41.Ruppersberg JP, Fakler B. Complexity of the regulation of Kir2.1 K+ channels. Neuropharmacology. 1996;35: 887–893. doi: 10.1016/0028-3908(96)00092-5 [DOI] [PubMed] [Google Scholar]
- 42.Tian G, Sandler S, Gylfe E and Tengholm A. Glucose- and hormone-induced cAMP oscillations in α- and β-cells within intact pancreatic islets. Diabetes. 2011. 60(5): 1535–1543 doi: 10.2337/db10-1087 [DOI] [PMC free article] [PubMed] [Google Scholar]
- 43.Dyachok O, Idevall-Hagren O, Sågetorp J, Tian G, Wuttke A, Arrieumerlou C, et al. Glucose-induced cyclic AMP oscillations regulate pulsatile insulin secretion. Cell Metab. 2008;8: 26–37. doi: 10.1016/j.cmet.2008.06.003 [DOI] [PubMed] [Google Scholar]
- 44.Peercy BE, Sherman AS, Bertram R. Modeling of glucose-induced cAMP oscillations in pancreatic β-Cells: cAMP rocks when metabolism rolls. Biophys J. 2015;109: 439–449. doi: 10.1016/j.bpj.2015.06.024 [DOI] [PMC free article] [PubMed] [Google Scholar]
- 45.Glynn E, Thompson B, Vadrevu S, Lu S, Kennedy RT, Ha J, et al. Chronic glucose exposure systematically shifts the oscillatory threshold of mouse islets: Experimental evidence for an early intrinsic mechanism of compensation for hyperglycemia. Endocrinology. 2016;157: 611–623. doi: 10.1210/en.2015-1563 [DOI] [PMC free article] [PubMed] [Google Scholar]
- 46.McKenna JP, Ha J, Merrins MJ, Satin LS, Sherman A, Bertram R. Ca2+ effects on ATP production and consumption have regulatory roles on oscillatory islet activity. Biophys J. 2016;110: 733–742. doi: 10.1016/j.bpj.2015.11.3526 [DOI] [PMC free article] [PubMed] [Google Scholar]
- 47.Blume AJ, Foster CJ. Mouse neuroblastoma adenylate cyclase. Adenosine and adenosine analogues as potent effectors of adenylate cyclase activity. J Biol Chem. 1975;250: 5003–5008. [PubMed] [Google Scholar]
- 48.Londos C, Preston MS. Regulation by glucagon and divalent cations of inhibition of hepatic adenylate cyclase by adenosine. J Biol Chem. 1977;252: 5951–5956. [PubMed] [Google Scholar]
- 49.Johnson RA, Yeung SM, Stübner D, Bushfield M, Shoshani I. Cation and structural requirements for P site-mediated inhibition of adenylate cyclase. Mol Pharmacol. 1989;35: 681–688. [PubMed] [Google Scholar]
- 50.Zhang DY, Lau CP, Li GR. Human Kir2.1 channel carries a transient outward potassium current with inward rectification. Eur J Physiol. 2009;457: 1275–1285. doi: 10.1007/s00424-008-0608-0 [DOI] [PubMed] [Google Scholar]
- 51.Nenquin M, Szollosi A, Aguilar-Bryan L, Bryan J, Henquin J-C. Both triggering and amplifying pathways contribute to fuel-induced insulin secretion in the absence of sulfonylurea receptor-1 in pancreatic β-Cells. J Biol Chem. 2004;279: 32316–32324. doi: 10.1074/jbc.M402076200 [DOI] [PubMed] [Google Scholar]
- 52.Rinzel J, Ermentrout GB. Analysis of neural excitability and oscillations In: Koch C, Segev I, editors. Methods in Neuronal Modeling: From Synapses to Networks. 2nd ed. Cambridge, MA: MIT Press; 1998. pp. 251–292. [Google Scholar]
- 53.Rinzel J, Lee YS. Dissection of a model for neuronal parabolic bursting. J Math Biol. 1987;25: 653–675. doi: 10.1007/BF00275501 [DOI] [PubMed] [Google Scholar]
- 54.Bertram R, Butte MJ, Kiemel T, Sherman A. Topological and phenomenological classification of bursting oscillations. Bull Math Biol. 1995;57: 413–439. doi: 10.1007/BF02460633 [DOI] [PubMed] [Google Scholar]
- 55.Inesi G, Sagara Y. Thapsigargin, a high affinity and global inhibitor of intracellular Ca2+ transport ATPases. Arch Biochem Biophys. 1992;298: 313–317. doi: 10.1016/0003-9861(92)90416-T [DOI] [PubMed] [Google Scholar]
- 56.Arredouani A, Guiot Y, Jonas JC, Liu LH, Nenquin M, Pertusa JA, et al. SERCA3 ablation does not impair insulin secretion but suggests distinct roles of different sarcoendoplasmic reticulum Ca2+ pumps for Ca2+ homeostasis in pancreatic β-cells. Diabetes. 2002;51: 3245–3253. [DOI] [PubMed] [Google Scholar]
- 57.Arredouani A, Henquin JC, Gilon P. Contribution of the endoplasmic reticulum to the glucose-induced Ca2+ response in mouse pancreatic islets. Am J Physiol. 2002;282: E982–E991. doi: 10.1152/ajpendo.00347.2001 [DOI] [PubMed] [Google Scholar]
- 58.Dula SB, Jecmenica M, Wu R, Jahanshahi P, Verrilli GM, Carter JD, et al. Evidence that low-grade systemic inflammation can induce islet dysfunction as measured by impaired calcium handling. Cell Calcium. 2010;48: 133–142. doi: 10.1016/j.ceca.2010.07.007 [DOI] [PMC free article] [PubMed] [Google Scholar]
- 59.Merrins MJ, Poudel C, McKenna JP, Ha J, Sherman A, Bertram R, et al. Phase analysis of metabolic oscillations and membrane potential in pancreatic islet β-cells. Biophys J. 2016;110: 691–699. doi: 10.1016/j.bpj.2015.12.029 [DOI] [PMC free article] [PubMed] [Google Scholar]
- 60.Kennedy RT, Kauri LM, Dahlgren GM, Jung SK. Metabolic oscillations in β-cells. Diabetes. 2002;51:152–161. doi: 10.2337/diabetes.51.2007.S152 [DOI] [PubMed] [Google Scholar]
- 61.Luciani DS, Misler S, Polonsky KS. Ca2+ controls slow NAD(P)H oscillations in glucose-stimulated mouse pancreatic islets. J Physiol. 2006;572: 379–392. doi: 10.1113/jphysiol.2005.101766 [DOI] [PMC free article] [PubMed] [Google Scholar]
- 62.Merrins MJ, Fendler B, Zhang M, Sherman A, Bertram R, Satin LS. Metabolic oscillations in pancreatic islets depend on the intracellular Ca2+ level but not Ca2+ oscillations. Biophys J.; 2010;99: 76–84. doi: 10.1016/j.bpj.2010.04.012 [DOI] [PMC free article] [PubMed] [Google Scholar]
- 63.LeMasson G, Marder E, Abbott LF. Activity-dependent regulation of conductances in model neurons. Science. 1993;259: 1915–1917. doi: 10.1126/science.8456317 [DOI] [PubMed] [Google Scholar]
- 64.Rosati B, McKinnon D. Regulation of ion channel expression. Circ Res. 2004;94: 874–883. doi: 10.1161/01.RES.0000124921.81025.1F [DOI] [PubMed] [Google Scholar]
- 65.O’Leary T, Williams AH, Franci A, Marder E. Cell types, network homeostasis, and pathological compensation from a biologically plausible ion channel expression model. Neuron. Elsevier Inc.; 2014;82: 809–821. doi: 10.1016/j.neuron.2014.04.002 [DOI] [PMC free article] [PubMed] [Google Scholar]
- 66.Barish ME. Intracellular calcium regulation of channel and receptor expression in the plasmalemma: Potential sites of sensitivity along the pathways linking transcription, translation, and insertion. J Neurobiol. 1998;37: 146–157. doi: 10.1002/(SICI)1097-4695(199810)37 [PubMed] [Google Scholar]
- 67.West AE, Chen WG, Dalva MB, Dolmetsch RE, Kornhauser JM, Shaywitz AJ, et al. Calcium regulation of neuronal gene expression. Proc Natl Acad Sci. 2001;98: 11024–31. doi: 10.1073/pnas.191352298 [DOI] [PMC free article] [PubMed] [Google Scholar]
- 68.Pinton P, Giorgi C, Siviero R, Zecchini E, Rizzuto R. Calcium and apoptosis: ER-mitochondria Ca2+ transfer in the control of apoptosis. Oncogene. 2008;27: 6407–18. doi: 10.1038/onc.2008.308 [DOI] [PMC free article] [PubMed] [Google Scholar]
- 69.Ni Q, Ganesan A, Aye-Han N- N, Gao X, Allen MD, Levchenko A, et al. Signaling diversity of PKA achieved via a Ca2+-cAMP-PKA oscillatory circuit. Nat Chem Biol. 2011;7: 34–40. doi: 10.1038/nchembio.478 [DOI] [PMC free article] [PubMed] [Google Scholar]
- 70.Leiser M, Fleischer N. cAMP-dependent phosphorylation of the cardiac-type α1 subunit of the voltage-dependent Ca2+ channel in a murine pancreatic β-cell line. Diabetes. 1996;45: 1412–8. [DOI] [PubMed] [Google Scholar]
- 71.Richard P. The rhythm of yeast. FEMS Microbiol Rev. 2003;27: 547–557. doi: 10.1016/S0168-6445(03)00065-2 [DOI] [PubMed] [Google Scholar]
- 72.Merrins MJ, Van Dyke AR, Mapp AK, Rizzo MA, Satin LS. Direct measurements of oscillatory glycolysis in pancreatic islet β-cells using novel fluorescence resonance energy transfer (FRET) biosensors for pyruvate kinase M2 activity. J Biol Chem. 2013;288: 33312–33322. doi: 10.1074/jbc.M113.508127 [DOI] [PMC free article] [PubMed] [Google Scholar]
Associated Data
This section collects any data citations, data availability statements, or supplementary materials included in this article.
Supplementary Materials
Equations and parameter values for the model.
(DOCX)
(TXT)
(TXT)
(PXP)
(TXT)
(TXT)
(TXT)
(TXT)
Data Availability Statement
All data are available as supporting data for this manuscript. Computer codes are available for free download at www.math.fsu.edu/~bertram/software/islet.


