

Abstract
Purpose
To investigate prospectively the associations of Dietary Inflammatory Index (DII) and Mediterranean Diet Score (MDS) with lung cancer.
Methods
We used data from men and women aged 40–69 years at recruitment in 1990–1994, who were participants in the Melbourne Collaborative Cohort Study (n = 35,303). A total of 403 incident lung cancer cases were identified over an average 18-year follow-up. Hazard ratios (HR) were estimated using Cox regression, adjusting for smoking status and other risk factors, with age as the time metric.
Results
An inverse correlation was observed between the DII and MDS (ρ = −0.45), consistent with a higher DII being pro-inflammatory and less ‘healthy,’ while a high MDS reflects a ‘healthier’ diet. The DII was positively associated with risk of lung cancer in current smokers [HRQ4 vs Q1 = 1.70 (1.02, 2.82); Ptrend = 0.008] (p interaction between DII quartiles and smoking status = 0.03). The MDS was inversely associated with lung cancer risk overall [HR7–9 vs 0–3 = 0.64 (0.45, 0.90); Ptrend = 0.005] and for current smokers (HR7–9 vs 0–3 = 0.38 (0.19, 0.75); Ptrend = 0.005) (p interaction between MDS categories and smoking status = 0.31).
Conclusions
The MDS showed an inverse association with lung cancer risk, especially for current smokers. A high DII, indicating a more pro-inflammatory diet, was associated with risk of lung cancer only for current smokers. A healthy diet may reduce the risk of lung cancer, especially in smokers.
Keywords: Diet, Inflammation, Lung cancer, Prospective, Epidemiology, Smoking
Introduction
Lung cancer is the most commonly diagnosed cancer and most common cause of cancer death for men. For females, it ranks fourth in terms of incidence and is the leading cause of cancer death in developed countries [1].
Cigarette smoke has strong pro-inflammatory properties which may contribute to the etiology of lung cancer [2, 3]. There have been several reports indicating prospective associations between biomarkers of inflammation and lung cancer risk [4–6]. Within the screening arm of the Prostate, Lung, Colorectal and Ovarian cancer Screening Trial (PLCO), results from a nested case–control study indicated that elevated serum high sensitivity C-reactive protein (hs-CRP) was associated with increased risk of incident lung cancer [4]. Higher serum concentrations of interleukin-6 (IL-6) and interleukin-8 (IL-8) were associated with lung cancer prevalence and incidence in case–control studies using the National Cancer Institute-Maryland (NCI-MD) data and in the PLCO data [5]. In the PLCO data, IL-8 and CRP were both predictors of lung cancer, with highest risk when both were elevated [5]. A more recent analysis from PLCO assessed a panel of 77 inflammatory serum biomarkers [6]. Of 68 biomarkers that could be evaluated, 11 were associated with lung cancer risk, including acute-phase proteins, pro-inflammatory cytokines, anti-inflammatory cytokines (inverse association), lymphoid differentiation cytokines, growth factors, and chemokines.
A literature-derived dietary inflammatory index (DII) [7] was developed to assess the inflammatory potential of an individual’s diet based on reported associations of various foods, nutrients and other compounds with six inflammatory markers, and has subsequently been refined [8]. The new, refined DII was positively associated with hs-CRP levels in the longitudinal observational SEASONS Study [9]. Higher DII scores are indicative of a pro-inflammatory diet. In cross-sectional analyses in two Dutch cohorts, an adaptation of the original DII (ADII) was associated with a score based on 6 biomarkers of inflammation, and with insulin resistance assessed by HOMA [10]. Other studies have shown the new, refined DII to be associated with colorectal [11–13], prostate [14] and pancreatic [15] cancers, other biomarkers of inflammation [16, 17], [18] and total, cardiovascular or cancer mortality [19].
Although the DII has been designed specifically on the basis of associations between dietary factors and circulating biomarkers of inflammation, lower DII scores were seen with a plant-based dietary intervention [20] which is likely to be beneficial to health through mechanisms in addition to inflammation. The Mediterranean diet interventions used in the PREDIMED study also were associated with reduced inflammation [21]. The DII and an adaptation of the Mediterranean Diet Score (aMED) were evaluated for associations with respiratory conditions in a high-risk cohort participating in a lung cancer screening trial [22]. For these heavy smokers, only the aMED, reflecting a diet focussing on plant foods, was associated with lung cancer risk after adjusting for other risk factors, although the DII and aMED scores were moderately inversely correlated (r = −0.51).
Our aim was to investigate whether the refined DII was associated with incident lung cancer in the Melbourne Collaborative Cohort Study (MCCS) after around 18 years of follow-up. As a comparison and to investigate how specific any association might be to the DII as a marker of diet quality, we also investigated associations with the Mediterranean Diet Score (MDS).
Materials and methods
Study population
The MCCS is a prospective cohort study of 41,514 residents (17,045 men) of Melbourne, Australia aged between 27 and 75 years at baseline (99.3 % were ages 40–69 years [23]). Italian and Greek migrants were deliberately recruited to extend the range of lifestyle exposures. Recruitment occurred between 1990 and 1994. Participants were recruited via the electoral rolls (registration to vote is compulsory for adults in Australia), advertisements, and community announcements in local media (e.g., television, radio, and newspapers). Comprehensive lists of Italian and Greek surnames also were used to target southern European migrants in the phone book and Electoral Rolls. The Cancer Council Victoria’s Human Research Ethics Committee approved the study protocol. Participants gave written consent to participate and for the investigators to obtain access to their medical records. We excluded 6211 participants who had any cancer, diabetes, a heart attack, or angina before baseline; had no dietary data; had missing values for any of the confounders; or their reported energy intake was in the lowest or highest 1 % of the sex-specific distributions. Participants with diabetes, heart attacks, or angina were excluded because their reported diets were not representative of the cohort (e.g., they had low intakes of saturated fat) and we were unsure when they changed their diets. After these exclusions 35,303 participants remained for analysis.
Dietary assessment
At baseline, participants completed a 121-item food frequency questionnaire (FFQ) that was developed from a study of weighed food records in 810 Melbournians of similar demographics to the cohort [24]. Nutrient intakes were calculated using mean sex-specific portion sizes from the weighed food records [24]. Intakes of most nutrients were computed using Australian food composition tables [25]. Because these tables do not include folate and vitamin E, we used British data for these [26]. Fatty acid data were sourced from Royal Melbourne Institute of Technology [27] and carotenoid data from the United States Department of Agriculture (USDA) [28].
Dietary inflammatory index (DII)
Briefly, to calculate DII for the subjects in this study, the dietary data were first linked to a world database that provided a robust estimate of a mean and standard deviation for each food parameter included in the DII. These parameters then became the multipliers to express an individual’s exposure relative to the ‘standard global mean’ as a z-score. This was achieved by subtracting the ‘standard global mean’ from the amount reported and dividing this value by the standard deviation. To minimize the effect of ‘right skewing,’ this value was then converted to a centered percentile score. The centered percentile score for each food parameter for each subject was then multiplied by the corresponding food parameter effect score in order to obtain a food parameter-specific DII score. All of the food parameter-specific DII scores were then summed to create the overall DII score for each study subjects (Fig. 1). DII scores for individuals in the MCCS were calculated using the 29 foods and nutrients (out of the 45 possible items) [8] for which we had intake data available from the FFQ: energy, carbohydrate, protein, fat, alcohol, fiber, cholesterol, saturated fatty acid, mono-unsaturated fatty acid, poly-unsaturated fatty acid, omega 3 fat, omega 6 fat, trans fat, niacin, thiamin, riboflavin, vitamin B12, vitamin B6, iron, magnesium, zinc, vitamin A, vitamin C, vitamin E, folic acid, beta carotene, garlic, onion, and tea.
Fig. 1.
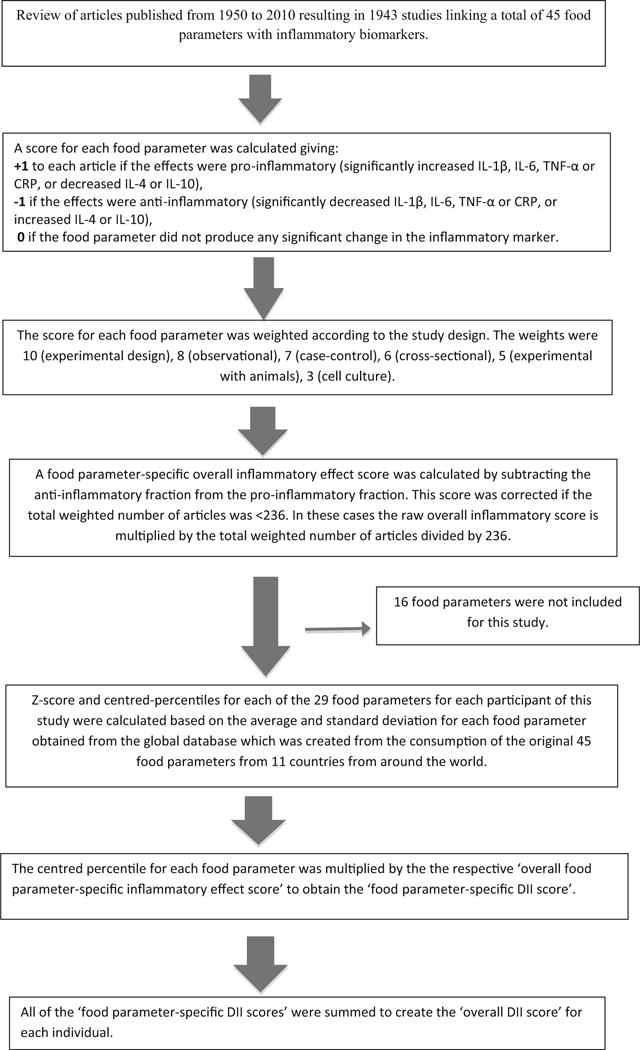
Sequence of steps in creating the dietary inflammatory index in the Melbourne Collaborative Cohort Study
Mediterranean diet score (MDS)
Trichopoulou et al. [29] developed the Mediterranean Diet Score (MDS) to quantify adherence to a traditional Mediterranean diet. We computed the MDS using the whole baseline MCCS sample. Intakes above the sex-specific medians for frequency of intake for vegetables, fruit, cereals, legumes, and fish, participants were assigned a value of 1 and below the median were assigned a value of 0. Intakes below the median for dairy and red meat (not chicken), participants were assigned a value of 1 and above the median were assigned a value of 0. For alcohol, a value of 1 was assigned for daily intakes between 10 and 50 g/d for men and 5–25 g/d for women, lower or higher intakes scored zero [29]. Trichopoulou et al. used the ratio of dietary mono-unsaturated/saturated fats as the ninth component of the Mediterranean Diet Score [29]; but we have used the intake of olive oil instead. In Australia, red meat is an important source of monounsaturated fatty acids [30], and as shown by Martínez-González et al., olive oil was more closely associated with the MDS than was monounsaturated fat in their Spanish participants [31].
Assessment of other risk factors
A structured interview schedule was used to obtain information on potential risk factors at baseline, including age, sex, country of birth, alcohol consumption using beverage-specific quantity frequency questions, current physical activity leisure time over the last 6 months (scored according to frequency of walking plus frequency of less vigorous activity plus twice the frequency of vigorous activity [32]), education, socioeconomic status by Socio-Economic Indexes for Areas (SEIFA) Index of Relative Socio-Economic Disadvantage [33], use of anti-inflammatory medication (including aspirin and nonsteroidal; prescription and over the counter), smoking status and detailed smoking history including the average number of cigarettes smoked per day and age at which they started smoking. Former smokers also provided the age at which they quit. Height and weight were measured and body mass index was calculated based on measured weight and height [BMI = weight(kg)/height(m)2].
Cohort follow-up and case ascertainment
Cases were identified from notifications to the Victorian Cancer Registry of diagnoses of lung cancer (codes C33 and C34 of the International Classification of Diseases, ICD-O-2). Additional cases diagnosed outside Victoria were identified by linkage to the Australian Cancer Database. Only participants with a primary diagnosis of lung cancer, which was classified as invasive (n = 314) or metastatic (n = 89) were counted as cases (i.e., cancer in situ was not included). Current addresses and vital status were determined by record linkage to Electoral Rolls and Victorian death records, from electronic phone books and from responses to mailed questionnaires and newsletters.
Statistical analysis
DII quartile cut points (Q) were obtained from the entire eligible sample; the lowest quartile (Q1) being the referent category. In order to understand what sort of eating pattern was associated with having a high DII, intakes of the food groups that constitute the MDS were summarized by DII quartiles. We also included white bread, a component of the cereal group due to its strong relationship with dietary glycaemic index (GI) in the MCCS [34] and evidence of an association between GI or glycemic load (GL) with CRP [35]. Most of these items were expressed as weekly frequencies except for olive oil (milliliters/week), energy (kJ/day), and alcohol, protein, fat, and carbohydrate (grams/day). Given that the DII is strongly inversely correlated with energy intake, the intakes of the foods/groups were reported as energy-adjusted values using the Willett regression method [36], with natural log-transformed data, which was back-transformed for presentation.
Cox’s proportional hazard models were fitted, with age as the time metric [37], to estimate hazards ratios and 95 % confidence intervals (95 % CI). Calculation of person-time began at baseline and ended at the earliest of: the date of diagnosis of lung cancer, dates of diagnosis of cancer at any other site, date of diagnosis of cancer of unknown primary site, date of death, date last known to be in Australia, or 31 December 2011 (the date that ascertainment of lung cancer diagnoses by the Victorian Cancer Registry was complete).
For a random subsample of 1428 people from the MCCS selected for measurement of hs-CRP, we assessed the Spearman correlations between the DII and CRP and between the MDS and CRP in 1253 people. We also assessed the correlation between DII and the MDS in the whole study sample.
Potential confounders that required adjustment were identified from a Directed Acyclic Graph (DAG) [38]. All models were adjusted for smoking status (never, former, current), pack-years (calculated as the average number of cigarettes smoked per day multiplied by the duration of smoking in years, divided by 20: never smokers, >0–<10, 10–<20, 20–<30 or C30 pack-years), and time since cessation of smoking (never smoker, current smoker, >0–<5, 5–<10 or ≥10 years); country of birth (Australia/New Zealand, UK, Greece, Italy); education (≤primary school, some high/technical school, completed high/technical school, degree/diploma); body mass index (<25, 25–<30, ≥30 kg/m2); physical activity score [0 (None), >0–<4 (Low), 4–<6 (Moderate), ≥6 (High)], sex, SEIFA quintile, and total daily energy intake (kJ/d). Models including the DII were also adjusted for alcohol consumption (lifetime abstainers, ex-drinkers, low [1–39, 1–19 g/d (men, women, respectively), moderate (40–59, 20–39 g/d), high intake (≥60, ≥40 g/d)]. Models for MDS did not include alcohol as this is a component of the score.
Interactions between smoking status and diet score also were fitted and tested. Smoking-specific results from these models are presented together with results for all participants. To estimate linear trends on a log hazard scale the DII and MDS were fitted as pseudocontinuous covariates (using the median value within each DII quartile or MDS category). To investigate departures from linearity in the relationship between the diet scores and overall lung cancer risk, the likelihood ratio test was used to compare the results from models using linear and categorical representations of the dietary indices [39]. To generate the smoking-specific results a two-way interaction between smoking status and a quadratic pseudocontinuous term for the DII or MDS was included in the model and the significance of this term was assessed (Wald test) to investigate a departure from linearity. Additional analyses involved fitting and testing (using the likelihood ratio test) two-way interaction terms between smoking status and each confounder in the model.
We performed a sensitivity analysis restricted to participants who were not using anti-inflammatory drugs at baseline; too few people were using anti-inflammatory medication to assess associations in users. Other sensitivity analyses were performed excluding the first 2 years of follow-up to eliminate the possibility that the observed relationships were distorted by preexisting disease. Tests based on Schoenfeld residuals showed no evidence of violation of the proportional hazards assumption. All statistical tests were two sided, with p < 0.05 considered statistically significant. Statistical analyses were performed using Stata/MP 14.1® (Stata Corporation, College Station, TX).
Results
Of the eligible participants, 96 (0.3 %) had left Australia and 4735 (13.4 %) had died by 31 December 2011). We identified 403 incident cases of lung cancer (245 men and 158 women), over an average of 17.8 years of follow-up (range 0.02–21.1 years) between 1990 and 2011. Of these, 43 % were adenocarcinomas, 17 % squamous cell carcinomas, 11 % small cell carcinomas, 6 % large cell carcinomas, and the remaining 22 % were unclassified or other types. The mean age at diagnosis was 70 years (range, 42–87 years).
The baseline characteristics of the study participants are presented in Table 1. In comparison with non-cases, cases were more likely to be male, older, in the top 25 % of DII, in the lowest MDS category, high alcohol consumers, and current or former smokers. Cases also tended to be heavier smokers, and if they were former smokers had quit more recently. Participants with degrees or diplomas, who resided in a higher SES area, and who were more physically active, were less likely to develop lung cancer. Of the 403 incident lung cancer cases identified, only 63 had reported never having smoked.
Table 1.
Baseline characteristics in the Melbourne Collaborative Cohort Study, 1990–1994
| N | Non-cases N (%) |
Cases N (%) |
||
|---|---|---|---|---|
| 34900 | 403 | |||
| Age group | ||||
| <50 years | 12,072 | (34.6) | 42 | (10.4) |
| 50–59 years | 11,553 | (33.1) | 135 | (33.5) |
| ≥60 years | 11,275 | (32.3) | 226 | (56.1) |
| Country of birth | ||||
| Australia/New Zealand | 24,240 | (69.5) | 249 | (61.8) |
| UK | 2,576 | (7.4) | 38 | (9.4) |
| Italy | 4,402 | (12.6) | 72 | (17.9) |
| Greece | 3,682 | (10.6) | 44 | (10.9) |
| Education | ||||
| ≤Primary school | 6,394 | (18.3) | 97 | (24.1) |
| Some high/technical school | 13,255 | (38.0) | 174 | (43.2) |
| Completed high/technical school | 7,226 | (20.7) | 84 | (20.8) |
| Degree/diploma | 8,025 | (23.0) | 48 | (11.9) |
| SEIFAa quintiles | ||||
| Q1 (most disadvantaged) | 4,889 | (14.0) | 75 | (18.6) |
| Q2 | 7,110 | (20.4) | 95 | (23.6) |
| Q3 | 6,428 | (18.4) | 76 | (18.9) |
| Q4 | 7,249 | (20.8) | 77 | (19.1) |
| Q5 (least disadvantaged) | 9,224 | (26.4) | 80 | (19.9) |
| DIIb quartiles | ||||
| Q1 (anti-inflammatory) | 8,740 | (25.0) | 85 | (21.1) |
| Q2 | 8,745 | (25.1) | 81 | (20.1) |
| Q3 | 8,736 | (25.0) | 91 | (22.6) |
| Q4 (pro-inflammatory) | 8,679 | (24.9) | 146 | (36.2) |
| MDSc categories | ||||
| 0–3 | 7,507 | (21.5) | 126 | (31.3) |
| 4–6 | 22,013 | (63.1) | 229 | (56.8) |
| 7–9 | 5,380 | (15.4) | 48 | (11.9) |
| Alcohol intake | ||||
| Lifetime abstainers | 9,832 | (28.2) | 68 | (16.9) |
| Ex-drinkers | 1,239 | (3.6) | 21 | (5.2) |
| Low intake | 19,241 | (55.1) | 218 | (54.1) |
| Medium intake | 3,084 | (8.8) | 56 | (13.9) |
| High intake | 1,504 | (4.3) | 40 | (9.9) |
| Physical activityd | ||||
| 0 (none) | 7,699 | (22.1) | 98 | (24.3) |
| >0 to < 4 (low) | 7,041 | (20.2) | 100 | (24.8) |
| ≥4 to < 6 (moderate) | 12,141 | (34.8) | 139 | (34.5) |
| ≥6 (high) | 8,019 | (23.0) | 66 | (16.4) |
| BMI category | ||||
| <25 kg/m2 | 13,058 | (37.4) | 155 | (38.5) |
| 25–<30 kg/m2 | 14,992 | (43.0) | 177 | (43.9) |
| ≥30 kg/m2 | 6,850 | (19.6) | 71 | (17.6) |
| Smoking status | ||||
| Never | 20,810 | (59.6) | 63 | (15.6) |
| Current | 3769 | (10.8) | 175 | (43.4) |
| Former | 10,321 | (29.6) | 165 | (40.9) |
| Pack-years (current and former smokers) | ||||
| >0 to <10 pack-years | 4,647 | (33.0) | 26 | (7.6) |
| 10 to <20 pack-years | 2,927 | (20.8) | 28 | (8.2) |
| 20 to <30 pack-years | 2,107 | (15.0) | 50 | (14.7) |
| ≥30 pack-years | 4,409 | (31.3) | 236 | (69.4) |
| Years since quitting smoking (former | smokers) | |||
| <5 years | 1,786 | (17.3) | 55 | (33.3) |
| 5 to <10 years | 1,825 | (17.7) | 33 | (20.0) |
| ≥10 years | 6,710 | (65.0) | 77 | (46.7) |
| Sex | ||||
| Male | 13,821 | (39.6) | 245 | (60.8) |
| Female | 21,079 | (60.4) | 158 | (39.2) |
| Anti-inflammatory medication use | ||||
| No | 27,396 | (78.5) | 316 | (78.4) |
| Yes | 7,504 | (21.5) | 87 | (21.6) |
Socio-Economic Indexes for Areas Index of Relative Socio-Economic Disadvantage
Dietary Inflammatory Index
Mediterranean Diet Score
Ordinal score based on frequency of walking plus frequency of less vigorous activity plus twice the frequency of vigorous activity, and ranging from 0 to 16
Table 2 shows energy-adjusted intakes of food groups and nutrients by DII quartiles. Intakes of white bread, red meat, fat, and dietary glycaemic index tended to be higher in the higher, more inflammatory quartiles of DII while intakes of cereal foods in general, wholemeal bread, fish, vegetables, legumes, fruit, protein, and carbohydrates were higher in the lower, anti-inflammatory quartiles of DII. Energy intake also showed an inverse association with DII. A moderate inverse correlation was observed between the DII and MDS (Spearman’s rho = −0.45). The median MDS was 6 (IQR, 5–7) in the lowest DII quartile and 4 (IQR, 3–5) in the highest DII quartile.
Table 2.
Median (IQR) energy-adjusted intakes of major food groups and macronutrients by quartiles of dietary inflammatory index, Melbourne Collaborative Cohort Study, 1990–1994
| Dietary inflammatory index quartile and range
|
||||||||
|---|---|---|---|---|---|---|---|---|
| Q1 | Q2 | Q3 | Q4 | |||||
| −4.91, −2.15
|
−2.15, −0.99
|
−0.99, 0.39
|
0.39, 4.86
|
|||||
| Median | (IQR) | Median | (IQR) | Median | (IQR) | Median | (IQR) | |
| Mediterranean diet score | 6 | (5, 7) | 5 | (4, 6) | 5 | (4, 6) | 4 | (3, 5) |
| Olive oil (mls/week) | 34.3 | (0, 63.4) | 33.7 | (0, 97.3) | 33.3 | (0, 98.4) | 33.2 | (0, 100.2) |
| Cereal products (times/week) | 32.2 | (24.5, 41.1) | 31 | (23.8, 40.1) | 30.7 | (23.3, 39.7) | 29.8 | (22.1, 39.0) |
| White bread (times/week) | 0.8 | (0.0, 5.5) | 2 | (0.0, 6.7) | 3.3 | (0.3, 8.1) | 4.8 | (0.7, 10.1) |
| Wholemeal bread (times/week) | 6.4 | (2.6, 15.1) | 5.7 | (0.9, 9.9) | 3.6 | (0.4, 8.1) | 1.1 | (0.0, 7.0) |
| Dairy products (times/week) | 36 | (23.1, 48.0) | 34.2 | (20.8, 47.7) | 32.5 | (18.9, 48.0) | 30.3 | (15.4, 47.9) |
| Red meat (times/week) | 6.7 | (4.7, 9.2) | 7.3 | (5.2, 9.8) | 7.7 | (5.6, 10.2) | 8.2 | (5.9, 10.9) |
| Fish (times/week) | 1.6 | (1.0, 2.9) | 1.5 | (1.0, 2.3) | 1.4 | (1.0, 2.1) | 1.3 | (0.7, 2.0) |
| Vegetables (times/week) | 6.5 | (4.8, 8.6) | 5.6 | (4.1, 7.3) | 4.6 | (3.2, 6.2) | 3.5 | (2.3, 5.0) |
| Legumes (times/week) | 3.8 | (2.6, 6.1) | 3.4 | (2.1, 5.3) | 3.1 | (1.6, 4.5) | 2.4 | (1.3, 3.8) |
| Fruit (times/week) | 4.5 | (3.0, 6.4) | 4.1 | (2.7, 6.0) | 3.5 | (2.2, 5.2) | 2.5 | (1.3, 3.9) |
| Alcohol (grams/day) | 4.3 | (0.0, 16.3) | 4.7 | (0.0, 17.5) | 4.6 | (0.0, 18.7) | 4.2 | (0.0, 20.8) |
| Glycemic index or whole diet | 47.9 | (45.6, 50.5) | 48.5 | (46.1, 51.3) | 49.3 | (46.6, 52.3) | 50.2 | (47.3, 53.8) |
| Protein (grams/day) | 100.1 | (92.3, 109.3) | 98.6 | (90.5, 107.8) | 97 | (88.5, 106.6) | 95.8 | (86.2, 106.0) |
| Fat (grams/day) | 79.4 | (70.3, 88.9) | 80.2 | (71.2, 88.8) | 82.3 | (73.5, 91.2) | 87 | (77.1, 96.6) |
| Carbohydrate (grams/day) | 255 | (230, 279) | 253 | (229, 278) | 248 | (223, 274) | 235 | (208, 262) |
| Energy from food and alcohol (kJ/day) | 11,484 | (9592, 13,837) | 9389 | (7987, 11,139) | 8162 | (6896, 9665) | 6436 | (5338, 7791) |
Table 3 shows the HRs for lung cancer in relation to the DII, overall and by smoking status. For all participants, those in the most inflammatory DII category (Q4) had a nonsignificant elevated risk of lung cancer (HRQ4 vs Q1 = 1.31 (0.91, 1.89); Ptrend = 0.06). There was a significant interaction between smoking status and DII (p = 0.03, DII categorical model). No association was observed between DII and lung cancer for never or former smokers. For current smokers a positive association was observed (HRQ4 vs Q1 = 1.70 (1.02, 2.82); Ptrend = 0.008), although there was evidence of departure from linearity (p = 0.01) suggesting that the observed positive linear trend was driven by the elevated risk for Q4.
Table 3.
HRs (95 % CI) of lung cancer by DII, Melbourne Collaborative Cohort Study, 1990–1994
| DII | Overalla (n = 35,303)
|
Neverb (n = 20,873)
|
Currentb (n = 3944)
|
Formerb (n = 10,486)
|
||||||||
|---|---|---|---|---|---|---|---|---|---|---|---|---|
| Cases | HR | (95 % CI) | Cases | HR | (95 % CI) | Cases | HR | (95 % CI) | Cases | HR | (95 % CI) | |
| Q1 [Reference] | 85 | 1.00 | 13 | 1.00 | 26 | 1.00 | 46 | 1.00 | ||||
| Q2 | 81 | 0.94 | (0.68, 1.29) | 22 | 1.73 | (0.87, 3.47) | 29 | 1.05 | (0.61, 1.81) | 30 | 0.65 | (0.41, 1.05) |
| Q3 | 91 | 0.96 | (0.68, 1.34) | 17 | 1.41 | (0.67, 2.97) | 33 | 0.93 | (0.54, 1.59) | 41 | 0.88 | (0.56, 1.39) |
| Q4 | 146 | 1.31 | (0.91, 1.89) | 11 | 0.90 | (0.38, 2.13) | 87 | 1.70 | (1.02, 2.82) | 48 | 1.09 | (0.68, 1.75) |
| Linear model | 403 | 1.08 | (1.00, 1.18) | 63 | 0.96 | (0.81, 1.15) | 175 | 1.16 | (1.04, 1.30) | 165 | 1.05 | (0.94, 1.18) |
| P-trend | 0.06 | 0.66 | 0.008 | 0.39 | ||||||||
| P-linearityc | 0.22 | 0.07 | 0.01 | 0.01 | ||||||||
Adjusted for pack-years, years since quit smoking, smoking status, country of birth, education, BMI, alcohol intake, physical activity, sex, SEIFA quintile, energy (includes an interaction between smoking status and country of birth)
Adjusted for pack-years, years since quit smoking, smoking status, country of birth, education, BMI, alcohol intake, physical activity, sex, SEIFA quintile, energy (includes an interaction between smoking status and DII and smoking status and country of birth)
The results for the MDS were consistent with those for the DII, with a higher score (more healthy diet), associated with a lower risk of lung cancer [Table 4, HR7–9 vs 0–3 = 0.64 (0.45, 0.90); Ptrend = 0.005] overall. While we did not observe a significant interaction between smoking status and MDS (p = 0.31, MDS categorical model), it was only for current smokers that a significant inverse association with MDS was observed [HR7–9 vs 0–3 = 0.38 (0.19, 0.75); Ptrend = 0.005]. There was no evidence of a departure from linearity in any of the MDS models.
Table 4.
HRs (95 % CI) of lung cancer by MDS, Melbourne Collaborative Cohort Study, 1990–1994
| MDS | Overalla (n = 35,303)
|
Neverb (n = 20,873)
|
Currentb (n = 3944)
|
Formerb (n = 10,486)
|
||||||||
|---|---|---|---|---|---|---|---|---|---|---|---|---|
| Cases | HR | (95 % CI) | Cases | HR | (95 % CI) | Cases | HR | (95 % CI) | Cases | HR | (95 % CI) | |
| 0–3 [Reference] | 126 | 1.00 | 17 | 1.00 | 67 | 1.00 | 42 | 1.00 | ||||
| 4–6 | 229 | 0.75 | (0.60, 0.94) | 37 | 0.66 | (0.37, 1.18) | 98 | 0.78 | (0.56, 1.08) | 94 | 0.76 | (0.53, 1.11) |
| 7–9 | 48 | 0.64 | (0.45, 0.90) | 9 | 0.70 | (0.31, 1.58) | 10 | 0.38 | (0.19, 0.75) | 29 | 0.81 | (0.50, 1.32) |
| Linear model | 403 | 0.89 | (0.81, 0.96) | 63 | 0.89 | (0.72, 1.10) | 175 | 0.83 | (0.73, 0.95) | 165 | 0.94 | (0.83, 1.07) |
| P-trend | 0.005 | 0.30 | 0.005 | 0.34 | ||||||||
| P-linearityc | 0.58 | 0.38 | 0.16 | 0.83 | ||||||||
Adjusted for pack-years, years since quit smoking, smoking status, country of birth, education, BMI, physical activity, sex, SEIFA quintile, energy (includes an interaction between smoking status and country of birth)
Adjusted for pack-years, years since quit smoking, smoking status, country of birth, education, BMI, physical activity, sex, SEIFA quintile, energy (includes interactions between smoking status and MDS and smoking status and country of birth)
Associations between lung cancer risk and the DII were little changed by the exclusion of the first 2 years of follow-up (n = 151, including 26 cases) or people using anti-inflammatory medication. There were too few people using anti-inflammatory drugs (n = 7591, including 87 cases) to examine associations within this subgroup. Similarly for the MDS, results were similar after these exclusions (data not shown).
For a random subsample of 1428 people selected for measurement of hs-CRP, the correlation between the DII and CRP was very weak but statistically significant, Spearman’s rho = 0.11, p < 0.001. The association for the MDS and CRP in 1253 people was of similar strength, but in the opposite direction (Spearman’s rho = −0.10, p < 0.001).
Discussion
We have shown that the MDS was inversely associated with lung cancer risk. The association was strongest for people who were current smokers at baseline, although the interaction between the dietary measure and smoking status was not significant. A pro-inflammatory diet, as indicated by a higher DII score, was associated with an elevated risk of lung cancer only in participants who smoked at baseline, although there was a suggestion of an overall trend among all study subjects.
Strengths of this study include minimal loss to follow-up, the measurement and resulting analytic control of important potential confounders and the objective assessment of the outcome, incident lung cancer. The main weaknesses relate to the dietary assessment based on a single FFQ, which is known to suffer from measurement error and which assessed only 29 of the 45 items that potentially contribute to the DII. It is also possible that diet changed over follow-up. Despite adjusting for several measures of smoking status at baseline, residual confounding by smoking is a possibility given the strong effect of smoking on both inflammation and the risk of lung cancer. The number of cases was small in some of our subgroups, particularly for never smokers; thus some associations may not have been detected because of low statistical power. We did not have a sample size sufficient to analyze different cancer subtypes separately. There were only 44 cases of small cell lung cancer which are considered distinct from other types due to their aggressiveness, diffuse nature, metastatic potential and poor prognosis [40] and which have been observed to have different relationships with some diet-related supplements [41].
While there have been several studies assessing the association of the DII and various health outcomes, there is only one other study of lung cancer; conducted in Italy as part of the Continuous Observation of Smoking Subjects (COSMOS) [22]. COSMOS cohort members were all heavy smokers screened annually using CT scanning. Univariate analysis found DII (positive) and adherence to a Mediterranean diet assessed by aMED (negative) to be associated with incident lung cancer. After adjustment for age, sex, smoking duration, smoking intensity, years of smoking cessation and asbestos exposure, only the association with aMED remained, and the HR was only slightly changed by further adjustment for DII. The DII and aMED were moderately inversely correlated and likely shared common associations with food groups such as fruit and vegetables, fish, and olive oil [22].
There are numerous studies of diet and lung cancer risk that are relevant to our study. Vegetables, as whole foods, are not part of the DII although they are scored for the MDS. Nutrients associated with fruit and vegetable intake, such as vitamin C, fiber, and b-carotene are included in the DII and all score negatively (i.e., anti-inflammatory), and energy-adjusted intakes of both vegetables and fruit were inversely associated with the DII in this cohort. In a meta-analysis of seven North American and European cohorts, the only dietary carotenoid that showed an inverse association with lung cancer was β-cryptoxanthin, which is found at high levels in citrus fruit [42]. A more recent systematic review found small, nonsignificant inverse associations between dietary carotenoids and lung cancer [43]. Trials with supplemental β-carotene show no or adverse effects and a large observational study also indicated a potential for increased risk of lung cancer associated with supplements of β-carotene, retinol or lutein [41]. The Shanghai Men’s Study found that lung cancer risk was inversely associated with intakes of green leafy vegetables, β-carotene-rich vegetables, watermelon, vitamin A, and carotenoids [44].
A meta-analysis of 33 published studies, including 6 cohort studies found that an 120 g per day increment in consumption of red meat of might increase the risk of lung cancer by 35 %, and an increment of 50 g per day in consumption of processed meat might increase the risk of lung cancer by 20 % [45]. Consistent with this, a lower MDS, indicating a higher meat intake, was associated with lung cancer risk. Meat contains many of the nutrients that contribute positively to the DII score. In the 1995 Australian National Nutrition Survey, meat was the main source of total fat and cholesterol and a rich source of saturated fat in the Australian diet [46]. These nutrients all contribute positively to the DII, although other meat-related nutrients score negatively. Overall higher DII was associated with higher meat intake and higher fat intake. A pooled analysis of eight prospective studies did not find an association between fat or cholesterol and lung cancer risk [47].
Isoflavones also are a component of the DII and are found in soy products. A meta-analysis including 11 epidemiological studies, seven case–control and four cohort studies, found that after standardizing intake to grams/day of soy protein, there was an overall non-significant inverse association which in non-smokers was statistically significant [48]. We did not assess isoflavone intake, but the DII was inversely associated with legume intake, which would be the main source of isoflavones in this population. These vegetables also are associated with higher MDS.
In the current study both the DII and MDS showed some association with lung cancer risk, albeit mainly for those who were current smokers at baseline. The opposite directions of these associations were consistent with the way the scores reflect dietary intakes and with existing literature on associations between foods/nutrients and lung cancer. Reedy et al. [49] reported that for the NIH-AARP Diet and Health Study four different diet quality indices, Dietary Approaches to Stop Hypertension, alternative Mediterranean Diet Score, Healthy Eating Index-2010 and Alternative Healthy Eating Index-2010, all of which give a higher score for a ‘better’ diet, were inversely associated with total, cardiovascular and cancer mortality. This may reflect the importance of dietary features common to all: higher intakes of whole grains, vegetables, fruit and plant-based protein which contribute a range of phytochemicals with potential to impact cancer risk through different mechanisms working at different stages of cancer initiation and development [40]. Subtle differences between different indices and outcomes may reflect how other items such as red meat, alcohol and low-fat dairy were considered differently by the different indices. The DII is based on the idea that many disease-determining mechanisms operate in a pro-inflammatory environment. The most anti-inflammatory diets are likely to include foods that feature prominently in other ‘high-quality diets.’ It is important to note the fact in our population the correlations between the two diet scores was moderate (i.e., ρ = −0.45) and the correlation of each with CRP, as a biomarker of inflammation, were similar and very weak (i.e., ρ ≈ |0.10|).
Our findings support the hypothesis that consumption of an anti-inflammatory diet rich in fruit, vegetables, and wholemeal bread, and low in red meat and white bread reduces the risk of lung cancer, especially in smokers. As a composite index describing the overall effect of diet on inflammation, it is not possible to disaggregate the DII components to pinpoint individual foods that drive the effect. Inflammation is not a single mechanism, but rather a substrate for other mechanisms such as oxidative and nitrative DNA damage, changes in gene expression and genetic instability, insulin resistance, and blunted immune response. Therefore, additional work is needed to pinpoint the specific mechanism(s) of action.
Acknowledgments
Melbourne Collaborative Cohort Study (MCCS) recruitment was funded by VicHealth and Cancer Council Victoria. The MCCS was further supported by Australian National Health and Medical Research Council Grants 209057, 251553, and 1050198 and by infrastructure provided by Cancer Council Victoria. Cases and their vital status were ascertained through the Victorian Cancer Registry (VCR) and the Australian Institute of Health and Welfare (AIHW), including the National Death Index and the Australian Cancer Database. Drs. Shivappa and Hébert were supported by Grant Number R44DK103377 from the United States National Institute for Diabetes and Digestive and Kidney Diseases.
Footnotes
Author contribution This study was made possible by the contribution of many people, including the original investigators and the diligent team who recruited the participants and who continue working on follow-up. We would also like to express our gratitude to the many thousands of Melbourne residents who continue to participate in the study.
Compliance with ethical standards
Conflict of interest Dr. James R. Hébert owns controlling interest in Connecting Health Innovations LLC (CHI), a company planning to license the right to his invention of the dietary inflammatory index (DII) from the University of South Carolina in order to develop computer and smart phone applications for patient counseling and dietary intervention in clinical settings. Dr. Nitin Shivappa is an employee of CHI.
References
- 1.Torre LA, Bray F, Siegel RL, Ferlay J, Lortet-Tieulent J, Jemal A. Global cancer statistics, 2012. CA Cancer J Clin. 2015 doi: 10.3322/caac.21262. [DOI] [PubMed] [Google Scholar]
- 2.Shiels MS, Katki HA, Freedman ND, Purdue MP, Wentzensen N, Trabert B, Kitahara CM, Furr M, Li Y, Kemp TJ, et al. Cigarette smoking and variations in systemic immune and inflammation markers. J Natl Cancer Inst. 2014 doi: 10.1093/jnci/dju294. [DOI] [PMC free article] [PubMed] [Google Scholar]
- 3.Arnson Y, Shoenfeld Y, Amital H. Effects of tobacco smoke on immunity, inflammation and autoimmunity. J Autoimmun. 2010;34:J258–J265. doi: 10.1016/j.jaut.2009.12.003. [DOI] [PubMed] [Google Scholar]
- 4.Chaturvedi AK, Caporaso NE, Katki HA, Wong HL, Chatterjee N, Pine SR, Chanock SJ, Goedert JJ, Engels EA. C-reactive protein and risk of lung cancer. J Clin Oncol. 2010;28:2719–2726. doi: 10.1200/JCO.2009.27.0454. [DOI] [PMC free article] [PubMed] [Google Scholar]
- 5.Pine SR, Mechanic LE, Enewold L, Chaturvedi AK, Katki HA, Zheng YL, Bowman ED, Engels EA, Caporaso NE, Harris CC. Increased levels of circulating interleukin 6, interleukin 8, C-reactive protein, and risk of lung cancer. J Natl Cancer Inst. 2011;103:1112–1122. doi: 10.1093/jnci/djr216. [DOI] [PMC free article] [PubMed] [Google Scholar]
- 6.Shiels MS, Pfeiffer RM, Hildesheim A, Engels EA, Kemp TJ, Park JH, Katki HA, Koshiol J, Shelton G, Caporaso NE, et al. Circulating inflammation markers and prospective risk for lung cancer. J Natl Cancer Inst. 2013;105:1871–1880. doi: 10.1093/jnci/djt309. [DOI] [PMC free article] [PubMed] [Google Scholar]
- 7.Cavicchia PP, Steck SE, Hurley TG, Hussey JR, Ma Y, Ockene IS, Hebert JR. A new dietary inflammatory index predicts interval changes in serum high-sensitivity C-reactive protein. J Nutr. 2009;139:2365–2372. doi: 10.3945/jn.109.114025. [DOI] [PMC free article] [PubMed] [Google Scholar]
- 8.Shivappa N, Steck SE, Hurley TG, Hussey JR, Hebert JR. Designing and developing a literature-derived, population-based dietary inflammatory index. Public Health Nutr. 2014;17:1689–1696. doi: 10.1017/S1368980013002115. [DOI] [PMC free article] [PubMed] [Google Scholar]
- 9.Shivappa N, Steck SE, Hurley TG, Hussey JR, Ma Y, Ockene IS, Tabung F, Hebert JR. A population-based dietary inflammatory index predicts levels of C-reactive protein in the seasonal variation of blood cholesterol study (SEASONS) Public Health Nutr. 2014;17:1825–1833. doi: 10.1017/S1368980013002565. [DOI] [PMC free article] [PubMed] [Google Scholar]
- 10.van Woudenbergh GJ, Theofylaktopoulou D, Kuijsten A, Ferreira I, van Greevenbroek MM, van der Kallen CJ, Schalkwijk CG, Stehouwer CD, Ocke MC, Nijpels G, et al. Adapted dietary inflammatory index and its association with a summary score for low-grade inflammation and markers of glucose metabolism: the cohort study on diabetes and atherosclerosis maastricht (CODAM) and the Hoorn study. Am J Clin Nutr. 2013;98:1533–1542. doi: 10.3945/ajcn.112.056333. [DOI] [PubMed] [Google Scholar]
- 11.Shivappa N, Prizment AE, Blair CK, Jacobs DR, Jr, Steck SE, Hebert JR. Dietary inflammatory index and risk of colorectal cancer in the Iowa women’s health study. Cancer Epidemiol Biomarkers Prev. 2014;23:2383–2392. doi: 10.1158/1055-9965.EPI-14-0537. [DOI] [PMC free article] [PubMed] [Google Scholar]
- 12.Zamora-Ros R, Shivappa N, Steck SE, Canzian F, Landi S, Alonso MH, Hebert JR, Moreno V. Dietary inflammatory index and inflammatory gene interactions in relation to colorectal cancer risk in the Bellvitge colorectal cancer case– control study. Genes Nutr. 2015;10:447. doi: 10.1007/s12263-014-0447-x. [DOI] [PMC free article] [PubMed] [Google Scholar]
- 13.Tabung FK, Steck SE, Ma Y, Liese AD, Zhang J, Caan B, Hou L, Johnson KC, Mossavar-Rahmani Y, Shivappa N, et al. The association between dietary inflammatory index and risk of colorectal cancer among postmenopausal women: results from the women’s health initiative. Cancer Causes Control. 2015;26:399–408. doi: 10.1007/s10552-014-0515-y. [DOI] [PMC free article] [PubMed] [Google Scholar]
- 14.Shivappa N, Bosetti C, Zucchetto A, Montella M, Serraino D, La Vecchia C, Hebert JR. Association between dietary inflammatory index and prostate cancer among Italian men. Br J Nutr. 2014 doi: 10.1017/S0007114514003572. [DOI] [PMC free article] [PubMed] [Google Scholar]
- 15.Shivappa N, Bosetti C, Zucchetto A, Serraino D, La Vecchia C, Hebert JR. Dietary inflammatory index and risk of pancreatic cancer in an Italian case–control study. Br J Nutr. 2014 doi: 10.1017/S0007114514003626. [DOI] [PMC free article] [PubMed] [Google Scholar]
- 16.Shivappa N, Hebert JR, Rietzschel ER, De Buyzere ML, Langlois M, Debruyne E, Marcos A, Huybrechts I. Associations between dietary inflammatory index and inflammatory markers in the Asklepios study. Br J Nutr. 2015;113:665–671. doi: 10.1017/S000711451400395X. [DOI] [PMC free article] [PubMed] [Google Scholar]
- 17.Tabung FK, Steck SE, Zhang J, Ma Y, Liese AD, Agalliu I, Hingle M, Hou L, Hurley TG, Jiao L, et al. Construct validation of the dietary inflammatory index among postmenopausal women. Ann Epidemiol. 2015;25:398–405. doi: 10.1016/j.annepidem.2015.03.009. [DOI] [PMC free article] [PubMed] [Google Scholar]
- 18.Wirth MD, Burch J, Shivappa N, Violanti JM, Burchfiel CM, Fekedulegn D, Andrew ME, Hartley TA, Miller DB, Mnatsakanova A, et al. Association of a dietary inflammatory index with inflammatory indices and metabolic syndrome among police officers. J Occup Environ Med. 2014;56:986–989. doi: 10.1097/JOM.0000000000000213. [DOI] [PMC free article] [PubMed] [Google Scholar]
- 19.Shivappa N, Steck SE, Hussey JR, Ma Y, Hebert JR. Inflammatory potential of diet and all-cause, cardiovascular, and cancer mortality in National Health and Nutrition Examination Survey III study. Eur J Nutr. 2015 doi: 10.1007/s00394-015-1112-x. [DOI] [PMC free article] [PubMed] [Google Scholar]
- 20.Turner-McGrievy GM, Wirth MD, Shivappa N, Wingard EE, Fayad R, Wilcox S, Frongillo EA, Hebert JR. Randomization to plant-based dietary approaches leads to larger short-term improvements in Dietary Inflammatory Index scores and macronutrient intake compared with diets that contain meat. Nutr Res. 2015;35:97–106. doi: 10.1016/j.nutres.2014.11.007. [DOI] [PubMed] [Google Scholar]
- 21.Martinez-Gonzalez MA, Salas-Salvado J, Estruch R, Corella D, Fito M, Ros E. Benefits of the Mediterranean diet: insights from the PREDIMED study. Prog Cardiovasc Dis. 2015;58:50–60. doi: 10.1016/j.pcad.2015.04.003. [DOI] [PubMed] [Google Scholar]
- 22.Maisonneuve P, Shivappa N, Hebert JR, Bellomi M, Rampinelli C, Bertolotti R, Spaggiari L, Palli D, Veronesi G, Gnagnarella P. Dietary inflammatory index and risk of lung cancer and other respiratory conditions among heavy smokers in the COSMOS screening study. Eur J Nutr. 2015 doi: 10.1007/s00394-015-0920-3. [DOI] [PMC free article] [PubMed] [Google Scholar]
- 23.Giles GG, English DR. The Melbourne collaborative cohort study. IARC Sci Publ. 2002;156:69–70. [PubMed] [Google Scholar]
- 24.Ireland P, Jolley D, Giles G, O’Dea K, Powles J, Rutishauser I, Wahlqvist M, Williams J. Development of the Melbourne FFQ: a food frequency questionnaire for use in an Australian prospective study involving an ethnically diverse cohort. Asia Pac J Clin Nutr. 1994;3:19–31. [PubMed] [Google Scholar]
- 25.Lewis J, Milligan G, Hunt A. NUTTAB 95 nutrient data table for use in Australia. Australian Government Publishing Service; Canberra: 1995. [Google Scholar]
- 26.Holland B, Welch AA, Unwin ID, Buss DHPA, Southgate DAT. McCance and Widdowson’s the composition of foods. Royal Society of Chemistry; Cambridge, Cambridge: 1993. [Google Scholar]
- 27.Royal Melbourne Institute of Technology University Lipid Research Group. Fatty acid compositional data base. Xyris software; Brisbane: 2001. [Google Scholar]
- 28.US Department of Agriculture, Agricultural Research Service, Nutrient Data Laboratory. USDA-NCC Carotenoid database for US foods-1998. 2003 http://www.nal.usda.gov/fnic/foodcomp/Data/car98/car98.html. Accessed Mar 2009.
- 29.Trichopoulou A, Costacou T, Bamia C, Trichopoulos D. Adherence to a Mediterranean diet and survival in a Greek population. N Engl J Med. 2003;348:2599–2608. doi: 10.1056/NEJMoa025039. [DOI] [PubMed] [Google Scholar]
- 30.Baghurst KI, Record SJ, Leppard P. Red meat consumption in Australia: intakes, nutrient contribution and changes over time. Aust J Nutr Diet. 2000;57:S1–S36. [Google Scholar]
- 31.Martinez-Gonzalez MA, de la Fuente-Arrillaga C, Nunez-Cordoba JM, Basterra-Gortari FJ, Beunza JJ, Vazquez Z, Benito S, Tortosa A, Bes-Rastrollo M. Adherence to Mediterranean diet and risk of developing diabetes: prospective cohort study. BMJ. 2008;336:1348–1351. doi: 10.1136/bmj.39561.501007.BE. [DOI] [PMC free article] [PubMed] [Google Scholar]
- 32.MacInnis RJ, English DR, Hopper JL, Haydon AM, Gertig DM, Giles GG. Body size and composition and colon cancer risk in men. Cancer Epidemiol Biomarkers Prev. 2004;13:553–559. [PubMed] [Google Scholar]
- 33.Pink B. Socio-economic indexes for areas. Australian Bureau of Statistics; Canberra: 2013. p. 2011. [Google Scholar]
- 34.Hodge AM, English DR, O’Dea K, Giles GG. Glycemic index and dietary fiber and the risk of type 2 diabetes. Diabetes Care. 2004;27:2701–2706. doi: 10.2337/diacare.27.11.2701. [DOI] [PubMed] [Google Scholar]
- 35.Liu S, Manson JE, Buring JE, Stampfer MJ, Willett WC, Ridker PM. Relation between a diet with a high glycemic load and plasma concentrations of high-sensitivity C-reactive protein in middle-aged women. Am J Clin Nutr. 2002;75:492–498. doi: 10.1093/ajcn/75.3.492. [DOI] [PubMed] [Google Scholar]
- 36.Willett WC, Howe GR, Kushi LH. Adjustment for total energy intake in epidemiologic studies. Am J Clin Nutr. 1997;65:1220S–1228S. doi: 10.1093/ajcn/65.4.1220S. discussion 1229S–1231S. [DOI] [PubMed] [Google Scholar]
- 37.Korn EL, Graubard BI, Midthune D. Time-to-event analysis of longitudinal follow-up of a survey: choice of the timescale. Am J Epidemiol. 1997;145:72–80. doi: 10.1093/oxfordjournals.aje.a009034. [DOI] [PubMed] [Google Scholar]
- 38.Rothman K, Greenland S, Lash T. Modern Epidemiology. 3rd. Lipincott Williams and Wilkins; Philadelphia: 2008. [Google Scholar]
- 39.Kirkwood BR, Sterne JAC. Essential Medical Statistics. 2nd. Blackwell Science; Malden: 2003. [Google Scholar]
- 40.World Cancer Reserach Fund, American Institue for Cancer Research. Food, nutrition, physical activity, and the prevention of cancer: a global perspective. AICR; Washington DC: 2007. [Google Scholar]
- 41.Satia JA, Littman A, Slatore CG, Galanko JA, White E. Long-term use of beta-carotene, retinol, lycopene, and lutein supplements and lung cancer risk: results from the vitamins and lifestyle (VITAL) study. Am J Epidemiol. 2009;169:815–828. doi: 10.1093/aje/kwn409. [DOI] [PMC free article] [PubMed] [Google Scholar]
- 42.Mannisto S, Smith-Warner SA, Spiegelman D, Albanes D, Anderson K, van den Brandt PA, Cerhan JR, Colditz G, Feskanich D, Freudenheim JL, et al. Dietary carotenoids and risk of lung cancer in a pooled analysis of seven cohort studies. Cancer Epidemiol Biomarkers Prev. 2004;13:40–48. doi: 10.1158/1055-9965.epi-038-3. [DOI] [PubMed] [Google Scholar]
- 43.Gallicchio L, Boyd K, Matanoski G, Tao XG, Chen L, Lam TK, Shiels M, Hammond E, Robinson KA, Caulfield LE, et al. Carotenoids and the risk of developing lung cancer: a systematic review. Am J Clin Nutr. 2008;88:372–383. doi: 10.1093/ajcn/88.2.372. [DOI] [PubMed] [Google Scholar]
- 44.Takata Y, Xiang YB, Yang G, Li H, Gao J, Cai H, Gao YT, Zheng W, Shu XO. Intakes of fruits, vegetables, and related vitamins and lung cancer risk: results from the Shanghai Men’s Health Study (2002–2009) Nutr Cancer. 2013;65:51–61. doi: 10.1080/01635581.2013.741757. [DOI] [PMC free article] [PubMed] [Google Scholar]
- 45.Xue XJ, Gao Q, Qiao JH, Zhang J, Xu CP, Liu J. Red and processed meat consumption and the risk of lung cancer: a dose-response meta-analysis of 33 published studies. Int J Clin Exp Med. 2014;7:1542–1553. [PMC free article] [PubMed] [Google Scholar]
- 46.Australian Bureau of Statistics. National Nutrition Survey nutrient intakes and physical measurements Australia. Australian Bureau of Statistics; Canberra: 1998. [Google Scholar]
- 47.Smith-Warner SA, Ritz J, Hunter DJ, Albanes D, Beeson WL, van den Brandt PA, Colditz G, Folsom AR, Fraser GE, Freudenheim JL, et al. Dietary fat and risk of lung cancer in a pooled analysis of prospective studies. Cancer Epidemiol Biomarkers Prev. 2002;11:987–992. [PubMed] [Google Scholar]
- 48.Wu SH, Liu Z. Soy food consumption and lung cancer risk: a meta-analysis using a common measure across studies. Nutr Cancer. 2013;65:625–632. doi: 10.1080/01635581.2013.795983. [DOI] [PMC free article] [PubMed] [Google Scholar]
- 49.Reedy J, Krebs-Smith SM, Miller PE, Liese AD, Kahle LL, Park Y, Subar AF. Higher diet quality is associated with decreased risk of all-cause, cardiovascular disease, and cancer mortality among older adults. J Nutr. 2014;144:881–889. doi: 10.3945/jn.113.189407. [DOI] [PMC free article] [PubMed] [Google Scholar]