Abstract
L-Cysteine functionalized magnetite nanoparticles (L-Cyst-Fe3O4 NPs) were synthesized by chemical co-precipitation using Fe2+ and Fe3+ as iron precursors, sodium hydroxide as a base and L-Cysteine as functionalized agent. The structural and morphological studies were carried out using X-ray powder diffraction, transmission electron microscopy, dynamic light scattering, scanning electron microscopy and energy dispersive X-ray spectroscopy, Fourier transform infrared spectroscopy, and UV-Vis spectrophotometric techniques. The zeta potential of bare Fe3O4 and functionalized L-Cyst-Fe3O4 NPs were +28 mV and −30.2 mV (pH 7.0), respectively. The positive surface charge changes to negative imply the presence of L-Cyst monolayer at particle interface. Band gap energy of 2.12 eV [bare Fe3O4NPs] and 1.4 eV [L-Cyst-Fe3O4 NPs] were obtained. Lead and chromium removal were investigated at different initial pHs, contact time, temperatures and adsorbate-adsorbent concentrations. Maximum Cr6+ and Pb2+ removal occurred at pH 2.0 and 6.0, respectively. Sorption dynamics data were best described by pseudo-second order rate equation. Pb2+ and Cr6+ sorption equilibrium data were best fitted to Langmuir equation. Langmuir adsorption capacities of 18.8 mg/g (Pb2+) and 34.5 mg/g (Cr6+) at 45 °C were obtained. Regeneration of exhausted L-Cyst-Fe3O4 NPs and recovery of Pb2+/Cr6+ were demonstrated using 0.01 M HNO3 and NaOH. L-Cyst-Fe3O4 NPs stability and reusability were also demonstrated.
Introduction
Heavy metals’ presence above their prescribed limits in water bodies imprints toxic effects to the aquatic life and human health1, 2. Mining, agricultural and technological applications are common anthropogenic inputs of heavy metals exposure to human beings2, 3.
Lead and chromium are commonly used heavy metals associated with toxic poisoning even at low concentrations and bear no biological benefit to humans1, 3. Common sources of lead include effluents from battery manufacturing, steel industries, painting pigment, fuels, photographic materials, aeronautical, automobile, explosive manufacturing, and coating industries4, 5. Accumulation of lead in humans can cause cancer, kidney diseases, memory problems and high blood pressure, premature birth, brain damage, hearing loss, learning disabilities and a lower IQ level in children6–8.
Chromium is a toxic heavy metal and exists mainly in two oxidation states in water i.e. Cr (III) and Cr (VI)9. Cr (VI) species is more toxic than Cr (III). Cr (VI) a toxic, carcinogenic and highly soluble in aqueous systems10. Electroplating, leather tanning, mining, metal processing and film processing are common anthropogenic sources of chromium introduce to water bodies9, 10. The World Health Organization (WHO) recommends a permissible limit of 0.1 mg/L and 0.05 mg/L for lead and chromium, respectively9. The US Environmental Protection Agency (USEPA) recommends a maximum permissible limit of 0.1 mg/L and 0.015 mg/L for lead and chromium in drinking water, respectively.
Common methods employed for aqueous lead and chromium removal include electrochemical technique, reverse osmosis, membrane filtration, ion-exchange and adsorption11–14. Adsorption is a simple, economical and effective method for aqueous contaminants removal15. Adsorbents including activated carbons15, clay minerals16 and chitosan/natural zeolites17 have been explored for heavy metals’ aqueous remediation. However, their separation post-adsorption requires tedious filtration step.
To overcome this filtration, use of magnetite nanoparticles is a viable approach. Magnetite nanoparticles are super paramagnetic, hydrophilic and possess high surface area. Therefore, the exhausted nanoparticles can be stripped-out from aqueous systems using a simple magnet18, 19. Magnetite NPs aggregate due to long range Van der Waals’ forces, thereby difficult to stabilize their colloidal dispersions. As a result, there is a decrease in its surface area and adsorption capacity20. Thus, magnetite dispersion is a vital factor while considering its sorptive applications. Magnetite NPs have been modified using amine21, thiol22, naphthalimide23, and reactive blue-1924 to enhance the dispersion.
L-Cysteine (L-Cyst) [HO2CCH (NH2) CH2SH] is an amino acid with a redox and catalytic behavior. L-Cysteine also possesses remarkable metal binding properties25. It is a sulfur-containing amino acid having three functional groups (-SH, -NH2, -COOH), which has strong tendency to co-ordinate with cations including heavy metal ions25, 26. Sulfur in the -SH is divalent and endows L-Cyst with an additional function, acting as an antioxidant26. The -NH2 and -COOH functional groups in L-Cyst provides magnetite NPs a good bio-compatibility and solubility27. The -NH2 and -COOH groups in magnetite NPs participated well in the aqueous removal of Cu (II), Co (II), Ni (II), Zn (II), Pb (II), Cr (VI) and Cd (II) by forming various complexes27, 28. Many studies have reported enhancing biocompatible behavior of cysteine as well as incorporating antibacterial characteristics29, 30. Cysteine on one side induces biocompatibility for mammalian cell line while on other side promotes antibacterial behavior against bacterial strains.
In this paper, L-Cyst functionalized magnetite NPs were synthesized, characterized and successfully applied for aqueous Pb2+ and Cr6+ removal. Pb2+ and Cr6+ adsorption on L-Cyst-Fe3O4 NPs were performed at different initial pHs, temperatures, contact times and adsorbate-adsorbent concentrations. The sorption data were fitted to Freundlich and Langmuir isotherm equations. Sorption thermodynamic parameters were also determined. Pseudo-first and second order rate equations were used to fit the kinetic data.
Experimental
Materials and Methods
All the chemicals used were either AR or GR grades. Lead nitrate, Pb (NO3)2 (99%), potassium dichromate, K2Cr2O7 (99%), ethanol (99%), hydrochloric acid, HCl and sodium hydroxide, NaOH (98%) were obtained from Merck, India. Ferric chloride hexahydrate, FeCl3 . 6H2O (97%) and ferrous chloride tetra hydrate, FeCl2 . 4H2O (97%) were purchased from CDH, India. L-Cysteine (L-Cyst 98%) was purchased from Sigma Aldrich. Chemicals including Roswell Park Memorial Institute (RPMI) 1640 medium, fetal bovine serum (FBS), antibiotic-antimycotic solution 100X, Trypsin-EDTA Solution 1X, dimethyl sulphoxide (DMSO), Dulbecco’s phosphate buffered saline (DPBS) 1X and 3-(4, 5-dimethyle-2-thiazolyl)-2 and 5-diphenyl-2H-tetrazolium bromide (MTT) for biocompatibility studies were procured from HiMedia Laboratories Pvt. Ltd. Tissue culture treated plate (96-wells) and T-20 flask received from Costar 3599 and Nucleon respectively. MTT stock solution (5 mg/mL) was prepared in DPBS by dissolving MTT with the help of vortex. All chemicals were used as received without further purification.
L-Cyst-Fe3O4 nanoparticle synthesis
L-Cyst functionalized magnetite nanoparticles (L-Cyst-Fe3O4 NPs) were synthesized using co-precipitation method discussed elsewhere21. Briefly, 16.2 g FeCl3 and 6.3 g FeCl2 (molar ratio 2:1) were dissolved and stirred in 100 mL distilled water for 1 h at 40 °C. A 2 M NaOH solution was added drop wise (1drop/2 sec) to Fe2+-Fe3+ solution for pH rise. During iron-oxide NPs formation, the suspension turned to black. Suspension was ultrasonicated for 30 min. A 0.2 M L-Cyst solution was prepared by adding 1.21 g of L-Cyst to 50 mL distilled water. The L-Cyst solution was added dropwise to NPs suspension and stirred for 20 min. Finally, NPs were separated by centrifugation (at 5500 rpm for 15 min). The separated NPs were washed for atleast five times with 25 mL distilled water and ethanol. NPs were dried overnight at 60 °C. The reaction mechanism for the formation of L-Cyst-Fe3O4 NPs is shown in Fig. S1 (Supplementary Information).
Biocompatibility Studies
A549 human lung epithelial cancerous cells were incubated in RPMI 1640 medium with 10% FBS and 1% antibiotic-antimycotic solution 100X in 5% CO2 at 37 °C. Once cells achieved 90% confluency in T-20 culture flask then moved forward for MTT assay in 96-wells tissue culture treated plate. Initially, 5 × 10³ cells/well with 10% (FBS) RPMI-1640 were plated in 96-well tissue culture plate and incubated for next 24 h in 5% CO2 incubator at 37 °C. After achieving of 90% confluency, the media was replaced with 1% RPMI-1640 containing Fe3O4 and L-Cyst-Fe3O4 at different concentration ranges from 10 to 100 µg/mL and again incubated for next 24 h. Then 30 µL of MTT (5 mg/mL in DPBS) were added to each well. The tissue culture plate was kept in dark condition for 4 h in 5% CO2 incubator at 37 °C to allow the reduction of MTT dye to formazan crystal by living cells. After 4 h, whole media was removed and 200 µL of DMSO added to solubilize crystal. Absorbance was measured at 570 nm with the help of ELISA plate reader. The percentage (%) change in proliferation was calculated on control cells that were not exposed to NPs (i.e., only cells). All experiments were done in triplicate sets.
Adsorption experiments
Adsorption studies for Pb2+ and Cr6+ removal by L-Cyst-Fe3O4 NPs were conducted in batch mode. Effect of pH on Pb2+ and Cr6+ was investigated at various initial pHs (pH 2.0 to 7.0 for Pb2+) and (pH 2.0 to 8.0 for Cr6+). Solutions pHs were adjusted using 1 M NaOH and 1 M HCl. The effect of contact time and adsorbent dose on Pb2+ and Cr6+ sorption were performed at different time intervals [5, 10, 15, 20, 25 and 35 minutes] and L-Cyst-Fe3O4 NPs dosage (1, 1.5, 2.0, 2.5 and 3.0 g/L). Sorption equilibrium studies were conducted by dispersing 0.1 mg adsorbent with 50 mL Pb2+ or Cr6+ solution [initial conc. = 10, 20, 40, 50, 60, 80, 100, 120, 150 mg/L; agitation speed = 200 rpm] at 25, 35 and 45 °C for 1 h. Upon reaching equilibrium, samples were filtered using a Whatman no. 42 filter paper. Equilibrium Pb2+ and Cr6+ concentrations were measured on AAS. The amount of Pb2+ and Cr6+ adsorbed on L-Cyst-Fe3O4 NPs per unit mass was calculated using eq. 1.
| 1 |
Where, qe is the amount of adsorbate adsorbed on per gram of adsorbent (mg/g), Ci & Ce are the initial and equilibrium concentrations (mg/L) of Pb2+ and Cr6+ in solution, V is the volume (L), and W is the weight (g) of the adsorbent.
L-Cyst-Fe3O4 NPs characterization
The crytallinity and morphology of L-Cyst-Fe3O4 NPs were investigated on an X-ray powder diffractometer (model D/max 200, Rigaku) using a Cu-Kα radiation (λ = 1.54 Å; accelerating voltage = 40 KV; 2θ range = 10° to 80°; count rate = 1°/min). TEM micrographs were recorded using a transmission electron microscope (model JEM-2200 FS, JEOL) at an operating voltage of 200 KV. A pinch of sample was ultrasonicated with acetone for 10 min. An amorphous carbon coated copper grid was dipped in ultrasonicated solution and dried under vacuum. The grid was placed in the sample compartment to record the micrographs. The morphology, chemistry and elemental distribution of bare and loaded nanoparticle samples were carried out on a scanning electron microscope (model JSM-6480, JEOL; accelerating voltage = 20 KV). SEM elemental mapping images were captured using an EDS system (model Quantax 200, Bruker) supported with Esprit 1.8 software. A trace of sample was spread on a double stick carbon tape supported on an aluminum stub. Samples were made conductive by applying a gold coating using a sputter coater.
The optical studies of Fe3O4 and L-Cyst-Fe3O4 NPs were performed using a UV-Vis spectrophotometer (model Systronis-117) (λ range = 200–600 nm). A trace of sample was dispersed in 10 mL distilled water. Functional groups on bare and loaded adsorbents were identified using a Fourier transforms infrared spectrometer (FTIR; Model 600 UMA, Varian). Pellets were prepared by placing the NPs and KBr mixture (1:20 ratio) on a steel dye at a pressure of 10 tons using a hydraulic press.
The hydrodynamic radius of Fe3O4 and L-Cyst-Fe3O4 NPs was obtained from dynamic light scattering (DLS) measurements performed at a scattering angle, θ = 90° and laser wavelength of He/Ne laser (λ = 632.8 nm) using LS Spectrometer (model HNL210L, Thorlabs)31. The sample for analysis was prepared by dispersing pinch of NPs in 15 mL of distilled water. The hydrodynamic radius was obtained from Stoke-Einstein relation (eq. 2).
| 2 |
Where, η is the solvent viscosity is, kB is the Boltzmann constant, and T is the absolute temperature.
The point zero charge (pHpzc) of L-Cyst-Fe3O4 NPs were obtained from zeta-potential measurements performed on an electrophoresis instrument (model ZC-2000, Microtec, Japan). The samples were prepared by dispersing trace amount of NPs in 20 mL of distilled water followed by agitation for 48 h32. The pHpzc value was determined from a plot of initial pH versus pH of the supernatant.
Brunauer-Emmett-Teller (BET) surface area and porosity of synthesized Fe3O4 and L-Cyst-Fe3O4 NPs were determined by N2 adsorption-desorption studies using Quantachrome analyzer (model Autosorb-1). Samples (0.15 g) were degassed at 150 °C for 6 h at <10−3 Torr before adsorption measurements. Initial and equilibrium lead and chromium concentrations were measured using an atomic absorption spectrometer (AAS) (Model Aanalyst400, Perkin Elmer).
Results and Discussion
Characterization of L-Cyst-Fe3O4 NPs
X-ray powder diffraction (XRD)
XRD patterns of synthesized Fe3O4 and L-Cyst-Fe3O4 NPs are shown in Fig. S2 (Supplementary Information). The XRD patterns of Fe3O4 and L-Cyst-Fe3O4 NPs show diffraction miller planes at (200), (311), (400), (422), (511), (440) and (533) corresponding to the angle 2θ = 30°.091′, 35°.06′, 43°.076′, 53°.439′, 56°.96′, 62°.55′ and 74°.003′, respectively. The XRD peaks correspond to magnetite (JCPDS file no. 87–0245) and an inverse spinel and face centered cubic (fcc) structure. The XRD patterns confirm that L-Cyst functionalization on magnetite surface did not alter the phase and the nature of magnetite. Thus, L-Cyst-Fe3O4 is validated as Fe3O4. The average crystalline sizes of Fe3O4 and L-Cyst-Fe3O4 NPs were calculated using Debye-Scherer formula and most intense peak corresponding to (311) [eq. 3]. The average crystal sizes for Fe3O4 and L-Cyst-Fe3O4 NPs are 15 nm and 10.4 nm, respectively.
| 3 |
Where, 0.9 is the value assigned for constant ‘K’, which is related to the Miller index of crystallographic planes, λ is the wavelength of X-ray, θ is half of the diffraction angle and β is the angular width (in radians) at half-maximum intensity.
Transmission electron microscopy (TEM)
Figure 1(a–c) shows TEM micrographs of L-Cyst-Fe3O4 NPs. The particles were highly dispersed as compared with bare Fe3O4 NPs [Fig. S3(a); (Supplementary Information)] and exhibited a uniform spherical morphology with an average crystal size of 10 nm. HRTEM captured lattice fringes (d = 0.199 nm) and confirmed a crystalline nature of NPs [image (d)]. The SAED patterns show the crytallinity of L-Cyst-Fe3O4 NPs [image (e)]. The particle size distribution of L-Cyst-Fe3O4 NPs ranges from 5 to 13 nm [image (f)].
Figure 1.
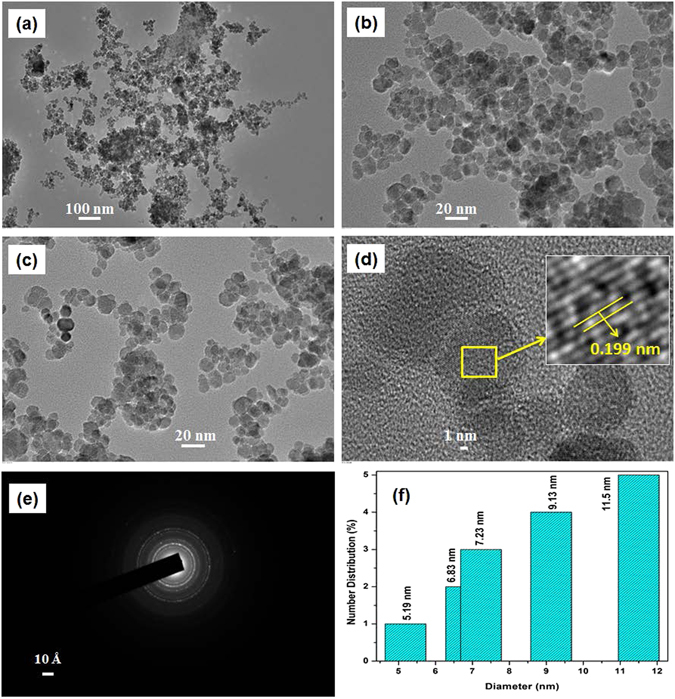
TEM images of L-Cyst-Fe3O4 NPs (a) at 20 kx; (b,c) at 10 kx magnification; (d) HR-TEM and inset shows lattice plane; (e) SAED pattern and (f) particle distribution of L-Cyst-Fe3O4 NPs.
Dynamic light scattering (DLS)
The hydrodynamic diameter provides information about inorganic core along with functionalized/coated material and the solvent layer attached to the particle as it moves under the influence of Brownian motion. The hydrodynamic sizes of Fe3O4 and L-Cyst-Fe3O4 NPs were 52 and 68 nm, respectively [Figure omitted for brevity]. The increase in the hydrodynamic size of functionalized magnetite NPs is due to an increase in adsorption of L-Cyst moieties onto the surface of the magnetite NPs33. This demonstrates a more hydrophilic nature of L-Cyst-Fe3O4 NPs than Fe3O4 NPs. Similar observations were reported earlier27. The size obtained from DLS was large as compared with TEM because in DLS dispersed NPs moves through a liquid medium and thin layer of electric dipole of the solvent adheres to its surface31.
Scanning Electron Microscopy (SEM)
The surface morphology of Fe3O4 and L-Cyst-Fe3O4 NPs were confirmed by SEM [Fig. S4(a–d); Supplementary Information]. The magnetite NPs were rough, globular and aggregated [Fig. S4(a,b)]. Impregnation of L-Cyst on Fe3O4 NPs is clearly visible in Fig. S4(c,d) (Supplementary Information). The morphological characteristics of L-Cyst-Fe3O4 NPs are favorable for metal adsorption. EDX analysis of Fe3O4 NPs shows the presence of iron (80.29%) and oxygen (19.71%) [Fig. S5(a); Supplementary Information]. Further, L-Cyst-Fe3O4 NPs show the presence of iron (90.93%), oxygen (5.23%), sulfur (2.17%), carbon (0.53%), and nitrogen (1.15%) [Fig. S5(b); Supplementary Information].
Optical Studies
The optical absorption spectra of Fe3O4 and L-Cyst-Fe3O4 NPs are shown in Fig. S6(a) [Supplementary Information]. Absorption peak due to π-π* interaction appeared at 210 nm. Two absorption peaks at 300–365 nm (broad) and at 224 nm (sharp) represent the characteristic of iron NPs [Fig. S6(a)]. A sharp peak at 224 nm is due to the blue shift absorption band, thereby indicating the formation of polydisperse iron NPs34 . The broad peak at 300–365 nm is due to Fe3O4 NPs local oxygen vacancies present in the lattice, indicating iron NPs formation34, 35. Wide peak was observed in the range 470–500 nm, which is attributed due to the formation of pair excitation of magnetically coupled Fe3+ ions36, 37. There was a decrease in the peak intensities at 228 and 300–365 nm after L-Cyst functionalization of magnetite. The peaks became wide. This indicated a decrease in electronic excitation state due to the formation of Fe-S bond.
The optical band gap energy was determined using the Tauc’s relation (eq. 4).
| 4 |
Where, α is the absorption coefficient of NPs at a certain wavelength λ, h is Planck’s constant, C is a proportionality constant, Ѵ is the incident light frequency, Eg is the band gap energy, and the exponent, n = 1/2 and 2 for direct and indirect band gaps of NPs, respectively.
The band gaps of Fe3O4 and L-Cyst-Fe3O4 NPs were obtained by plotting curves between (αhѴ)2 and hѴ [Fig. S6(b); Supplementary Information]. The energy band gap (Eg) of Fe3O4 (2.12 eV) was higher than those of bulk iron (2.0 eV)35. The band gap further decreased (1.4 eV) after L-Cyst impregnation. This could be possibly due to the hydrophilic nature of L-Cyst that resulted in peak broadening. Band gap widening is because of the striking quantum confinement effect observed in many other semiconducting mate rials that possess delocalized electronic states close to the Fermi level38. This confirms that L-Cyst is successfully funtionalized onto magnetite surface.
Zeta Potential Study
The surface charges on synthesized Fe3O4 and L-Cyst-Fe3O4 NPs at pH 7 are shown in Fig. 2(a). The surface charge of magnetite in water could be explained by surface hydroxyl groups (Fe-OH). The Fe3O4 NPs zeta potential is positive (+28 mV), which are expected due to the formation of +Fe–OH2 in a basic environment [Fig. 2(a); sample (i)]. However, L-Cyst-Fe3O4 NPs have a negative zeta potential (−30.2 mV) [Fig. 2(a); sample (ii)]. The expected negative surface charge is due to the presence of carboxyl group above its isoelectric point [5.07]27. L-Cyst, like other amino acids, is a zwitterionic molecule25, 27. Thus, zeta potential of L-Cyst varies with pH25, 30. L-Cyst is negatively charged due to the presence of carboxyl group [pH < pHpzc (5.07)] and positively charged due to the presence of ammonium group [pH > pHpzc (5.07)]27. Thus, at pH 6.0, L-Cyst-Fe3O4 NPs exhibit a negative zeta potential39. This again confirmed the successful loading of L-Cyst on magnetite surface.
Figure 2.
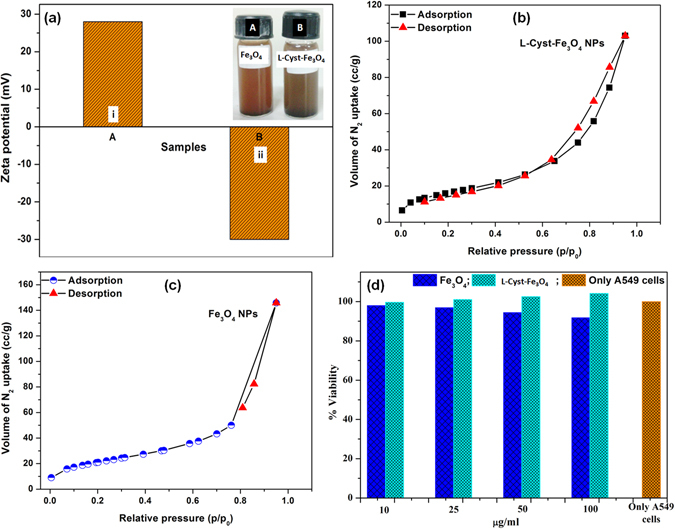
(a) Zeta potential of (i) Fe3O4 and (ii) L-Cyst-Fe3O4 NPs; (b) N2 adsorption-desorption isotherms of L-Cyst-Fe3O4 and (c) bare Fe3O4 NPs; (d) Comparative biocompatibility analysis of Fe3O4 and L-Cyst-Fe3O4 on A459 Cell line.
Brunauer-Emmett-Teller (BET) Surface Area and Porosity Measurements
BET surface area and pore size distribution of bare Fe3O4 and L-Cyst-Fe3O4 NPs were determined by plotting the N2 adsorption-desorption isotherms [Fig. 2(b,c)]. N2 adsorption studies were performed by degassing the sample in vacuum at 150 °C for about 6 h. It is evident from Fig. 2(b,c) that N2 adsorption-desorption curve is a typical type IV adsorption isotherm with a hysteresis loop of type H2. Such type of isotherm explains the monolayer formation of adsorption40. The BET specific surface area of bare Fe3O4 and L-Cyst-Fe3O4 NPs, calculated from the nitrogen adsorption analysis were 75.69 and 58.49 m2/g, respectively. The average pore width was determined from distribution (PSD) curve using the Barrett-Joyner-Halenda (BJH) method and obtained as 11.9 and 10.8 nm for Fe3O4 and L-Cyst-Fe3O4 NPs, respectively. The pore size of Fe3O4 NPs varies from 16.8 to 11.9 nm and 6.2 to 10.8 nm for L-Cyst-Fe3O4 NPs, indicating that both the NPs were mesoporous in nature41. The total pore volume was obtained as 0.22 for Fe3O4 and 0.159 cm3/g for L-Cyst-Fe3O4 NPs. It is clear from comparative Table S1 (Supplementary Information), there is not much decrease in surface area and pore size of L-Cyst-Fe3O4 NPs versus Fe3O4 NPs, which is probably due to disruption in aggregation after surface modification42. In addition, this decrease in surface area possibly due to the presence of skinny layer of L-Cyst onto Fe3O4 NPs surface42, 43. Figure 2(b,c) shows BET constant [calculated from slope and intercept of the adsorption isotherm on the ordinate], significantly decreases after surface modification of Fe3O4 NPs. The BET theory signifies constant “C” as enthalpy of adsorption42, 44. Thus, its decrease indicates the decrease in interaction between adsorbate N2 molecules and magnetite surface after functionalized with L-Cyst. Similar results were earlier reported in literature42–44.
Biocompatibility Studies
It was observed that the A549 cells viability increased after functionalization of L-Cyst onto Fe3O4 NPs. The L-Cyst-Fe3O4 NPs at the concentrations of 100, 50, 25, 10 µg/mL promoting cell proliferation by 104.15%, 102.56%, 101.09% and 99.63% versus bare Fe3O4 NPs at the concentrations of 100, 50, 25, 10 µg/mL [Fig. 2(d)]. This may be due to Cysteine moiety.
Pb2+ and Cr6+ adsorption on L-Cyst-Fe3O4 NPs
Effect of Initial pH
The solution pH provides information about effect of adsorbent functional groups, degree of ionization of adsorbate, the metal ions solubility, and the concentration of counter ions during reaction40. Adsorption studies were carried out in the pH range of 2.0–7.0 for Pb2+ and 2.0–8.0 for Cr6+ at 25 °C (equilibrium time: 60 min; agitation speed: 200 rpm; adsorbent dose: 2.0 g/L; adsorbate concentration: 50 mg/L). pH adjustments were made using 1 M NaOH and 1 M HCl. Pb2+ removal was increased with increase in pH [Fig. 3(a)]. At pH 6.0, lead exists as Pb2+ and L-Cyst-Fe3O4 NPs surfaces possess a negative charge [zeta potential: −14.69 mV] as shown in Fig. S7 (Supplementary Information). Thus, adsorbent-adsorbate electrostatic interactions take place45. L-Cyst-Fe3O4 NPs exhibit high removal at pH > 2. With pH rise, carboxylate group density increase at NPs interface and in the dispersion medium25, 27, 28. Pb2+ adsorption is less at low pH [Fig. S7 (Supplementary Information)]. This is because in acidic medium, the carboxylate and amine groups on L-Cyst gets protonated and act as cation [Fig. S7 (Supplementary Information)]. As a result, L-Cyst-Fe3O4 surface has a net positive charge and there is repulsion of ions. This lowers the overall adsorption capacity. Pb (OH) 2 precipitation starts after pH 6.040, 46.
Figure 3.
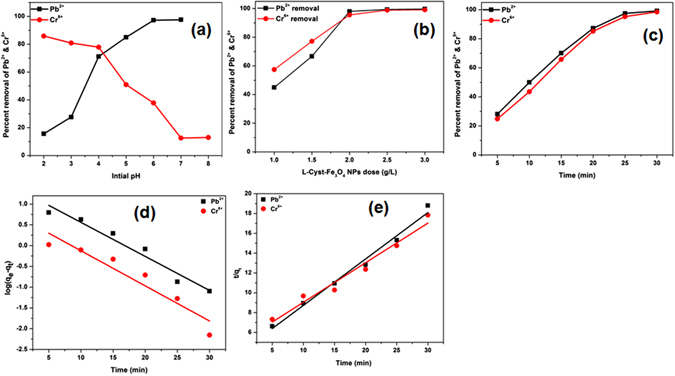
Pb2+ and Cr6+ curves obtained at different (a) initial pH; (b) L-Cyst-Fe3O4 NPs dose; (c) Effect of contact time; (d) Pseudo-first-order and (e) pseudo-second-order kinetic plots.
The Cr6+ removal efficiency of L-Cyst-Fe3O4 NPs decreased after pH > 3.0 [Fig. 3(a)]. Therefore, pH 3.0 was considered as an optimum pH for further Cr6+ adsorption studies. Chromium exists as HCrO4 − and Cr2O7 2− and L-Cyst-Fe3O4 NPs are positively charged at an aqueous pH < 3.027, 40, 46 [Fig. S7 (Supplementary Information)]. Therefore, there is an electrostatic attraction between negatively charged ions (HCrO4 − and Cr2O7 2−) and L-Cyst-Fe3O4 NPs (L-Cyst-Fe3O4 pHpzc = 5.7). However at pH > 3, removal efficiency decreases. At pH > 3.0, repulsion between L-Cyst-Fe3O4 NPs and chromate ions takes place which results into decrease in adsorption capacity [Fig. 3(a)]. The possible binding mechanisms of Pb2+ and Cr6+ onto L-Cyst-Fe3O4 NPs are shown in Fig. 4(a,b).
Figure 4.
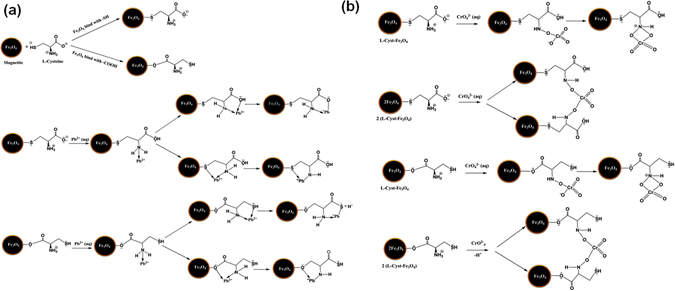
The binding mechanism of (a) Pb2+ and (b) Cr6+ ions onto L-Cyst-Fe3O4 NPs.
Effect of L-Cyst-Fe3O4 NPs Dose
The effect of L-Cyst-Fe3O4 NPs dose on Pb2+ and Cr6+ uptake is shown in Fig. 3(b). Pb2+ and Cr6+ sorption experiments were conducted using 50 mL Pb2+ or Cr6+ solution (50 mg/L) and L-Cyst-Fe3O4 NPs (dosage: 1.0, 1.5, 2.0, 2.5 and 3.0 g/L) at optimal conditions [temperature: 25 °C, agitation speed: 200 rpm, equilibrium time: 60 min]. Pb2+ and Cr6+ removal increased considerably on increasing the dose (from 1.0 to 3.0 g/L) due to increase in the number of sorption sites40, 46, 47. Pb2+ removal increased from 45% to 99% on increasing dose from 1.0 to 2.0 g/L. No further Pb2+ uptake was observed on increasing adsorbent dose to 2.5 and 3.0 g/L. Similarly, Cr6+ uptake increased from 62% to 96% on increasing dose from 1.0 to 2.0 g/L. Therefore, 2.0 g/L dose was used as optimum dose for further Pb2+ and Cr6+ adsorption.
Effect of Contact Time
Pb2+ and Cr6+ adsorption experiments were conducted at optimal conditions [pH = 3.0 for Cr6+ and 3.0 for Pb2+; adsorbent dose: 2.0 g/L, adsorbate: 50 mg/L, temperature: 25 °C, agitation speed: 200 rpm, equilibrium time: 60 min] and different contact time (5, 10, 15, 20, 25, 30 min). Pb2+ and Cr6+ removal increased with increase in contact time (from 5 to 30 min) [Fig. 3(c)]. Almost complete Cr6+ and Pb2+ removal occurred in 25 min. No further uptake was recorded after 30 min. The removal rate was initially high and slowed down as the equilibrium approached.
Cr6+ and Pb2+ Sorption Dynamics
Cr6+ and Pb2+ adsorption kinetics were fitted to pseudo-first-order47 and pseudo-second-order48, 49 rate equations (eqs 5 and 6).
| 5 |
| 6 |
Here, k1 and k2 (min−1) are the first-order and second-order adsorption rate constants, qe is the amount adsorbed at equilibrium, and qt is the amount of Pb2+ and Cr6+ adsorbed at time ‘t’.
Figure 3(d,e) shows the pseudo-first and second-order kinetic plots obtained for Pb2+ and Cr6+ adsorption on L-Cyst-Fe3O4 NPs. The slopes and intercepts as calculated from the plots were used to determine the regression coefficient (R2) and kinetic rate constants (k1 and k2) [eqs 5 and 6]. The kinetic parameters obtained are summarized in Table 1. Pb2+ and Cr6+ adsorption data well fitted to pseudo-second order equation [R2 > 0.985 (Pb2+); 0.961 (Cr6+)]. Thus, chemisorption is the rate determining step for Cr6+ and Pb2+ adsorption on L-Cyst-Fe3O4 NPs. Similar observations were reported earlier for Pb2+ and Cr6+ adsorption on magnetite nanospheres and magnetite nanoparticles40, 46.
Table 1.
Pseudo-first and second-order rate constants and correlation coefficients obtained for Cr6+ and Pb2+ adsorption on L-Cyst-Fe3O4 NPs.
| Metals | Pseudo-first-order rate constants | Pseudo-second-order rate constants | ||
|---|---|---|---|---|
| k1 | R2 | k2 | R2 | |
| Pb2+ | 0.08 | 0.9478 | 0.47 | 0.9850 |
| Cr6+ | 0.08 | 0.8930 | 0.40 | 0.9611 |
Cr6+ and Pb2+ Sorption Equilibrium Studies
Sorption isotherm models provide information about the adsorption mechanisms and adsorbate-adsorbent interactions. Cr6+ and Pb2+ sorption equilibrium data were fitted to the Langmuir and Freundlich equations. The Langmuir isotherm assumes that the adsorption process takes place on monolayer adsorbent surfaces with uniform energy50, 51, while Freundlich isotherm assumes that the adsorption process occurs on multilayer surfaces with non-uniform distribution of energy52, 53. The linear form of Langmuir and Freundlich isotherms are given by eqs 7 and 8, respectively.
| 7 |
| 8 |
Where, b (L/mg) is the Langmuir adsorption constant and qmax (mg/g) is the monolayer adsorption capacity of the adsorbent. KF and 1/n are Freundlich constants which correspond to adsorption capacity and adsorption intensity, respectively. All the Freundlich and Langmuir constants are given in Table 2. The Langmuir separation factor (RL) (eq. 9) can also be used to predict the affinity between the adsorbate and adsorbent.
| 9 |
Where b is the Langmuir constant and Ci is the initial concentration. The value of RL tells the type of isotherm to be irreversible (RL = 0), linear (RL = 1), unfavorable (RL > 1), or favorable (0 < RL < 1)48. RL values between 0 and 1 indicate favorable Pb2+ and Cr6+ adsorption on L-Cyst Fe3O4 NPs [Fig. S8(a,b)] .
Table 2.
Langmuir and Freundlich isotherm parameters obtained for Cr6+ and Pb2+ adsorption on L-Cyst-Fe3O4 NPs.
| Isotherm constants | Pb2+ | Cr6+ | ||||
|---|---|---|---|---|---|---|
| 25 °C | 35 °C | 45 °C | 25 °C | 35 °C | 45 °C | |
| Langmuir | ||||||
| qmax (mg/g) | 7.00 | 11.60 | 18.80 | 11.66 | 23.48 | 34.48 |
| b (L/mg) | 14.26 | 8.72 | 5.45 | 8.79 | 5.23 | 4.14 |
| R2 | 0.956 | 0.987 | 0.991 | 0.971 | 0.984 | 0.986 |
| Freundlich | ||||||
| KF (mg/g) | 19.16 | 23.88 | 31.19 | 25.98 | 30.27 | 41.05 |
| n | 3.07 | 3.22 | 3.74 | 1.44 | 3.03 | 3.41 |
| R2 | 0.982 | 0.995 | 0.990 | 0.994 | 0.966 | 0.914 |
The linear plots of both Langmuir and Freundlich isotherm model of Pb2+and Cr6+ adsorption are shown in Fig. 5(a–d). The Langmuir adsorption equilibrium constants of Pb2+ and Cr6+ were obtained from linear plots between Ce/qe and Ce [eq. 7] [Fig. 5(a,b)]. The Freundlich equilibrium constants were determined from the plot of ln qe versus ln Ce [eq. 8] [Fig. 5(c,d)]. The Pb2+ and Cr6+ uptake increased with temperature rise from 25 °C to 45 °C indicating the endothermic nature of adsorption. The adsorption constants and correlation coefficients (R2) of Langmuir and Freundlich models are given in Table 2. The Langmuir equation best fitted the data obtained for Pb2+ and Cr6+ adsorption onto L-Cyst-Fe3O4 NPs [Table 2], thereby indicating a monolayer adsorption of Pb2+ and Cr6+. A maximum adsorption capacity (qe) of L-Cyst-Fe3O4 NPs was 18.78 mg/g (for Pb2+) and 34.48 mg/g (for Cr6+).
Figure 5.
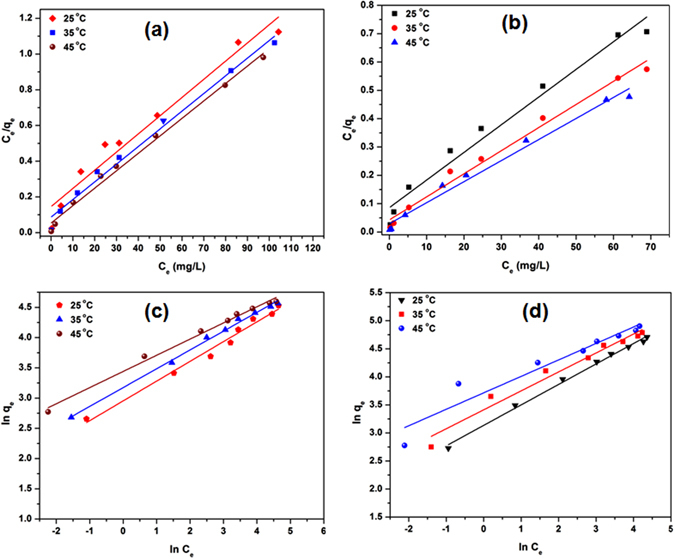
Langmuir isotherm plots for (a) Pb2+ and (b) Cr6+ adsorption; Freundlich isotherm plots for (c) Pb2+ and (d) Cr6+ adsorption.
Adsorption Thermodynamics.
The Gibbs free energy of adsorption [ΔG° (kJ/mol)], the enthalpy change [ΔH° (kJ/mol)], and the entropy change [ΔS° (kJ/(mol K))] were determined using eqs 10, 11, 12, and 13 54, 55.
| 10 |
Considering that ΔH does not change much with change in temperature over the temperature range of study, the integration of (eq. 10) results into:
| 11 |
Where, K is the thermodynamic equilibrium constant, ΔH° is the standard molar sorption enthalpy at temperature T, R is the universal gas constant (8.314 J/mol K), C is integration constant and T is the absolute temperature (K). The values of K were determined by plotting ln (qe/Ce) against qe [Fig. 6(a,b)], where qe is the amount of Pb2+ and Cr6+ adsorbed and Ce is the Pb2+ and Cr6+ equilibrium concentrations. The plot of ln K against 1/T [Fig. 6(c,d)] theoretically yields a straight line allowing calculation of ∆H° and ∆S° from the respective slope (equal to −ΔH°/R) and intercept (equal to ΔS°/R) of eq. 12.
Figure 6.
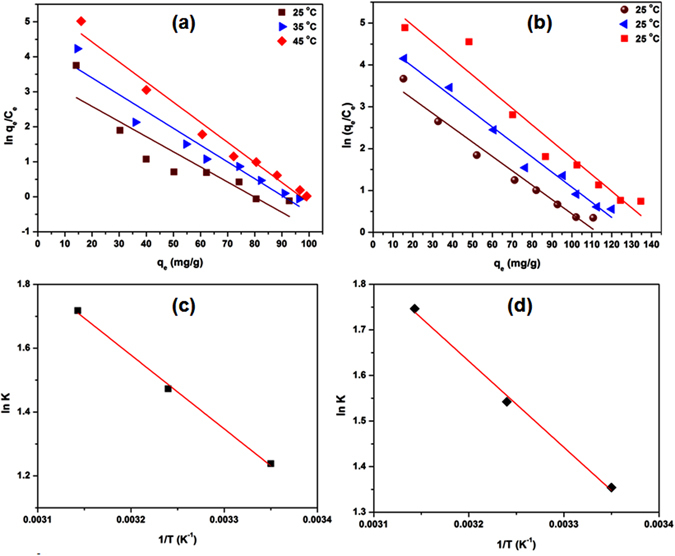
(a) ln (qe/Ce) against qe plots at different temperatures (25, 35 and 45 °C) for Pb2+; (b) Cr6+ adsorption and (c) Van’t Hoff plot for Pb2+; (d) Van’t Hoff plot for Cr6+ adsorption.
| 12 |
The value of standard Gibbs free energy (ΔG°) was calculated using eq. 13.
| 13 |
Where, R is the universal constant (8.314 J/mol K) and T is the absolute temperature (K).
The values of the thermodynamic parameters are given in Table 3. ΔH° and ΔS° were positive and ΔG° was negative in all systems. The positive values of ΔH° [83.7 KJ mol−1 (for Pb2+); 73.31 KJ mol−1 (for Cr6+)] indicated an endothermic nature of adsorption process55. Further, the positive ΔS° values [0.31 (for Pb2+); 0.28 (for Cr6+)] revealed the increased randomness at solid/solution interface50, 55, 56. The ΔG° values decreased with rise in temperature. The negative values of ΔG° [−8.55 (T = 25 °C), −11.17 (T = 35 °C), −14.7 (T = 45 °C) for Pb2+; −9.60 (T = 25 °C), −11.98 (T = 35 °C), −15.16 (T = 45 °C) for Cr6+] indicated that sorption was spontaneous and thermodynamically favorable.
Table 3.
Thermodynamic parameters for Pb2+ and Cr6+ adsorption onto L-Cyst-Fe3O4 NPs.
| Adsorbate | ΔH° (kJ/mol) | ΔS° [kJ/(mol K)] | T (K) | K (L g−1) | ΔG° (kJ/mol) |
|---|---|---|---|---|---|
| Pb2+ | 83.7 | 0.31 | 298.15 | 3.448 | −8.55 |
| 308.15 | 4.360 | −11.17 | |||
| 318.15 | 5.571 | −14.7 | |||
| Cr6+ | 73.31 | 0.28 | 298.15 | 3.873 | −9.60 |
| 308.15 | 4.675 | −11.98 | |||
| 318.15 | 5.733 | −15.16 |
Characterization of Pb2+ and Cr6+ loaded L-Cyst-Fe3O4 NPs
Pb2+ and Cr6+ uptake onto L-Cyst-Fe3O4 NPs was further confirmed by carrying out FT-IR, SEM-EDX and SEM mapping studies of Pb2+ and Cr6+ loaded L-Cyst-Fe3O4 NPs. About 0.5 g/L of L-Cyst-Fe3O4 NPs were agitated with in 50 mg/L Pb2+ (pH 5.0) and Cr6+ (pH 3.0) solution at optimal conditions (temperature: 25 °C, agitation speed: 200 rpm; equilibrium time: 60 min). The suspension was filtered using Whatman filter paper no. 42 and the residue was dried in an oven for 50 °C over night.
FTIR studies
The FTIR spectra of bare Fe3O4, commercial L-Cyst, L-Cyst-Fe3O4 NPs, Pb2+ and Cr6+ loaded L-Cyst-Fe3O4 NPs were obtained in the range of 400–4000 cm−1 [Fig. 7A(a–e)]. The sharp band of magnetite appeared at 568 cm−1 and became less intense at 602 cm−1 57. A strong band at 568 cm−1 is a characteristic of Fe-O absorption due to its symmetric stretching vibration27. Sharp peaks at 1640 and 3437 cm−1 were attributed to O-H stretching and bending vibrational bands of water moiety adsorbed on magnetite surface [curve (a)]. A strong peak at 2351 cm−1 attributes to carbon dioxide (ѵ CO2)55, 57, 58. A curve (b) shows FT-IR spectrum of commercial L-Cyst. This curve exhibits its characteristic bands at 1602 and 1390 cm−1 due to the asymmetric and symmetric stretching of COO− 27. The band at 1586 cm−1 corresponds to N–H bending. A sharp peak of NH3 + stretch is observed between 2982–3182 and 3747 cm−1. A weak band at 2550–2362 cm−1 is due to the presence of S–H group59. However, after the functionalization of L-Cyst onto the surface of magnetite NPs, some new peaks emerged at 1624, 1590 and 1406 cm−1 corresponding to asymmetric and symmetric stretching of COO− and -NH2. Amide band indicates the successful functionalization of L-Cyst molecules onto magnetite surface. In addition, the sharp peak at 2069 cm−1 disappeared [curve (c)], implying the formation of the covalent bond between Fe and S. Similar observations were reported earlier for L-Cyst capped Fe3O4 NPs21, 27.
Figure 7.
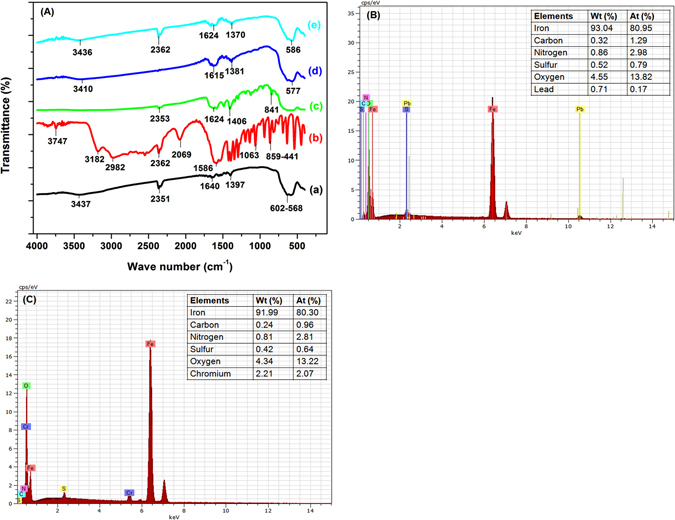
(A) FTIR spectra of (a) Fe3O4, (b) commercial L-Cyst, (c) L-Cyst-Fe3O4, (d) Pb2+ loaded L-Cyst-Fe3O4 and (e) Cr6+ loaded L-Cyst-Fe3O4; (B) EDX spectra of Pb2+ loaded L-Cyst-Fe3O4 NPs and (C) Cr6+ loaded L-Cyst-Fe3O4 NPs.
However, after Pb2+ and Cr6+ uptake on L-Cyst-Fe3O4 NPs, some shifting in the peaks between 1624 and 1401 cm−1 (corresponding to asymmetric and symmetric stretching of COO− and -NH2, respectively) were observed. A sharp peak at 1509 disappeared [curve (d, e)]. This could be probably due to binding of Pb2+ and Cr6+ with COO− and -NH2 groups. The peaks between 3410 to 3416 cm−1 weakens after Pb2+ and Cr6+ uptake. It may be due to surface precipitation of lead hydroxide and chromium hydroxide that decreased the intensity of O–H stretching frequencies46.
SEM-EDX and mapping
Figure 7(B,C) shows the SEM-EDX spectra of Pb2+ and Cr6+ loaded NPs. Inset Tables in Fig. 7(B,C) summarizes intense EDX peaks of lead and chromium, which clearly confirmed the adsorption of Pb2+ and Cr6+ on L-Cyst-Fe3O4 NPs surfaces.
SEM mapping micrographs of L-Cyst-Fe3O4 NPs before and after uptake of Pb2+ and Cr6+ are shown in Fig. 8(a–d). The elemental distribution specifies iron in red, oxygen in fluorescent green, carbon in blue, nitrogen in cyan and sulfur in dark greens [Fig. 8(a,c)]. The elemental mapping also confirmed the Pb2+ uptake (in yellow) [Fig. 8(b)] and Cr6+ (in cyan) [Fig. 8(d)]. It is clear, Pb2+ and Cr6+ ions are uniformly distributed on L-Cyst-Fe3O4 NPs surfaces [Fig. 8(b,d)].
Figure 8.
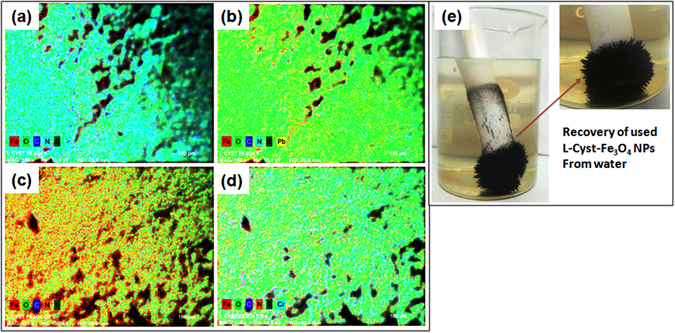
SEM elemental mapping images of (a,c) L-Cyst-Fe3O4 NPs; (b) Pb2+ loaded L-Cyst-Fe3O4 NPs (Lead in yellow); (d) Cr6+ loaded L-Cyst-Fe3O4 NPs (Chromium in cyan color) and (e) Demonstration of exhausted L-Cyst-Fe3O4 NPs separation from aqueous system.
Recovery of exhausted L-Cyst-Fe3O4 NPs from aqueous system using a simple magnet is demonstrated in Fig. 8(e). The NPs were readily attracted to the magnet. Therefore, the NPs can easily be recovered using a magnet rather traditional filtration.
Table S2 (Supplementary Information) shows the comparative adsorption capacities of L-Cyst-Fe3O4 NPs for Pb2+ and Cr6+ removal versus other nanosorbents40, 60–68. The L-Cyst-Fe3O4 NPs adsorption capacity is comparable to other similar adsorbents and can replace the costly commercial adsorbents.
Regeneration and Stability of L-Cyst-Fe3O4 NPs
The efficiency of NPs was investigated for multiple adsorptions-desorption cycles. Briefly, 3.0 g/L NPs were agitated with 50 mg/L Pb2+ or Cr6+ solution (40 mL) for 15 minutes. Equilibrium concentration was measured and the spent NPs were desorbed using 0.01 M NaOH or HNO3. The desorbed NPs were dried and reused for another adsorption cycle (Pb2+ and Cr6+ separately). This adsorption-desorption procedure was repeated five times [Fig. 9(a,b)]. The adsorption yield decreased in every cycle. Lead adsorption yield was 83% in first cycle that reduced to 37% in fifth cycle [Fig. 9(a)]. However, chromium removal yield was slight better. It was 22% in the first cycle that reduced to 15% in the fifth cycle [Fig. 9(b)].
Figure 9.
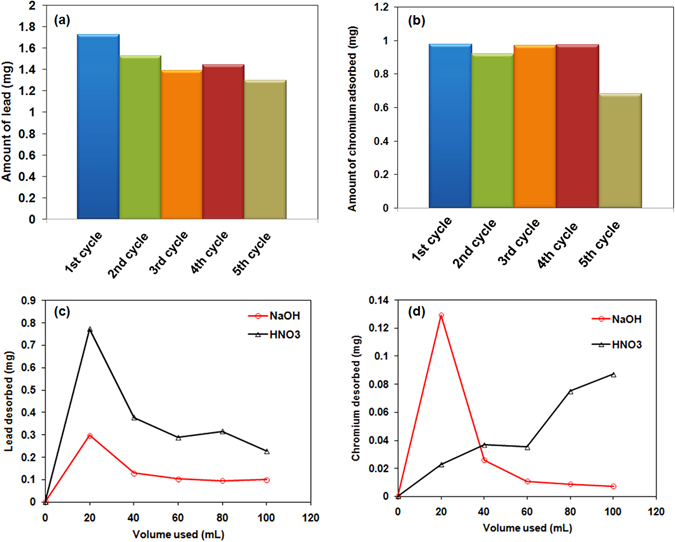
Adsorption cycles of (a) lead and (b) chromium of the L-Cyst-Fe3O4 NPs at 25 °C [adsorbate conc. = 50 mg/L; adsorbent conc. = 3.0 g/L]; desorption cycles of (c) lead and (d) chromium of the L-Cyst-Fe3O4 NPs at 25 °C [adsorbate conc. = 50 mg/L; adsorbent conc. = 3.0 g/L; desorption agent: 20 mL of 0.01 M HNO3 and NaOH].
Almost 40% of the total desorption was achieved in first 20 mL HNO3 or NaOH for lead [Fig. 9(c)]. Lead desorption was favorable using an acidic eluent because at low pH, there is a competition between H+ ions and metal ions as demonstrated in Fig. 4(a) where the surface FeO− react with H+ or Pb2+. A 46% and 71% of total chromium desorption was achieved using first 20 mL HNO3 and NaOH, respectively [Fig. 9(d)]. Thus, magnetite nanoparticles can be regenerated and reused for Cr6+ and Pb2+ removal and recovery.
Furthermore, TEM studies were also performed to check the stability and morphology of spent nanosorbents after five successive adsorption-desorption cycles. Figure S9(b,c) (Supplementary Information) shows the TEM images of regenerated L-Cyst-Fe3O4 NPs retained almost the original morphology after adsorption-desorption cycles. These results suggest that L-Cyst-Fe3O4 NPs has good reusability and stability properties.
Conclusions
Highly stable L-Cyst functionalized magnetite NPs were successfully synthesized by co-precipitation. L-Cyst effectively prevents magnetite NPs from oxidation, aggregation and also increased its biocompatibility. SEM, energy band gap, zeta potential, and hydrodynamic size studies confirmed the successful impregnation of L-Cyst onto magnetite NPs surface. The absence of NH3 + vibrational peak and shifting of IR bands implied the successful L-Cyst functionalization onto magnetite surface as well as Pb2+ and Cr6+ loading. L-Cyst interacts with the NPs via its thiol group and heavy metals via its amino and carboxyl groups. SEM-EDX and SEM mapping images confirmed successful adsorption of Pb2+ and Cr6+ onto L-Cyst-Fe3O4 NPs. Sorption equilibrium was reached within 25 min at 25 °C. Langmuir equation best described the sorption equilibrium data. Langmuir adsorption capacities of 34.5 and 18.8 mg g−1 were obtained for Cr6+ and Pb2+, respectively. Sorption dynamics data were best described using pseudo-second-order rate equation. Maximum Pb2+ and Cr6+ removal was achieved at pH 6.0 and 2.0, respectively. Thermodynamic studies illustrated that Cr6+ and Pb2+ adsorption is endothermic in nature. The manipulation of exhausted L-Cyst-Fe3O4 NPs from aqueous media was also demonstrated. L-Cyst-Fe3O4 NPs stability and reusability were also investigated. L-Cyst-Fe3O4 NPs can be considered as fast, efficient, and biocompatible nano-adsorbent for Cr6+ and Pb2+ removal from contaminated waters.
Electronic supplementary material
Acknowledgements
Yana Bagbi is thankful to the UGC for the financial support through MNF-JRF. We are grateful to Advanced Instrumentation Research Facility, Jawaharlal Nehru University (JNU), New Delhi for providing the facilities of HRTEM, SEM, and FT-IR. The authors are also thankful to the School of Physical Sciences, Jawaharlal Nehru University, New Delhi for providing the XRD facility. This work was supported by DST-PURSE grant received from Department of Science and Technology, Government of India and UGC (UPE-II; Projects 58 and 189) granted by University Grants Commission, New Delhi, India. P.R. Solanki thanks to Jawaharlal Nehru University, New Delhi, India for providing funds for publication charges of this article.
Author Contributions
Y. Bagbi, P.R. Solanki, A. Sarswat and D. Mohan participated in the experiment design. Y. Bagbi and A. Sarswat performed and analyzed the AAS experiments. All of the authors (Y. Bagbi, A. Sarswat, D. Mohan, A. Pandey and P.R. Solanki) reviewed the manuscript and participated in discussions on the results of this research.
Competing Interests
The authors declare that they have no competing interests.
Footnotes
Electronic supplementary material
Supplementary information accompanies this paper at doi:10.1038/s41598-017-03380-x
Publisher's note: Springer Nature remains neutral with regard to jurisdictional claims in published maps and institutional affiliations.
References
- 1.Tchounwou, P. B., Yedjou, C. G., Patlolla, A. K. & Sutton, D. J. Heavy Metal Toxicity and the Environment. Molecular, Clinical and Environmental Toxicology 133–164 (Springer 2012). [DOI] [PMC free article] [PubMed]
- 2.Bradl, H. Heavy metals in the environment: origin, interaction and remediation. Vol. 6 (Academic Press 2005).
- 3.He ZL, Yang XE, Stoffella PJ. Trace elements in agroecosystems and impacts on the environment. Journal of Trace Elements in Medicine and Biology. 2005;19:125–140. doi: 10.1016/j.jtemb.2005.02.010. [DOI] [PubMed] [Google Scholar]
- 4.Jalali R, Ghafourian H, Asef Y, Davarpanah S, Sepehr S. Removal and recovery of lead using nonliving biomass of marine algae. Journal of Hazardous Materials. 2002;92:253–262. doi: 10.1016/S0304-3894(02)00021-3. [DOI] [PubMed] [Google Scholar]
- 5.Iqbal M, Edyvean R. Biosorption of lead, copper and zinc ions on loofa sponge immobilized biomass of Phanerochaete chrysosporium. Minerals Engineering. 2004;17:217–223. doi: 10.1016/j.mineng.2003.08.014. [DOI] [Google Scholar]
- 6.Sekhar KC, et al. Removal of lead from aqueous solutions using an immobilized biomaterial derived from a plant biomass. Journal of Hazardous Materials. 2004;108:111–117. doi: 10.1016/j.jhazmat.2004.01.013. [DOI] [PubMed] [Google Scholar]
- 7.Atsdr, U. Toxicological profile for lead (Atlanta, GA: US Department of Health and Human Services, Agency for Toxic Substances and Disease Registry (ATSDR), Public Health Service). US EPA (2006) Air quality criteria for lead (2007).
- 8.Järup L. Hazards of heavy metal contamination. British medical bulletin. 2003;68:167–182. doi: 10.1093/bmb/ldg032. [DOI] [PubMed] [Google Scholar]
- 9.World Health Organization. Guidelines for drinking-water quality - 4th edition; ISBN 978924 1548151 published by WHO, Switzerland (2011).
- 10.Hayes RB. The carcinogenicity of metals in humans. Cancer Causes & Control. 1997;8:371–385. doi: 10.1023/A:1018457305212. [DOI] [PubMed] [Google Scholar]
- 11.Walsh FC, Reade GW. Electrochemical techniques for the treatment of dilute metal-ion solutions. Studies in Environmental Science. 1994;59:3–44. doi: 10.1016/S0166-1116(08)70546-6. [DOI] [Google Scholar]
- 12.Bodalo-Santoyo A, Gómez-Carrasco J, Gomez-Gomez E, Maximo-Martin F, Hidalgo-Montesinos A. Application of reverse osmosis to reduce pollutants present in industrial wastewater. Desalination. 2003;155:101–108. doi: 10.1016/S0011-9164(03)00287-X. [DOI] [Google Scholar]
- 13.Ersahin ME, et al. A review on dynamic membrane filtration: materials, applications and future perspectives. Bioresource Technology. 2012;122:196–206. doi: 10.1016/j.biortech.2012.03.086. [DOI] [PubMed] [Google Scholar]
- 14.Xing Y, Chen X, Wang D. Electrically regenerated ion exchange for removal and recovery of Cr (VI) from wastewater. Environmental Science & Technology. 2007;41:1439–1443. doi: 10.1021/es061499l. [DOI] [PubMed] [Google Scholar]
- 15.Bailey SE, Olin TJ, Bricka RM, Adrian DD. A review of potentially low-cost sorbents for heavy metals. Water Research. 1999;33:2469–2479. doi: 10.1016/S0043-1354(98)00475-8. [DOI] [Google Scholar]
- 16.Oubagaranadin JUK, Murthy Z. Adsorption of divalent lead on a montmorillonite– illite type of clay. Industrial & Engineering Chemistry Research. 2009;48:10627–10636. doi: 10.1021/ie9005047. [DOI] [Google Scholar]
- 17.Wang X, Zheng Y, Wang A. Fast removal of copper ions from aqueous solution by chitosan-g-poly (acrylic acid)/attapulgite composites. Journal of Hazardous Materials. 2009;168:970–977. doi: 10.1016/j.jhazmat.2009.02.120. [DOI] [PubMed] [Google Scholar]
- 18.Xu P, et al. Use of iron oxide nanomaterials in wastewater treatment: a review. Science of the Total Environment. 2012;424:1–10. doi: 10.1016/j.scitotenv.2012.02.023. [DOI] [PubMed] [Google Scholar]
- 19.Kharisov BI, et al. Iron-containing nanomaterials: synthesis, properties, and environmental applications. RSC Advances. 2012;2:9325–9358. doi: 10.1039/c2ra20812a. [DOI] [Google Scholar]
- 20.Maity D, Agrawal D. Synthesis of iron oxide nanoparticles under oxidizing environment and their stabilization in aqueous and non-aqueous media. Journal of Magnetism and Magnetic Materials. 2007;308:46–55. doi: 10.1016/j.jmmm.2006.05.001. [DOI] [Google Scholar]
- 21.Xin X, et al. Highly efficient removal of heavy metal ions by amine-functionalized mesoporous Fe3O4 nanoparticles. Chemical Engineering Journal. 2012;184:132–140. doi: 10.1016/j.cej.2012.01.016. [DOI] [Google Scholar]
- 22.Odio O, Lartundo-Rojas L, Santiago-Jacinto P, Martínez R, Reguera E. Sorption of gold by naked and thiol-capped magnetite nanoparticles: an XPS approach. The Journal of Physical Chemistry C. 2014;118:2776–2791. doi: 10.1021/jp409653t. [DOI] [Google Scholar]
- 23.Zhu B, et al. Naphthalimide-functionalized Fe3O4@ SiO2 core/shell nanoparticles for selective and sensitive adsorption and detection of Hg2+ Chemical Engineering Journal. 2013;219:411–418. doi: 10.1016/j.cej.2012.12.068. [DOI] [Google Scholar]
- 24.Madrakian T, Afkhami A, Ahmadi M. Simple in situ functionalizing magnetite nanoparticles by reactive blue-19 and their application to the effective removal of Pb 2+ ions from water samples. Chemosphere. 2013;90:542–547. doi: 10.1016/j.chemosphere.2012.08.025. [DOI] [PubMed] [Google Scholar]
- 25.Giles NM, et al. Metal and redox modulation of cysteine protein function. Chemistry & Biology. 2003;10:677–693. doi: 10.1016/S1074-5521(03)00174-1. [DOI] [PubMed] [Google Scholar]
- 26.Thomas, J. A., Mallis, R. & Sies, H. Protein S-thiolation, S-nitrosylation, and irreversible sulfhydryl oxidation: roles in redox regulation. Cellular Implications of Redox Signaling. Imperial College Press, London 141–174 (2003).
- 27.Sangeetha J, Philip J. Synthesis, characterization and antimicrobial property of Fe 3 O 4-Cys-HNQ nanocomplex, with l-cysteine molecule as a linker. RSC Advances. 2013;3:8047–8057. doi: 10.1039/c3ra00005b. [DOI] [Google Scholar]
- 28.Harman LS, Mottley C, Mason RP. Free radical metabolites of L-cysteine oxidation. Journal of Biological Chemistry. 1984;259:5606–5611. [PubMed] [Google Scholar]
- 29.Coutinho HDM, Lôbo KM, Bezerra DAC, Lôbo I. Peptides and proteins with antimicrobial activity. Indian Journal of Pharmacology. 2008;40:3–9. doi: 10.4103/0253-7613.40481. [DOI] [PMC free article] [PubMed] [Google Scholar]
- 30.Caldeira E, Piskin E, Granadeiro L, Silva F, Gouveia IC. Biofunctionalization of cellulosic fibres with l-cysteine: Assessment of antibacterial properties and mechanism of action against Staphylococcus aureus and Klebsiella pneumoniae. Journal of Biotechnology. 2013;168:426–435. doi: 10.1016/j.jbiotec.2013.10.021. [DOI] [PubMed] [Google Scholar]
- 31.Berne, B. J. & Pecora, R. Dynamic light scattering: with applications to chemistry, biology, and physics. (Courier Corporation 1976).
- 32.Bagbi Y, Sharma A, Bohidar H, Solanki PR. Immunosensor based on nanocomposite of nanostructured zirconium oxide and gelatin-A. International Journal of Biological Macromolecules. 2016;82:480–487. doi: 10.1016/j.ijbiomac.2015.10.074. [DOI] [PubMed] [Google Scholar]
- 33.Bagbi Y, et al. L-cysteine stabilized Zero valent iron nanoparticle and their application for remediation of lead ions from water. Environmental Nanotechnology, Monitoring & Management. 2017;7:34–45. doi: 10.1016/j.enmm.2016.11.008. [DOI] [Google Scholar]
- 34.Gilbert B, Frandsen C, Maxey E, Sherman D. Band-gap measurements of bulk and nanoscale hematite by soft X-ray spectroscopy. Physical Review B. 2009;79:035108. doi: 10.1103/PhysRevB.79.035108. [DOI] [Google Scholar]
- 35.Park J, Kim S, Choi S, Lee H. Optical Properties of Transition-metal Oxides of MnO and Fe0. 925O Crystals Studied with Spectroscopic Ellipsometry and Raman Spectroscopy. New Physics. 2013;63:818–825. [Google Scholar]
- 36.Sayed, F. N. & Polshettiwar, V. Facile and sustainable synthesis of shaped iron oxide nanoparticles: effect of iron precursor salts on the shapes of iron oxides. Scientific Reports5 (2015). [DOI] [PMC free article] [PubMed]
- 37.Hu, F. et al. Smart liquid SERS substrates based on Fe3O4/Au nanoparticles with reversibly tunable enhancement factor for practical quantitative detection. Scientific Reports4 (2014). [DOI] [PMC free article] [PubMed]
- 38.Wen X, Wang S, Ding Y, Wang ZL, Yang S. Controlled growth of large-area, uniform, vertically aligned arrays of α-Fe2O3 nanobelts and nanowires. The Journal of Physical Chemistry B. 2005;109:215–220. doi: 10.1021/jp0461448. [DOI] [PubMed] [Google Scholar]
- 39.Cohen H, Gedanken A, Zhong Z. One-step synthesis and characterization of ultrastable and amorphous Fe3O4 colloids capped with cysteine molecules. The Journal of Physical Chemistry C. 2008;112:15429–15438. doi: 10.1021/jp805090y. [DOI] [Google Scholar]
- 40.Kumari M, Pittman CU, Mohan D. Heavy metals [chromium (VI) and lead (II)] removal from water using mesoporous magnetite (Fe3O4) nanospheres. Journal of Colloid and Interface Science. 2015;442:120–132. doi: 10.1016/j.jcis.2014.09.012. [DOI] [PubMed] [Google Scholar]
- 41.Gong J, et al. Adsorption of heavy metal ions by hierarchically structured magnetite-carbonaceous spheres. Talanta. 2012;101:45–52. doi: 10.1016/j.talanta.2012.08.035. [DOI] [PubMed] [Google Scholar]
- 42.Mohapatra S, Pramanik P. Synthesis and stability of functionalized iron oxide nanoparticles using organophosphorus coupling agents. Colloids and Surfaces A: Physicochemical and Engineering Aspects. 2009;339:35–42. doi: 10.1016/j.colsurfa.2009.01.009. [DOI] [Google Scholar]
- 43.Ghosh S, Badruddoza A, Uddin M, Hidajat K. Adsorption of chiral aromatic amino acids onto carboxymethyl-β-cyclodextrin bonded Fe3O4/SiO2 core–shell nanoparticles. Journal of Colloid and Interface Science. 2011;354:483–492. doi: 10.1016/j.jcis.2010.11.060. [DOI] [PubMed] [Google Scholar]
- 44.Liu JF, Zhao ZS, Jiang GB. Coating Fe3O4 magnetic nanoparticles with humic acid for high efficient removal of heavy metals in water. Environmental Science & Technology. 2008;42:6949–6954. doi: 10.1021/es800924c. [DOI] [PubMed] [Google Scholar]
- 45.Schwaminger SP, et al. Nature of interactions of amino acids with bare magnetite nanoparticles. The Journal of Physical Chemistry C. 2015;119:23032–23041. doi: 10.1021/acs.jpcc.5b07195. [DOI] [Google Scholar]
- 46.Rajput S, Pittman CU, Mohan D. Magnetic magnetite (Fe3O4) nanoparticle synthesis and applications for lead (Pb2+) and chromium (Cr6+) removal from water. Journal of Colloid and Interface Science. 2016;468:334–346. doi: 10.1016/j.jcis.2015.12.008. [DOI] [PubMed] [Google Scholar]
- 47.Esfahani AR, Firouzi AF, Sayyad G, Kiasat A. Lead Removal from Aqueous Solutions Using Polyacrylicacid-Stabilized Zero-Valent Iron Nanoparticles. Research Journal of Environmental and Earth Sciences. 2013;5:548–555. [Google Scholar]
- 48.Lagergren, S. der Sogenannten Adsorption Geloster Stoffe. Kungliga Svenska Vetenska Psalka de Miens Handlingar 24, 1 (1898).
- 49.Ho Y, Wase DJ, Forster C. Kinetic studies of competitive heavy metal adsorption by sphagnum moss peat. Environmental Technology. 1996;17:71–77. doi: 10.1080/09593331708616362. [DOI] [Google Scholar]
- 50.Hao Y-M, Man C, Hu Z-B. Effective removal of Cu (II) ions from aqueous solution by amino-functionalized magnetic nanoparticles. Journal of Hazardous Materials. 2010;184:392–399. doi: 10.1016/j.jhazmat.2010.08.048. [DOI] [PubMed] [Google Scholar]
- 51.Langmuir I. The constitution and fundamental properties of solids and liquids. part I. solids. Journal of the American Chemical Society. 1916;38:2221–2295. doi: 10.1021/ja02268a002. [DOI] [Google Scholar]
- 52.Gupta VK, Rastogi A, Nayak A. Biosorption of nickel onto treated alga (Oedogonium hatei): application of isotherm and kinetic models. Journal of Colloid and Interface Science. 2010;342:533–539. doi: 10.1016/j.jcis.2009.10.074. [DOI] [PubMed] [Google Scholar]
- 53.Amin NK. Removal of reactive dye from aqueous solutions by adsorption onto activated carbons prepared from sugarcane bagasse pith. Desalination. 2008;223:152–161. doi: 10.1016/j.desal.2007.01.203. [DOI] [Google Scholar]
- 54.Yao ZY, Qi JH, Wang LH. Equilibrium, kinetic and thermodynamic studies on the biosorption of Cu (II) onto chestnut shell. Journal of Hazardous Materials. 2010;174:137–143. doi: 10.1016/j.jhazmat.2009.09.027. [DOI] [PubMed] [Google Scholar]
- 55.Xu P, et al. Adsorption of Pb (II) by iron oxide nanoparticles immobilized Phanerochaete chrysosporium: equilibrium, kinetic, thermodynamic and mechanisms analysis. Chemical Engineering Journal. 2012;203:423–431. doi: 10.1016/j.cej.2012.07.048. [DOI] [Google Scholar]
- 56.Sheela T, Nayaka YA. Kinetics and thermodynamics of cadmium and lead ions adsorption on NiO nanoparticles. Chemical Engineering Journal. 2012;191:123–131. doi: 10.1016/j.cej.2012.02.080. [DOI] [Google Scholar]
- 57.Sun S, Wang L, Wang A. Adsorption properties of crosslinked carboxymethyl-chitosan resin with Pb (II) as template ions. Journal of Hazardous Materials. 2006;136:930–937. doi: 10.1016/j.jhazmat.2006.01.033. [DOI] [PubMed] [Google Scholar]
- 58.Bagbi Y, Sarswat A, Mohan D, Pandey A, Solanki PR. Lead (Pb2+) adsorption by monodispersed magnetite nanoparticles: Surface analysis and effects of solution chemistry. Journal of Environmental Chemical Engineering. 2016;4:4237–4247. doi: 10.1016/j.jece.2016.09.026. [DOI] [Google Scholar]
- 59.Aryal S, et al. Spectroscopic identification of S Au interaction in cysteine capped gold nanoparticles. Spectrochimica Acta Part A: Molecular and Biomolecular Spectroscopy. 2006;63:160–163. doi: 10.1016/j.saa.2005.04.048. [DOI] [PubMed] [Google Scholar]
- 60.Mahdavi M, et al. Fabrication and characterization of SiO2/(3-aminopropyl) triethoxysilane-coated magnetite nanoparticles for lead (II) removal from aqueous solution. Journal of Inorganic and Organometallic Polymers and Materials. 2013;23:599–607. doi: 10.1007/s10904-013-9820-2. [DOI] [Google Scholar]
- 61.Cao CY, Cui ZM, Chen CQ, Song WG, Cai W. Ceria hollow nanospheres produced by a template-free microwave-assisted hydrothermal method for heavy metal ion removal and catalysis. The Journal of Physical Chemistry C. 2010;114:9865–9870. doi: 10.1021/jp101553x. [DOI] [Google Scholar]
- 62.Hua M, et al. Heavy metal removal from water/wastewater by nanosized metal oxides: a review. Journal of Hazardous Materials. 2012;211:317–331. doi: 10.1016/j.jhazmat.2011.10.016. [DOI] [PubMed] [Google Scholar]
- 63.Hu J, Lo IM, Chen G. Fast removal and recovery of Cr (VI) using surface-modified jacobsite (MnFe2O4) nanoparticles. Langmuir. 2005;21:11173–11179. doi: 10.1021/la051076h. [DOI] [PubMed] [Google Scholar]
- 64.Zhong LS, et al. Self‐Assembled 3D flowerlike iron oxide nanostructures and their application in water treatment. Advanced Materials. 2006;18:2426–2431. doi: 10.1002/adma.200600504. [DOI] [Google Scholar]
- 65.Huang SH, Chen DH. Rapid removal of heavy metal cations and anions from aqueous solutions by an amino-functionalized magnetic nano-adsorbent. Journal of Hazardous Materials. 2009;163:174–179. doi: 10.1016/j.jhazmat.2008.06.075. [DOI] [PubMed] [Google Scholar]
- 66.Chowdhury SR, Yanful EK. Arsenic and chromium removal by mixed magnetite–maghemite nanoparticles and the effect of phosphate on removal. Journal of Environmental Management. 2010;91:2238–2247. doi: 10.1016/j.jenvman.2010.06.003. [DOI] [PubMed] [Google Scholar]
- 67.Zhu H, et al. Biosynthesis of spherical Fe3O4/bacterial cellulose nanocomposites as adsorbents for heavy metal ions. Carbohydrate Polymers. 2011;86:1558–1564. doi: 10.1016/j.carbpol.2011.06.061. [DOI] [Google Scholar]
- 68.Ma X, Wang Y, Gao M, Xu H, Li G. A novel strategy to prepare ZnO/PbS heterostructured functional nanocomposite utilizing the surface adsorption property of ZnO nanosheets. Catalysis Today. 2010;158:459–463. doi: 10.1016/j.cattod.2010.07.013. [DOI] [Google Scholar]
Associated Data
This section collects any data citations, data availability statements, or supplementary materials included in this article.


