Abstract
Histologic assessment of kidney transplant biopsies relies on cortex rather than medulla, but for microarray studies, the proportion cortex in a biopsy is typically unknown and could affect the molecular readings. The present study aimed to develop a molecular estimate of proportion cortex in biopsies and examine its effect on molecular diagnoses. Microarrays from 26 kidney transplant biopsies divided into cortex and medulla components and processed separately showed that many of the most significant differences were in glomerular genes (e.g. NPHS2, NPHS1, CLIC5, PTPRO, PLA2R1, PLCE1, PODXL, and REN). Using NPHS2 (podocin) to estimate proportion cortex, we examined whether proportion cortex influenced molecular assessment in the molecular microscope diagnostic system. In 1190 unselected kidney transplant indication biopsies (Clinicaltrials. govNCT01299168), only 11% had <50% cortex. Molecular scores for antibody-mediated rejection, T cell–mediated rejection, and injury were independent of proportion cortex. Rejection was diagnosed in many biopsies that were mostly or all medulla. Agreement in molecular diagnoses in paired cortex/medulla samples (23/26) was similar to biological replicates (32/37). We conclude that NPHS2 expression can estimate proportion cortex; that proportion cortex has little influence on molecular diagnosis of rejection; and that, although histology cannot assess medulla, rejection does occur in medulla as well as cortex.
Introduction
Limitations in existing diagnostic methods have triggered a strong interest in molecular phenotyping of kidney transplant biopsies as a new dimension in disease understanding. We recently developed a system for translating gene expression measurements into diagnostic assessment: the molecular microscope diagnostic system (MMDx) (1). Like histology, a molecular biopsy assessment system requires consideration of the effect of sample adequacy. For example, when histologically assessing kidney transplant biopsies, an adequate specimen must have at least 10 glomeruli and 2 arteries (2), usually requiring at least 2 cores. These features and the proportion of cortex in the biopsy core are not known when using molecular phenotyping. The biopsies we have processed to date, acquired in consented studies under institutional review board approval, have usually been relatively small segments of single biopsy cores (mean 3 mm), and stabilized immediately to prevent mRNA degradation without assessing the proportion of cortex.
The present study was initiated to learn the effect of the proportion cortex on the fidelity of molecular readings, and whether rejection and injury can be assessed molecularly in medulla. This required us to develop a system for estimating proportion of cortex in a core, and to use this estimate to measure the relationship between proportion of cortex and molecular readings. We obtained a set of kidney transplant biopsies that were divided by a nephrologist (GAB) into cortex and medulla pieces before stabilization, based on visual assessment (light microscopy) of the presence of glomeruli as the indicator of cortex and medullary rays as the indicator of medulla. Our goal was to define the top transcripts distinguishing cortex from medulla, develop a molecular estimate of the proportion of cortex, and incorporate this knowledge into MMDx molecular diagnostic reports. We then looked at the relationship between estimated proportion of cortex and various molecular scores that we had previously published including T cell–mediated rejection (TCMR) (3), antibody-mediated rejection (ABMR) (4,5), all rejection (ABMR, TCMR, or mixed rejection) (6), and acute kidney injury (AKI) (7). To facilitate interpretation of MMDx readings on paired cortex–medulla samples, we also studied the reproducibility of MMDx readings in technical and biological replicates.
These biopsies were collected in the INTERCOMEX study Clinicaltrials.gov NCT01299168.
Materials and Methods
Biopsy collection and processing
The cortex–medulla comparison cohort included 26 renal allograft needle biopsies (2 partial cores each), 3 unpaired cortex, and 1 medulla samples from 26 recipients, performed for graft dysfunction and/or proteinuria within the INTERCOMEX study (www.clinicaltrials.gov, NCT01299168) between June and October 2015. Biopsies were provided within budgetary constraints and per project/ethics protocols for submission to the INTERCOMEX study. Specimens were selected if they contained sufficient material for a comprehensive evaluation of both conventional morphology and region-specific molecular gene expression patterns. Biopsies were performed under ultrasound guidance using a 16- or 18-gauge needle. Immediately after biopsy, one core was evaluated by microscopy; the approximate number of glomeruli was determined in 15 biopsies. This core was separate from those sent for routine assessment (histology, immunochemistry, and electron microscopy). The core was divided into two pieces (1–3-mm length), designated cortex and medulla by its morphological appearance including the presence of one or more glomeruli (median 2.5 glomeruli per cortical specimen, interquartile range 2.25–3, range 1–10) versus medulla showing the presence of medullary rays without glomeruli. Immediately after counting the number of glomeruli, specimens for molecular workup were suspended in RNAlater® and were immediately shipped at room temperature.
Paired cortex/medulla sample processing included RNA extraction and microarray analysis on Affymetrix GeneChip® arrays. Purified total RNA was labeled with the 3′ IVT Plus kit (Affymetrix, Santa Clara, CA) and hybridized to PrimeView microarrays (Affymetrix) according to manufacturer protocols published at www.affymetrix.com. Microarray data were preprocessed by Robust Multiarray Average.
Resulting. CEL files were processed in R, and an automated report was generated. Processing time from extraction to reporting was ≈48 h. Reports for paired cortex and medulla biopsies were signed out simultaneously, and the classifier scores and gene expression measurements compared. Completed reports with a sign-out and comments were returned to the participating center.
Biopsies divided in half without assessing proportion cortex for use as biological replicates were at least 4 mm in length, and were selected initially based on size and diagnosis from the samples in the study. The biopsy core was then cut evenly in half, and both halves were processed separately as “B1” and “B2.” Reports and sample quality data were generated for both samples, and molecular scores compared and documented.
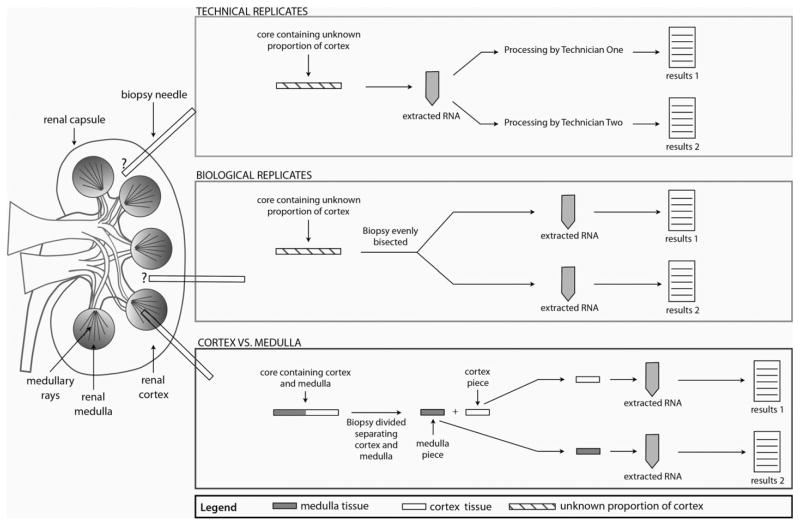
Technical replicates (Figure 1) were prepared by dividing the RNA extracted from a single biopsy into two aliquots and processing the aliquots in parallel by two technicians. Reports and sample quality data were produced for both samples.
Figure 1.
Diagram showing the sampling strategy for the technical replicate pairs, biological replicate pairs, and cortex–medulla pairs.
The details of microarray expression data will be posted on the Gene Expression Omnibus (GEO) website (http://www.ncbi.nlm.nih.gov/geo/; accession number GSE95611).
Histology assessments of biopsies
Histologic evaluation was done on formalin-fixed paraffin-embedded sections. For C4d staining, a polyclonal anti-C4d antibody (BI-RC4D; Biomedica, Vienna, Austria) was used. Rejection features were graded and scored according to the Banff 2013.
Developing a molecular estimate of proportion cortex
Proportion cortex was molecularly determined using expression of the glomerular podocyte-specific transcript NPHS2 (podocin). NPHS2 is expressed exclusively in glomerulus and thus cortex, and is not known to be regulated in disease states. Thus, NPHS2 expression is directly correlated to the proportion of cortex in a sample. A logistic regression equation was calculated based on samples submitted and microscopically determined to be either medulla or cortex, and used to calculate proportion of cortex in unknown samples. Since our main goal was to identify samples with little or no cortex, cutoffs for proportion cortex were chosen arbitrarily as 0.2 in some experiments.
MMDx assessment
The output from the microarray is expressed in terms of 30 different classifiers and gene set scores and interpreted by a single observer (PFH) on the basis of the molecular classifier and gene set scores, without considering the conventional phenotype (histology, HLA antibody) (1). Thus, the results, like histology, are not based on any one result but on a combination of results.
Results
The methods for creating technical replicate pairs, biological replicate pairs, and cores divided into cortex and medulla for separate processing are shown in Figure 1. Technical replicates were two microarrays performed on separate aliquots from the same RNA sample; biological replicates were two microarrays performed on halves of one biopsy core processed in parallel with no visual assessment of proportion cortex in the original core.
Demographics for the biological replicates, and cortex–medulla divided pairs, and the kidney biopsy reference set (n = 1208) are shown in Table 1. All biopsies were for clinical indications, including investigation of newly discovered donor-specific antibody (DSA). Routine protocol biopsies in patients with low risk were not included. The demographics of the 37 biopsies chosen for division into two halves as biological replicates and the 26 biopsies selected for division into cortex and medulla are also shown in Table 1.
Table 1.
Demographics of the patients and the biopsy sets
| Biological replicates (n = 37 pairs) | Cortex versus medulla (n = 26 pairs + 4 unpaired from 26 recipients) | Reference set (n = 1208) | |
|---|---|---|---|
| Patient characteristics | |||
| Mean recipient age (years) | 52 (22–77) (1 NA) | 53 (29–71) | 50 (9–91) |
| Recipient gender (% male) | 69% (2 NA) | 58% | 53% |
| Primary disease | |||
| Diabetic nephropathy | 7 | 2 | 180 |
| Glomerulonephritis/vasculitis | 5 | 5 | 47 |
| Interstitial nephritis/pyelonephritis | 5 | 4 | 25 |
| Polycystic kidney disease | 2 | 3 | 120 |
| Others | 10 | 3 | 788 |
| Unknown etiology/blank | 8 | 9 | 48 |
| Mean donor age (years) | 45 (10 NA) | 54 | 43 |
| Donor gender (% male) | 55% (8 NA) | 65% (3 NA) | 48% (347 NA or blank) |
| Donor type (% deceased donor transplant) | 65% | 77% | 65% |
| Biopsy characteristics | |||
| Median and mean time from transplant to biopsy | 1959 (905) days | 944 (62) days | 592 (1553) days |
| Range | 26.2 years | 17.1 years | 31.4 years |
| Primary nonfunction | 2 | 8 | 10 |
| Rapid deterioration of function | 8 | 2 | 211 |
| Slow deterioration of function | 5 | 9 | 217 |
| Stable impaired graft function | 0 | 0 | 79 |
| Investigate proteinuria | 4 | 3 | 185 |
| Follow-up from previous biopsy | 5 | 3 | 91 |
| Others | 13 | 5 | 415 |
| Conventional biopsy diagnosis | |||
| ABMR | 12 | 10 | 215 |
| ABMR suspicious | 0 | 4 | 24 |
| AKI | 0 | 14 | 96 |
| Borderline | 1 | 2 | 109 |
| Interstitial fibrosis and tubular atrophy (IFTA) | 4 | 6 | 145 |
| Normal/NOMOA (no major abnormalities, no rejection) | 6 | 14 | 274 |
| TCMR | 3 | 2 | 87 |
| Mixed | 1 | 2 | 41 |
| Other or N/A | 10 | 2 | 217 |
ABMR, antibody-mediated rejection; AKI, acute kidney injury; NA, not available; TCMR, T cell–mediated rejection.
Gene expression differences between cortex and medulla
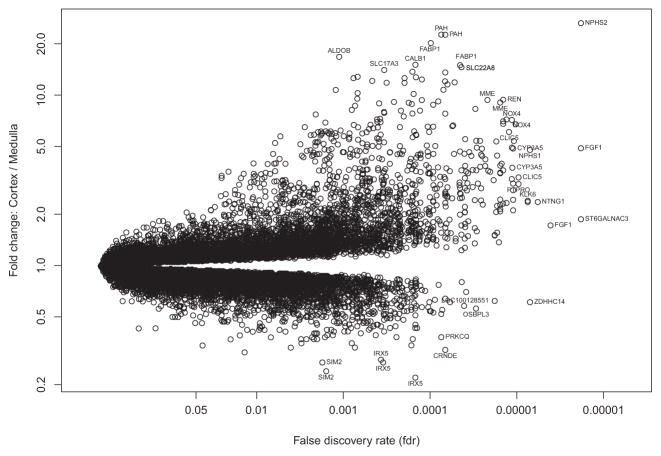
We compared gene expression between paired cortex and medulla samples, expressed (Figure 2) as fold change (y-axis) in cortex versus medulla, versus the p-value based on a paired t-test comparing cortex and medulla samples, in 26 cortex–medulla pairs (x-axis). The probe sets most differentially expressed are labeled.
Figure 2. Volcano plot of fold change between cortex and medulla versus negative log of adjusted p-value with false discovery rate.
NPHS2 had the highest association and fold change between cortex and medulla of 55 000 probe sets. A selection of highly significant probe sets distinguishing cortex from medulla is labeled.
Table 2 ranks the top 30 differentially expressed probe sets by p-value. All of the top 30 had higher expression in cortex, as did 339 of the 408 probesets (83%) that differed between cortex and medulla with false discovery rate (FDR) <0.0001. Thus, no medulla-selective genes were among the top 30.
Table 2.
Top 30 probe sets regarding fold change between cortex and medulla using a paired t-test
| p-value | FDR | Gene | Name | Cortex | Medulla | Fold | PBTs |
|---|---|---|---|---|---|---|---|
| 1.85E-11 | 6.2E-07 | NPHS2 | Nephrosis 2, idiopathic, steroid-resistant (podocin) | 1221 | 43 | 28.62 | KT1 |
| 2.62E-11 | 6.2E-07 | FGF1 | Fibroblast growth factor 1 (acidic) | 470 | 95 | 4.95 | KT1 |
| 3.76E-11 | 6.2E-07 | ST6GALNAC3 | ST6 (alpha-N-acetyl-neuraminyl-2,3-beta-galactosyl-1,3)-N-acetylgalactosaminide alpha-2,6-sialyltransferase 3 | 50 | 26 | 1.9 | – |
| 9.4E-11 | 1.16E-06 | FGF1 | Fibroblast growth factor 1 (acidic) | 69 | 40 | 1.72 | KT1 |
| 2.87E-10 | 2.4E-06 | NPHS1 | Nephrosis 1, congenital, Finnish type (nephrin) | 106 | 22 | 4.9 | – |
| 2.9E-10 | 2.4E-06 | ZDHHC14 | Zinc finger, DHHC-type containing 14 | 131 | 217 | 0.6 | – |
| 4.7E-10 | 2.93E-06 | NTNG1 | Netrin G1 | 52 | 21 | 2.47 | – |
| 4.93E-10 | 2.93E-06 | KLK7 | Kallikrein-related peptidase 7 | 115 | 47 | 2.43 | HT1 |
| 5.33E-10 | 2.93E-06 | KLK6 | Kallikrein-related peptidase 6 | 100 | 40 | 2.47 | – |
| 6.18E-10 | 3.06E-06 | CLIC5 | Chloride intracellular channel 5 | 95 | 28 | 3.35 | – |
| 7.13E-10 | 3.21E-06 | PTPRO | Protein tyrosine phosphatase, receptor type, O | 246 | 79 | 3.1 | – |
| 8.27E-10 | 3.41E-06 | MME | Membrane metallo-endopeptidase | 275 | 51 | 5.42 | KT1 |
| 1.18E-09 | 3.96E-06 | PLA2R1 | Phospholipase A2 receptor 1, 180 kDa | 226 | 106 | 2.14 | – |
| 1.28E-09 | 3.96E-06 | PLCE1 | Phospholipase C, epsilon 1 | 101 | 40 | 2.5 | – |
| 1.28E-09 | 3.96E-06 | PTPRO | Protein tyrosine phosphatase, receptor type, O | 95 | 33 | 2.85 | – |
| 1.29E-09 | 3.96E-06 | CYP3A5 | Cytochrome P450, family 3, subfamily A, polypeptide 5 | 135 | 27 | 5.09 | – |
| 1.41E-09 | 3.96E-06 | CYP3A5 | Cytochrome P450, family 3, subfamily A, polypeptide 5 | 307 | 79 | 3.9 | – |
| 1.44E-09 | 3.96E-06 | NOX4 | NADPH oxidase 4 | 587 | 78 | 7.48 | ENDAT |
| 1.71E-09 | 4.24E-06 | CLIC5 | Chloride intracellular channel 5 | 899 | 146 | 6.16 | – |
| 1.71E-09 | 4.24E-06 | TNNT2 | Troponin T type 2 (cardiac) | 81 | 24 | 3.34 | – |
| 1.83E-09 | 4.3E-06 | PTPRO | Protein tyrosine phosphatase, receptor type, O | 296 | 57 | 5.2 | – |
| 2.01E-09 | 4.3E-06 | NOX4 | NADPH oxidase 4 | 979 | 130 | 7.54 | ENDAT |
| 2.02E-09 | 4.3E-06 | PLCXD3 | Phosphatidylinositol-specific phospholipase C, X domain containing 3 | 181 | 61 | 2.97 | HT1 |
| 2.09E-09 | 4.3E-06 | PODXL | Podocalyxin-like | 2064 | 884 | 2.33 | ENDAT |
| 2.43E-09 | 4.73E-06 | HPGD | Hydroxyprostaglandin dehydrogenase 15-(NAD) | 378 | 102 | 3.72 | KT1 |
| 2.48E-09 | 4.73E-06 | NOX4 | NADPH oxidase 4 | 1193 | 162 | 7.35 | ENDAT |
| 2.78E-09 | 5.1E-06 | HPGD | Hydroxyprostaglandin dehydrogenase 15-(NAD) | 303 | 75 | 4.06 | KT1 |
| 2.89E-09 | 5.11E-06 | NOX4 | NADPH oxidase 4 | 1588 | 221 | 7.18 | ENDAT |
| 3.23E-09 | 5.16E-06 | NTNG1 | Netrin G1 | 43 | 18 | 2.38 | – |
| 3.23E-09 | 5.16E-06 | REN | Renin | 389 | 38 | 10.2 | KT1 |
PBTs, pathogenesis-based transcript sets; KT1, kidney transcripts; ENDAT, endothelial transcripts; FDR, false discovery rate.
NPHS2/podocin was the most differentially expressed gene, both by p-value (FDR = 6.2 × 10⁻⁷) and fold change (average 28.6-fold higher in the cortex samples compared to the medulla samples). For this reason, we selected NPHS2 expression as the basis for estimating the proportion of cortex in biopsy samples. NPHS2 expression is restricted to the cortex, in particular to the glomerular podocyte, and is relatively stable in its expression (8). NPHS2 is shown in Figure 3 to define cortexness in an histologically determined cortex or medulla sample as well as the other 29 of the top 30 probe sets in a principal components analysis.
Figure 3.
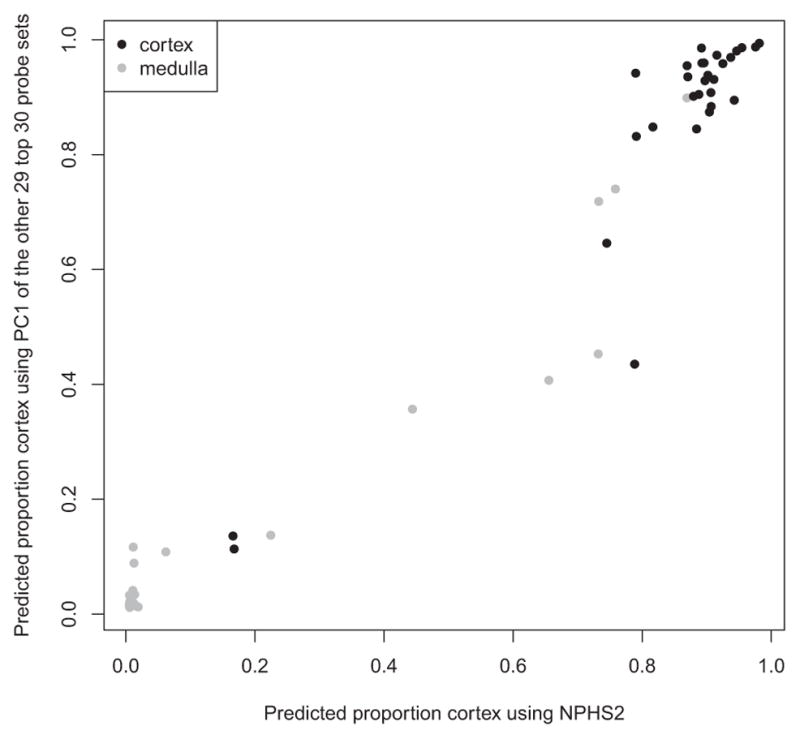
Predicted proportion of cortex in a sample histologically called cortex or medulla using either the principal component 1 score based on 29 of the top 30 probe sets (excluding NPHS2) (y-axis) or using NPHS2 expression alone (x-axis).
Developing an estimate of proportion of cortex using NPHS2
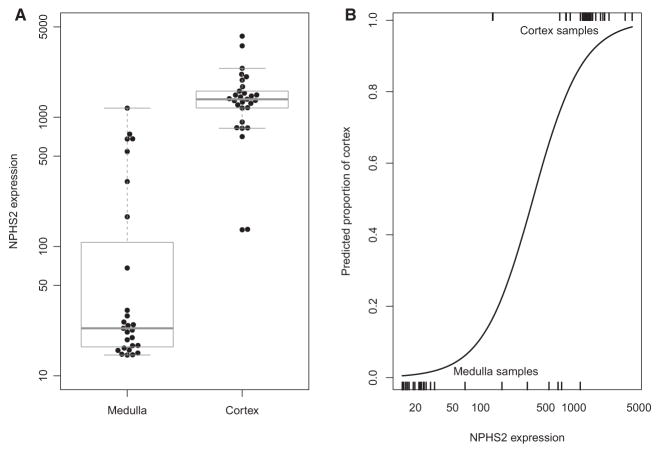
We studied the expression of NPHS2 in samples divided and separately processed as cortex or medulla (Figure 4A). Samples designated medulla had much lower NPHS2 expression than cortex samples.
Figure 4.
Boxplot showing log of NPHS2 expression in medulla and cortex samples as established by histology (A) and the predicted proportion cortex distribution across all samples (B). Box shows the interquartile range, horizontal bar—median and whiskers—1.5 × standard deviation.
To establish an equation estimating the proportion of cortex in a biopsy, we assumed that the divided samples were either cortex or medulla as labeled. We also included four biopsies that, during preparation of the divided cortex–medulla cores, were found by light microscopy to be either all cortex (n = 3) or all medulla (n = 1).
The distribution of predicted proportion based on NPHS2 expression is shown in Figure 4(B). The predicted proportion of cortex (and NPHS2 expression) was high in most cortex samples and low in most medulla samples.
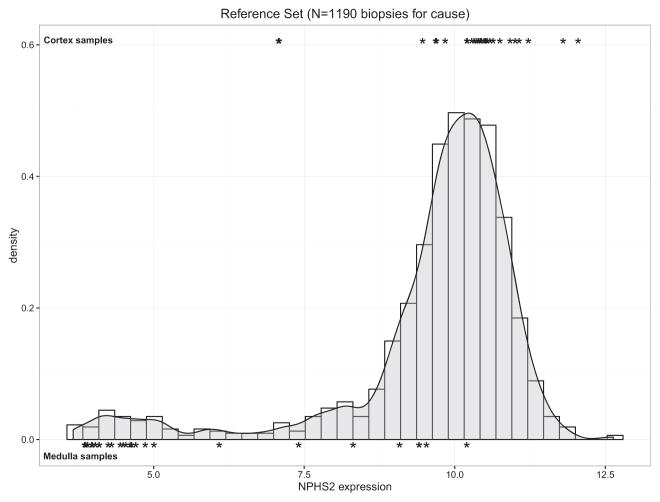
We analyzed the distribution of NPHS2 expression in the reference set of 1190 intact biopsies (i.e. not divided into cortex and medulla). Figure 5 shows the density plot distribution of NPHS2 expression, compared to the actual cortex (top) and medulla (bottom) samples used to generate the measurement. A large proportion (89%) of the reference set biopsies had higher than 50% proportion cortex and overlapped the cortex samples. A small proportion of biopsies had low expression of NPHS2.
Figure 5. Density plot of NPHS2 expression in 1190 nonbisected biopsy cores.
Black symbols show the distribution of NPHS2 expression values in cortex and medulla divided pair samples, respectively.
Effect of proportion of cortex estimates on the reference set MMDx readings
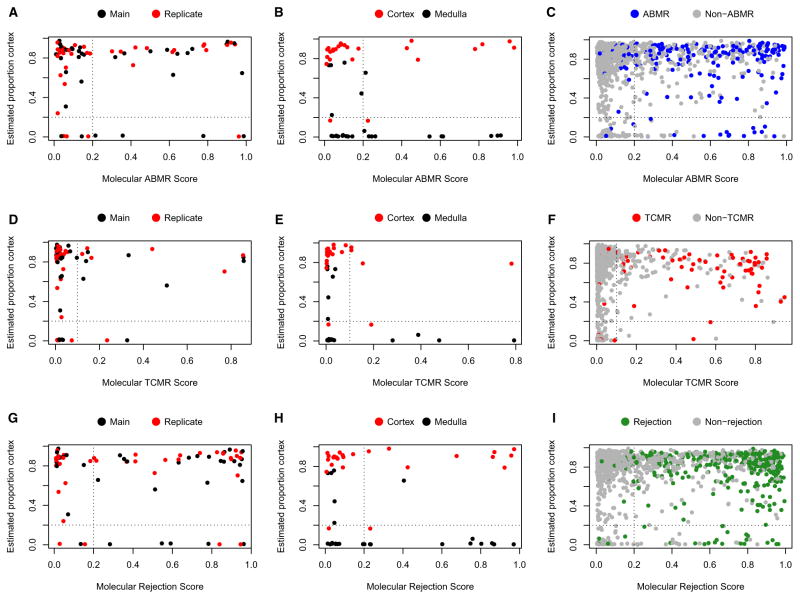
The distribution in molecular scores across the high cortex and low cortex samples was compared to establish whether the molecular ABMR, TCMR, and rejection scores were affected by predicted proportion cortex in a sample (y-axis in Figure 6). The biological replicates, the cortex/medulla pairs, and the reference set minus cortex–medulla samples are shown separately.
Figure 6. Scatter plots with predicted proportion cortex (y-axis) versus molecular ABMR, TCMR, and rejection scores in the biological replicate set, the cortex and medulla set, and the reference set (x-axis).
Vertical dotted line indicates the positive/negative cutoffs for the molecular scores; horizontal dotted line indicates the 0.2/0.8 split for the proportion of cortex. A) ABMR - biological replicates, B) ABMR - cortex/medulla, C) ABMR - reference set, D) TCMR - biological replicates, E) TCMR - cortex/medulla, F) TCMR - reference set, G) Rejection - biological replicates, H) Rejection - cortex/medulla, I) Rejection - reference set. Refer to Table 3 for further details. ABMR, antibody-mediated rejection; TCMR, T cell–mediated rejection.
Positive ABMR molecular scores (right of the dotted vertical line, cutoff = 0.2) were found in samples with both high and low proportion cortex (above and below dotted horizontal line, respectively, cutoff = 0.2). No significant difference in ABMR scores was found in the biological replicates, the cortex/medulla subset, or the reference set minus cortex–medulla samples, respectively (i.e. the likelihood of a positive molecular score was not consistently different in samples with high or low cortex content) (Figures 6A–C). The results for the molecular TCMR scores (Figures 6D–F) and rejection scores (Figures 6G–I) were similar. The statistical results from chi-square tests for these data are shown in Table 3.
Table 3.
Chi-square test statistical values for Figures 6(A)–(I) and 7(A)–(C)1
| Figure no. | Description | Distribution of molecular scores in quadrants | ||||
|---|---|---|---|---|---|---|
|
| ||||||
| Top right quadrant (C+M+) | Top left quadrant (C+M−) | Bottom right quadrant (C−M+) | Bottom left quadrant (C−M−) | p-value | ||
| Figure 6(A) | ABMR—biological replicates | 25 | 39 | 5 | 5 | 0.51 |
| Figure 6(B) | ABMR—cortex/medulla | 9 | 25 | 11 | 11 | 0.07 |
| Figure 6(C) | ABMR—reference set | 354 | 745 | 30 | 61 | 0.88 |
| Figure 6(D) | TCMR—biological replicates | 13 | 51 | 2 | 8 | 0.98 |
| Figure 6(E) | TCMR—cortex/medulla | 4 | 30 | 5 | 17 | 0.28 |
| Figure 6(F) | TCMR—reference set | 166 | 933 | 6 | 85 | 0.03 |
| Figure 6(G) | Rejection—biological replicates | 39 | 25 | 7 | 3 | 0.58 |
| Figure 6(H) | Rejection—cortex/medulla | 10 | 24 | 12 | 10 | 0.06 |
| Figure 6(I) | Rejection—reference set | 534 | 565 | 38 | 53 | 0.21 |
| Figure 7(A) | IRRATs—cortex/medulla | 21 | 13 | 14 | 8 | 0.89 |
| Figure 7(B) | IRRATs—biological replicates | 39 | 25 | 6 | 4 | 0.96 |
| Figure 7(C) | IRRATs—reference set | 456 | 643 | 37 | 54 | 0.88 |
ABMR, antibody-mediated rejection; IRRATs, acute kidney injury transcripts; TCMR, T cell–mediated rejection.
The cutoffs in Figure 1 divide the data into high cortex (“C+”) versus low cortex (“C−”) and molecular score positive (“M+”) or negative (“M−”), giving four quadrants: C+M+, C+M−, C−M+, and C−M−.
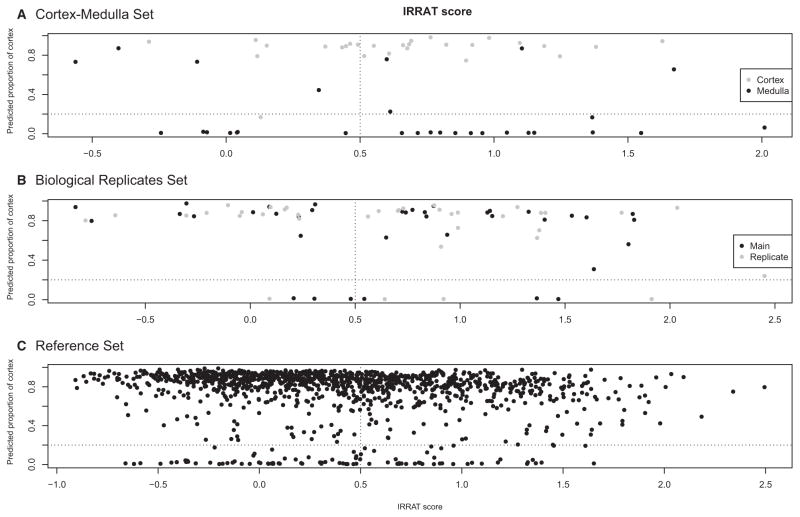
Similar analyses were performed to determine whether a relationship existed between the scores of the AKI transcripts (IRRAT scores). Figure 7 shows the distributions of the predicted proportion cortex (y-axis) versus the AKI score. There was no relationship between the predicted proportion of cortex and molecular AKI (IRRAT scores). The statistical results from chi-square tests for Figure 7 are shown in Table 3.
Figure 7. Investigating the relationship between injury (IRRAT score) and proportion of cortex.
Vertical dotted line indicates the arbitrary positive/negative cutoff for the molecular IRRAT scores; horizontal dotted line indicates an arbitrary 0.2/0.8 split for the proportion of cortex. A) IRRATs - cortex/medulla, B) IRRATs - biological replicates, C) IRRATs - reference set. Refer to Table 3 for further details. IRRAT, acute kidney injury transcripts.
Effect of proportion cortex on the molecular rejection and injury scores
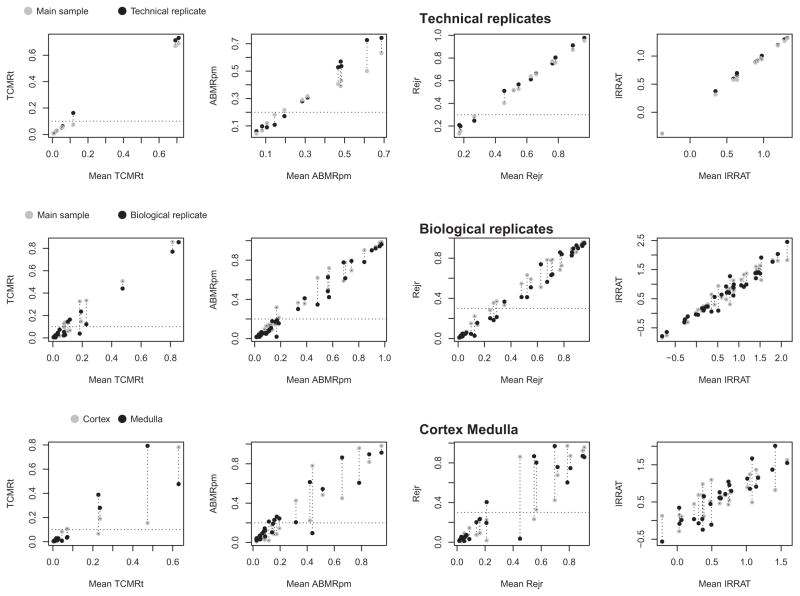
In an independent approach, we compared the difference in four molecular scores (TCMR, ABMR, rejection, and AKI transcripts [IRRATs]) between cortex and medulla to the difference seen between technical replicates or biological replicates. (The cortex and medulla segments were usually smaller than the other cores used for assessment, potentially increasing the sampling error.) The difference in the molecular scores for TCMR, ABMR, all rejection, and IRRAT in the technical replicates (upper panels), biological replicates (middle panels), and cortex–medulla pairs (lower panels) is shown in Figure 8.
Figure 8. Reproducibility plots of the molecular scores of rejection (TCMR, ABMR, all rejection) and acute kidney injury (IRRAT) in the technical and biological replicates and in the cortex–medulla divided pairs.
Dotted horizontal line indicates the positive/negative cutoffs for the molecular scores. The y-axes are the scores for the two samples compared for the TCMR, ABMR, and Rejection classifiers (a number between 0 and 1.0) or the geometric mean of the expression of the AKI transcripts (IRRATs). The x-axis is the mean of classifier or IRRAT scores. ABMR, antibody-mediated rejection; AKI, acute kidney injury; IRRAT, acute kidney injury transcripts; TCMR, T cell–mediated rejection.
The difference between the two scores can be seen on the y-axis versus the mean of the two scores (x-axis). The difference in the molecular TCMR, ABMR, and rejection scores between technical replicates was minimal (Figure 8, upper panels), and the difference between biological replicates (Figure 8, middle panels) was similar to that between technical replicates. The difference between cortex and medulla segments of a divided core (Figure 8, lower panels) was greater than in the biological replicates. However, the positive–negative classifier calls for TCMR, ABMR, or rejection (indicated by the horizontal line) were usually in agreement.
MMDx assessment of cortex–medulla pairs and biological replicate pairs by multiple classifiers
Diagnostic assessment of the microarray analysis of a biopsy in the MMDx system uses multiple classifier scores for each rejection diagnosis and is interpreted by a single observer (PFH) independent of the histology and DSA status (1) as outlined in Materials and Methods and in a forthcoming paper (Halloran et al., unpublished data). The diagnoses considered for this analysis were ABMR and TCMR. The consistency of diagnoses in paired samples of cortex and medulla was compared to the biological replicate set (Table 4). The data were divided into three groups based on their molecular report diagnostic sign-out: agreement; agreement with a difference in scale (i.e. “severe TCMR” vs. “moderate TCMR”); and disagreement.
Table 4.
Consistency in diagnosis between paired samples
| Number of biological replicate pairs | Agreement/disagreement | Description |
|---|---|---|
| Agreement1 in diagnosis between signed-out biological replicate MMDx reports (n =38 pairs) | ||
| 32 | Agreement1 | Comparable diagnosis with no substantive change |
| 4 | Disagreement2 | Disagreement on a major diagnostic point (i.e. “No TCMR” vs. “TCMR”) |
| 1 | Ambiguous3 | One or both reports ambiguous in ABMR or TCMR, so agreement could not be measured |
|
| ||
| Number of cortex/medulla pairs | Agreement/disagreement | Description |
|
| ||
| Agreement1 in diagnosis between signed-out cortex and medulla MMDx reports (n = 26 pairs) (excluding 3 unpaired samples) | ||
| 23 | Agreement1 | Comparable diagnosis with no substantive change |
| 3 | Disagreement2 | Disagreement on a major diagnostic point (i.e. “No TCMR” vs. “TCMR”) |
ABMR, antibody-mediated rejection; MMDx, molecular microscope diagnostic system; TCMR, T cell–mediated rejection.
Agreement defined as either perfect agreement (presence/absence of type of rejection and agreement in scale, i.e. “severe ABMR, no TCMR” in both diagnostic signouts), or agreement on presence/absence of rejection with difference in scale (i.e. “severe ABMR, No TCMR” and “moderate ABMR, no TCMR”).
Disagreement defined as a pair of samples with one having rejection and the other lacking rejection (i.e. “no ABMR, moderate TCMR” and “moderate ABMR, moderate TCMR”).
Ambiguous samples included those with histological screen failures, ambiguous histology and molecular reads, or samples too damaged/lacking in quality for a proper diagnostic read. Agreement could not be determined in these cases as no distinct diagnostic prediction was possible.
Agreement between paired samples for the cortex–medulla set (23/26, 88%) was similar to the agreement between paired samples in the biological replicate set (32/37, 86%). These agreement values correlated more closely than the interobserver agreement usually recorded for histology assessments (9, 10).
Discussion
The present study addressed the question of whether molecular methods could assess the proportion of cortex in a biopsy core and how the relative proportions of cortex versus medulla in a biopsy core would affect the molecular diagnosis of rejection and injury using the MMDx system. We identified genes whose expression was different in cortex and medulla and then used the top example, NPHS2/podocin, as a marker to determine the proportion of each biopsy that was cortex versus medulla, and the effect of proportion cortex in 1190 biopsies on their interpretation in the MMDx system. In a smaller subset of paired biopsies, we directly compared the MMDx signatures between cortex and medulla from the same biopsy in technical replicates, biological replicates, and cortex–medulla pairs. The conclusion from both these data sets was that MMDx signatures were not impacted in a major way by whether the sample was largely medulla or largely cortex, although 89% of samples were >50% cortex. Cortex and medulla samples are less concordant than either biological or technical replicates, but this generally did not affect the interpretation. This is important because sample collection for tissue RNA analysis usually specifies that the sample be immediately placed into RNA preservative without estimating the proportion cortex in order to avoid compromising RNA integrity. Thus, when assessing kidney transplant biopsies using microarrays, we are able to estimate the proportion cortex in each biopsy and to read rejection and injury information even when the biopsy is largely medulla. Finally, in a qualitative sense, MMDx finds that medulla does undergo typical rejection processes, which are currently not being assessed by the histology diagnostic system that does not enable diagnoses of rejection in medulla. This suggests that molecular methods will be able to read other tissues that are currently not assessable by the current histology guidelines such as bronchial mucosa of lung transplants, and that all donor tissue probably undergoes rejection and injury.
We conclude that molecular changes of rejection and injury can be assessed in medulla and show general agreement with cortex of the same specimen. Furthermore, we conclude that the molecular scores vary more between cortex and medulla than expected from biological replicates, but this generally will not affect disease interpretation by the classifiers and molecular scores. We note, however, that there are certain limitations to these conclusions, due to the small number of samples with certain combinations of features (e.g. samples with TCMR that also have a low proportion cortex). The potential for type II error limits the strength of inferences that can be drawn from the statistical findings, though additional studies will follow as more samples become available.
The use of NPHS2/podocin mRNA to estimate proportion of cortex for each biopsy sample is supported by current knowledge of NPHS2/podocin biology, which along with the data presented here indicates that very low NPHS2/podocin mRNA is mainly due to high medulla content. There are three reasons why a transplant kidney biopsy sample might have low expression of NPHS2: (i) the sample is composed largely of medulla (containing no glomeruli); (ii) the expression of NPHS2 is depressed by injury and/or inflammation; and (iii) many glomeruli are sclerotic and may have lost NPHS2 mRNA (11). Biopsies with TCMR had moderately reduced NHPS2 mRNA (by about 50%) but not to the very low levels characteristic of medulla (28-fold lower than cortex). We also reviewed NPHS2/podocin mRNA in our previous mouse kidney transplant microarray studies, and found that TCMR and AKI reduced expression of NPHS2 by a maximum of 50–70% (data not shown), similar to the reductions in other transcripts characteristic of well-differentiated kidney tissue (12, 13). In addition, we studied our data on human biopsies with extensive atrophy-fibrosis (histologic ci scores >1) to see if they had lost NPHS2, and found relatively little loss compared to kidney transplants with little atrophy-fibrosis (ci <1), supporting the utility of NPHS2 as a guide to low proportion cortex even in the presence of atrophy-fibrosis.
Podocyte loss does occur in glomerular sclerosis and in glomerular inflammation/injury such as in transplant glomerulopathy or recurrent glomerular disease (14), but the loss of NPHS2 mRNA may be partially offset by compensatory hypertrophy and increased expression in the remaining glomeruli.
The use of gene expression to reflect proportion of cortex versus medulla is not dependent on the assumption that gene expression will not change in disease states, but only that the genes specific for cortex are relatively well preserved in disease states. Many genes identified as preferentially expressed in cortex are well known to be central to glomerular function because (a) their mutations are associated with inherited glomerular diseases including diffuse mesangial sclerosis, congenital nephrotic syndrome, and focal and segmental glomerulosclerosis (NPHS1, NPHS2, PTPRO, PLCE1) (8); (b) circulating antibodies directed against the protein are associated with glomerular disease, namely, membranous nephropathy (PLA2R1) (15); (c) they are key to renin–angiotensin system regulation through the juxta-glomerular apparatus (REN, renin) (16); or (d) they have otherwise been identified as highly expressed by glomerular podocytes (CLIC5, PODXL) (17, 18). Tubulo-interstitial processes such as AKI or TCMR may cause some reduction in expression of the genes typical of the functioning kidney but not complete loss (12, 19). Thus, for the purposes of identifying samples that are primarily medulla, very low NPHS2/podocin is reliable, but we should remain cognizant of potential disease-related loss of expression of NPHS2 or other cortex genes when diffuse inflammatory diseases such as TCMR are operating.
Note that some samples labeled as medulla had high expression of NPHS2 and some labeled cortex had relatively low expression. This is not unexpected given the small size of the samples and the imperfect separation between cortex and medulla, where the precise boundary is difficult to establish by visual inspection using light microscopy.
Two features emerged for the TCMR score in relationship to proportion of cortex estimates. First, there were very few high TCMR scores in samples with the highest proportion cortex (0.9–1.0), suggesting that TCMR may somewhat reduce NPHS2 expression, as it does with other kidney transcripts as shown in mouse kidney allografts with TCMR (12, 13). Nevertheless, the majority of TCMR was in samples with proportion cortex estimates of 0.5–0.9, indicating that any reduction of NPHS2 expression due to TCMR or other diseases did not approach the very low levels observed in medulla. Second, although high TCMR scores are often recorded in samples with very low cortex content (i.e. medulla), there were fewer positive TCMR scores in Reference Set samples with very low proportion cortex, although the p-value (0.03) was of only borderline significance. We therefore cannot exclude the possibility that TCMR is underrepresented in samples with very low proportion of cortex.
While the proportion of cortex has no major effect on the performance of the molecular scores, the difference between cortex and medulla pairs was greater than between technical or biological replicates (within the limits of the power of this sample size of 1208 biopsies), inviting a caveat when diagnosing rejection molecularly in pure medulla. The number of biopsies in the reference set with almost pure medulla samples as estimated by NPHS2 expression was small: less than 10% of biopsies had <0.5 estimated proportion of cortex, and fewer still had less 10% cortex. In the future as we develop new classifiers to estimate rejection, the effect of proportion cortex can be tested for each and possibly included as a variable in the algorithm.
Based on this analysis, molecular AKI changes (as estimated by the IRRAT score) are similar in cortex and medulla. IRRAT molecular scores were distributed similarly in the cortex–medulla set, the biological replicates set, and the reference set. We previously reported (in an earlier version of the reference set) that assessment of injury should be molecular because this correlates with function whereas histologic estimates of acute tubular injury do not (7). We now add that AKI can be molecularly detected in medulla. This is not surprising, given that the top genes expressed in acutely injured kidneys are often expressed in other injured tissues and in cancers, reflecting the tendency of tissues to lose their differentiated features and become more similar after injury. For example, we find that many AKI transcripts are also increased in biopsies from injured heart transplants (unpublished observations).
While these studies give reassurance about the reliability of molecular assessment on the biopsies available for the studies, the ideal biopsy size for molecular interpretation cannot be estimated because of the limited cores available for this research study. The average biopsy was only 3 mm in length (i.e. a fraction of one core), far below the amount of tissue used for histology assessment. As molecular studies become routine and cores of greater length are available, the relationship between biopsy size and stability of the molecular scores should continue to be explored, particularly for TCMR, which is sometimes patchy in histologic assessment. Nevertheless, the ability of the MMDx system to assess small tissue samples is an advantage over histology, provided that histologic assessment of glomerular diseases (e.g. recurrent glomerulonephritis) is not required. Having said that, the expression of mRNA for a number of important glomerular transcripts in the microarray readout raises the possibility that conclusions about glomerular diseases may eventually be inferred directly from core biopsies without microdissecting the glomeruli.
In conclusion, NPHS2 can be used to estimate proportion cortex for MMDx purposes. NPHS2 is subject to small loss of expression in disease but the cortex–medulla differences override these. Rejection and injury do occur in medulla and can be read molecularly, and the proportion cortex does not seem to have a major influence on the ability to read rejection and injury.
Acknowledgments
This research has been supported by funding and/or resources from Novartis Pharma AG, Genome Canada, Canada Foundation for Innovation, the University of Alberta Hospital Foundation, Roche Molecular Systems, Hoffmann-La Roche Canada Ltd., the Alberta Ministry of Advanced Education and Technology, the Roche Organ Transplant Research Foundation, and Astellas. Dr. Halloran held a Canada Research Chair in Transplant Immunology until 2008 and currently holds the Muttart Chair in Clinical Immunology. R.W. acknowledges support from the National Institutes of Health (grants R01 DK 102643 and R01 DK 46073). Part of this manuscript was presented as an oral presentation at the American Transplant Congress, Boston, 2016 (20).
Abbreviations
- ABMR
antibody-mediated rejection
- AKI
acute kidney injury
- IRRAT
AKI transcripts
- MMDx
molecular microscope diagnostic system
- TCMR
T cell–mediated rejection
Footnotes
Disclosure
The authors of this manuscript have conflicts of interest to disclose as described by the American Journal of Transplantation. P.F. Halloran holds shares in Transcriptome Sciences Inc., a company with an interest in molecular diagnostics. P.F. Halloran lectures for Astellas. The other authors have no conflicts of interest to disclose.
References
- 1.Halloran PF, Famulski KS, Reeve J. Molecular assessment of disease states in kidney transplant biopsies. Nat Rev Nephrol. 2016;12:534–548. doi: 10.1038/nrneph.2016.85. [DOI] [PubMed] [Google Scholar]
- 2.Racusen LC, Solez K, Colvin RB, et al. The Banff 97 working classification of renal allograft pathology. Kidney Int. 1999;55:713–723. doi: 10.1046/j.1523-1755.1999.00299.x. [DOI] [PubMed] [Google Scholar]
- 3.Reeve J, Sellares J, Mengel M, et al. Molecular diagnosis of T cell-mediated rejection in human kidney transplant biopsies. Am J Transplant. 2013;13:645–655. doi: 10.1111/ajt.12079. [DOI] [PubMed] [Google Scholar]
- 4.Sellares J, Reeve J, Loupy A, et al. Molecular diagnosis of antibody-mediated rejection in human kidney transplants. Am J Transplant. 2013;13:971–983. doi: 10.1111/ajt.12150. [DOI] [PubMed] [Google Scholar]
- 5.Halloran PF, Pereira AB, Chang J, et al. Microarray diagnosis of antibody-mediated rejection in kidney transplant biopsies: An international prospective study (INTERCOM) Am J Transplant. 2013;13:2865–2874. doi: 10.1111/ajt.12465. [DOI] [PubMed] [Google Scholar]
- 6.Reeve J, Einecke G, Mengel M, et al. Diagnosing rejection in renal transplants: A comparison of molecular- and histopathology-based approaches. Am J Transplant. 2009;9:1802–1810. doi: 10.1111/j.1600-6143.2009.02694.x. [DOI] [PubMed] [Google Scholar]
- 7.Famulski KS, de Freitas DG, Kreepala C, et al. Molecular phenotypes of acute kidney injury in human kidney transplants. J Am Soc Nephrol. 2012;23:948–958. doi: 10.1681/ASN.2011090887. [DOI] [PMC free article] [PubMed] [Google Scholar]
- 8.Vivante A, Hildebrandt F. Exploring the genetic basis of early-onset chronic kidney disease. Nat Rev Nephrol. 2016;12:133–146. doi: 10.1038/nrneph.2015.205. [DOI] [PMC free article] [PubMed] [Google Scholar]
- 9.Furness PN, Taub N, Assmann KJ, et al. International variation in histologic grading is large, and persistent feedback does not improve reproducibility. Am J Surg Pathol. 2003;27:805–810. doi: 10.1097/00000478-200306000-00012. [DOI] [PubMed] [Google Scholar]
- 10.Furness PN, Taub N. International variation in the interpretation of renal transplant biopsies: Report of the CERTPAP Project. Kidney Int. 2001;60:1998–2012. doi: 10.1046/j.1523-1755.2001.00030.x. [DOI] [PubMed] [Google Scholar]
- 11.Fukuda A, Wickman LT, Venkatareddy MP, et al. Urine podocin: Nephrin mRNA ratio (PNR) as a podocyte stress biomarker. Nephrol Dial Transplant. 2012;27:4079–4087. doi: 10.1093/ndt/gfs313. [DOI] [PMC free article] [PubMed] [Google Scholar]
- 12.Einecke G, Broderick G, Sis B, Halloran PF. Early loss of renal transcripts in kidney allografts: Relationship to the development of histologic lesions and alloimmune effector mechanisms. Am J Transplant. 2007;7:1121–1130. doi: 10.1111/j.1600-6143.2007.01797.x. [DOI] [PubMed] [Google Scholar]
- 13.Einecke G, Kayser D, Vanslambrouck JM, et al. Loss of solute carriers in T cell mediated rejection in mouse and human kidneys: An active epithelial injury—repair response. Am J Transplant. 2010;10:2241–2251. doi: 10.1111/j.1600-6143.2010.03263.x. [DOI] [PubMed] [Google Scholar]
- 14.Yang Y, Hodgin JB, Afshinnia F, et al. The two kidney to one kidney transition and transplant glomerulopathy: A podocyte perspective. J Am Soc Nephrol. 2015;26:1450–1465. doi: 10.1681/ASN.2014030287. [DOI] [PMC free article] [PubMed] [Google Scholar]
- 15.Timmermans SA, Damoiseaux JG, Heerings-Rewinkel PT, et al. Evaluation of anti-PLA2R1 as measured by a novel ELISA in patients with idiopathic membranous nephropathy: A cohort study. Am J Clin Pathol. 2014;142:29–34. doi: 10.1309/AJCP8QMOY5GLRSFP. [DOI] [PubMed] [Google Scholar]
- 16.Brunskill EW, Sequeira-Lopez ML, Pentz ES, et al. Genes that confer the identity of the renin cell. J Am Soc Nephrol. 2011;22:2213–2225. doi: 10.1681/ASN.2011040401. [DOI] [PMC free article] [PubMed] [Google Scholar]
- 17.Kerjaschki D, Sharkey DJ, Farquhar MG. Identification and characterization of podocalyxin–the major sialoprotein of the renal glomerular epithelial cell. J Cell Biol. 1984;98:1591–1596. doi: 10.1083/jcb.98.4.1591. [DOI] [PMC free article] [PubMed] [Google Scholar]
- 18.Tavasoli M, Al-Momany A, Wang X, Li L, Edwards JC, Ballerman BJ. Both CLIC4 and CLIC5A activate ERM proteins in glomerular endothelium. Am J Physiol Renal Physiol. 2016;311:F945–F957. doi: 10.1152/ajprenal.00353.2016. [DOI] [PubMed] [Google Scholar]
- 19.Mueller TF, Einecke G, Reeve J, et al. Microarray analysis of rejection in human kidney transplants using pathogenesis-based transcript sets. Am J Transplant. 2007;7:2712–2722. doi: 10.1111/j.1600-6143.2007.02005.x. [DOI] [PubMed] [Google Scholar]
- 20.Madill-Thomsen KS, Reeve J, Bohmig G, Eskandary F, Halloran PF. Molecular assessment of kidney transplant biopsies performs similarly in medulla and cortex. Abstract 28. Am J Transplant. 2016;16(S3):214. [Google Scholar]


