

Abstract
Objective
Cerebral edema(CE) is a key poor prognosticator in TBI. There are no biomarkers identifying patients at-risk, or guiding mechanistically-precise therapies. Sulfonylurea Receptor-1(Sur1) is upregulated only after brain injury, causing edema in animal studies. We hypothesized that Sur1 is measurable in human CSF after severe TBI (sTBI) and is an informative biomarker of edema and outcome.
Methods
119 CSF samples were collected from 28 sTBI patients. Samples were retrieved at 12, 24, 48, 72h, and before EVD removal. 15 control samples were obtained from patients with normal pressure hydrocephalus. Sur1 was quantified by ELISA. Outcomes included CT edema, ICP measurements, therapies targeting edema and 3-month Glasgow Outcome Scale score.
Results
Sur1 was present in all sTBI patients (mean=3.54±3.39ng/ml, peak=7.13±6.09ng/ml) but undetectable in all controls (p<0.001). Mean and peak Sur1 was higher in patients with CT edema (4.96±1.13 ng/ml vs. 2.10±0.34 ng/ml, p=0.023). There was a temporal delay between peak Sur1 and peak ICP in 91.7% of patients with intracranial hypertension. There was no association between mean/peak Sur1 and mean/peak ICP, proportion of ICP > 20 mmHg, use of edema-directed therapies, decompressive craniotomy or 3 month Glasgow Outcome Score. However, decreasing Sur1 trajectories between 48–72h were significantly associated with improved CE and clinical outcome. Area under the multivariate model ROC curve was 0.881.
Interpretation
This is the first report quantifying human CSF Sur1. Sur1 was detected in sTBI, absent in controls, correlated with CT-edema and preceded peak ICP. Sur1 trajectories between 48–72h were associated with outcome. Since a therapy inhibiting Sur1 is available, assessing CSF Sur1 in larger studies is warranted to evaluate our exploratory findings regarding its diagnostic, and monitoring utility, as well as its potential to guide targeted therapies in TBI and other diseases involving CE.
Keywords: Cerebral Edema, traumatic brain injury, biomarker, sulfonylurea receptor-1
INTRODUCTION
Cerebral Edema (CE) is strongly associated with death and unfavorable outcome in Traumatic Brain Injury (TBI) (1–5). It is a significant cause of in-hospital death occurring in >60% of TBI patients with mass lesions and even occurs in 15% of those with normal initial CT scans(6). Edema can be focal or diffuse, result from multiple etiologies/mechanisms, and can occur remote from the primary injury site (7–11). Although CE develops in the initial 24h and peaks at 3–5 days, upstream mechanisms that initiate its development may begin sooner, and are potential therapeutic targets.
Critical care management focuses on evaluating and treating CE. Nevertheless, assessment of CE remains limited to suboptimal neurological examinations in intubated/sedated patients, ICP monitors and imaging. ICP measurements in isolation may represent an insufficient reflection of edema, and should be aided by complementary information(12). Current therapies to reduce CE remain reactionary, non-specific and morbid. Early biomarkers identifying targets in the development/treatment of CE represent a critical unmet need.
Many cellular/molecular pathways contribute to posttraumatic CE(10, 13–35). TBI is heterogeneous, and edema may result from multiple pathways. In 1905, Reichardt coined the term ‘brain edema’ to differentiate underlying cellular processes from ‘brain swelling’ due to vascular engorgement(11). Research advances have since implicated multiple molecular pathways involved in TBI related CE pathogenesis like aquaporin-4 (AQP4), matrix-metalloproteinases (MMP), Na+-K(+)-2Cl(−) cotransporter (NKCC1), and sulfonylurea receptor (Sur1)- transient-receptor-potential cation channel member-4 (Trpm4)(10, 17, 19, 22, 25–28, 31, 33–37). These mechanisms affect blood-brain-barrier integrity, cellular volume regulation, oncotic gradients, and inflammatory responses-culminating in different forms of CE—described as contusional versus diffuse or categorized as vasogenic, cytotoxic, or osmotic(11). Characterizing these contributions could facilitate individually-tailored, mechanistically-precise approaches to treatment/prevention. This biomarker-guided theranostic approach to edema prevention could minimize the risks of reactionary approaches to raised ICP.
Seminal research identified a pathway involving Sur1 in CE development(29) (30, 31). Sur1 is a transmembrane-receptor that obligatorily associates with a non selective monovalent cation channel (Trpm4) (38, 39). Injury upregulates Sur1 and activates the Sur1-Trpm4 complex, with cell depolarization from sodium influx, intracellular edema and eventually cell death (29, 40). There are advantages to studying this pathway in humans: 1) it is linked to edema in pre-clinical models including TBI 2) it is not normally expressed in CNS but upregulated by injury(29, 32), 3) it is a potential preventative target for edema, and 4) it can be inhibited by Glibenclamide (FDA-approved for diabetes) at low, non-hypoglycemic doses (29). Clinical trials (stroke and TBI) are evaluating the efficacy of Glibenclamide. The recent Phase-2 trial in stroke Glyburide Advantage in Malignant Edema and Stroke (GAMES-RP) was recently presented at the American Academy of Neurology and demonstrated extremely promising results with regards to cerebral edema. Although GAMES-RP was negative for its primary endpoint of dichotomized modified Rankin Scale score in the absence of decompressive hemicraniotomy, patients treated with Glyburide (a.k.a. Glibenclamide) had reduced mortality (14% vs 36%, p=0.03) and decreased evidence of cerebral edema determined by midline shift between 72–96 hours (4.4±3.6 mm vs 8.8±4.9 mm, p=0.0006)(41). Sur1 upregulation has also been demonstrated in multiple cell types in human cerebral contusions(42). However, to our knowledge, quantification of human Sur1 in cerebrospinal fluid(CSF) from patients with any CNS injury remains undefined.
Given the lack of serologic/CSF biomarkers for CE, pre-clinical evidence of Sur1 involvement in CE generation and the safety profile of an existing medication inhibiting this pathway, we undertook a bench-to-bedside pilot study to investigate Sur1 as a CSF biomarker, explore the relationship between CSF Sur1 in patients with severe TBI (sTBI) versus controls, and define associations between Sur1 and markers of CE or outcomes. We a priori hypothesized that Sur1 would be present in patients with sTBI, non-detectable in controls, and associated with CE.
MATERIALS AND METHODS
Study Design
Subjects were prospectively enrolled in the Brain-Trauma Research Center database. All patients had sTBI (Glasgow Coma Scale (GCS) score <9 and placement of an external ventricular drain (EVD) per our standard care). 28 patients between 2011 and 2014 were randomly selected. Selection was blinded to outcomes. Control CSF was obtained from a bio-bank of 15 consecutively enrolled patients with normal pressure hydrocephalus (2008–2009). All subjects or health-care proxies provided informed consent. The local IRB approved the study.
CSF Collection and Sur1 Quantification
Ventricular CSF samples were collected per protocol (43) and stored at −80°C. 100 μl of CSF was thawed (43) and retrieved from 12, 24, 48, 72h and before EVD removal.
CSF Sur1 quantification was performed using enzyme linked immunosorbent assay (ELISA, Biosource). For TBI patients, mean and peak Sur1 values were also calculated. Assays were performed by a technician masked to demographic/outcome data. The mean coefficient of variation is <10%, and the minimum detectable Sur1 level is 0.118 ng/ml. TBI and control samples were paired on each plate to avoid inter-plate variability.
Data Collection
Demographic and outcome data were collected by an assistant masked to Sur1 levels. Five categories evaluated the association between Sur1, CE, and outcomes.
Presence of edema on initial head CT (determined by any of the following factors: compression of ventricles, effacement of basilar cisterns or sulci; transfalcine herniation; loss of gray/white matter differentiation) is associated with raised ICP after TBI (44, 45), and was included as an outcome. Determinations were made by two independent parties: (a) the official radiologist final report and (b) a second, independent blinded trained investigator who reviewed each scan and evaluated CT edema on all patients. Any discrepancies between these two determinations was evaluated by a third blinded investigator, and adjudication was reached based on majority consensus.
Hourly ICP measurements- subcategorized into means, peaks, continuous trend over time, initial ICP >20 mmHg, and number of measurements >20 mmHg during neuromonitoring.
Therapies targeting edema: To account for practice variation, these included Mannitol, hypertonic saline, hypothermia, neuromuscular blockade or sedation.
Decompressive craniotomy for refractory intracranial hypertension.
3-month GOS: favorable(GOS ≥4) versus unfavorable outcome(GOS <4).
Statistical Analysis
Descriptive statistics of baseline variables were reported as means±standard error. Continuous variables were compared using Student t-test, analysis of variance (ANOVA) or Wilcoxon rank-sum test as appropriate. Categorical variables were compared using Fisher’s-exact tests. Kappa values determined inter-rater reliability for CT edema. Sur1 levels and ICP over time were graphed using connected plots. General ICP trends were determined using two-way median-spline curves--which were also used to estimate time-lags between peak Sur1 and peak ICP. Bivariate linear and logistic regression models were developed with clinically relevant variables in the evaluation of the independent relationship between Sur1 levels and outcomes. Exploratory multivariate logistic and linear regression models were developed with clinically relevant variables or those with a bivariate p-value <0.2 to control for confounders in evaluating the independent relationship between Sur1 and outcomes. No more than three variables were included in multiple regressions to avoid overfitting. Receiver Operating Characteristic (ROC) curves for these models were calculated. Tests were two-tailed and significance was determined by p-values <0.05. Post-hoc multiple comparisons were adjusted (Bonferroni’s correction). Tests were performed using Stata 13.1(StataCorp, TX).
RESULTS
Table 1A summarizes patient characteristics. There was a significant difference in age (p<0.001) and sex with 22/28 TBI vs 1/15 control patients being male (p<0.001). 134 CSF samples were obtained from 28 patients at five time-points (n=119) and controls (n=15).
Table 1.
Summary of (A) patient characteristics and (B) hypothesis testing (Student t-test for continuous variables, Fisher’s exact for categorical variables) and bivariate analyses for the association of factors with CT edema.
| Table 1A- Patient Characteristics | ||
|---|---|---|
|
| ||
| Severe TBI (n=28) | Controls (n=15) | |
| Age (median, range) | 28.5 (16–73) | 73 (51–88) |
| Sex - male: n (%) | 22 (78.6%) | 1 (6.7%) |
| Race - white: n (%) | 24 (85.7%) | 15 (100%) |
| Initial GCS: mean ±SE | 6 ±2 | NA |
| Mechanism of Injury: n (%) |
|
NA |
| Primary Bleed Pattern: n (%) |
|
NA |
| Table 1B: Factors associated with Acute CT edema | |||||
|---|---|---|---|---|---|
|
| |||||
| T-test (mean± SE) or Fisher’s Exact | Bivariate Logistic Regression for CT Edema (Y) | ||||
|
|
|
||||
| CT Edema (Y) | CT Edema (N) | p-value | Odds Ratio (OR) | p-value (95% CI) | |
|
|
|
||||
| Mean Sur1 | 4.96± 1.13 | 2.10± 0.34 | 0.02* | 1.70 | 0.06 (0.98–2.94) |
| Peak Sur1 | 9.81± 2.01 | 4.46± 0.59 | 0.02* | 1.32 | 0.06 (0.99–1.76) |
| Initial GCS | 4.75± 1.5 | 6.00± 1.5 | 0.04* | 0.59 | 0.05* (0.03–1.00) |
| Age | 35.4± 20.8 | 35.6± 18.3 | 0.98 | 1.00 | 0.98 (0.96–1.04) |
| Sex=F | - | - | 0.19 | 0.29 | 0.20 (0.042–1.92) |
| Initial ICP | 9.5± 5.2 | 10.1± 6.9 | 0.82 | 0.98 | 0.81 (0.87–1.12) |
Increased Sur1 after TBI
Sur1 levels differed between sTBI patients and controls (Figure 1A, p<0.001). CSF Sur1 was undetectable in all controls. In sTBI, mean Sur1 was 3.53±0.64 ng/ml and peak Sur1 was 7.13±1.15 ng/ml. Sur1 levels were available in 119/140 potential CSF samples (28 patients X 5 time points = 140 potential CSF samples). Sur1 was detectable as early as 9h post-injury and remained measurable over the first week, typically peaking at D2–3(42.5±6.24h), preceding edema development which mirrors this trajectory after a temporal delay(Figure 2A).
Figure 1.

A) Sur1 levels differed between patients with sTBI versus controls (p<0.001). The plot depicts the median (2.89 ng/ml) and inter-quartile range (1.32–3.97 ng/ml) of Sur1 in sTBI compared to the undetectable levels in controls. B) The difference in both mean (p=0.023) and peak (C, p=0.019) Sur1 levels between patients with and without edema on acute CT was statistically significant with higher levels noted in patients who had evidence of edema on acute CT. A higher presenting GCS score tended to decrease the odds of edema on acute CT (OR=0.59 95% CI 0.34–1.00, p=0.055, not shown).
Figure 2.
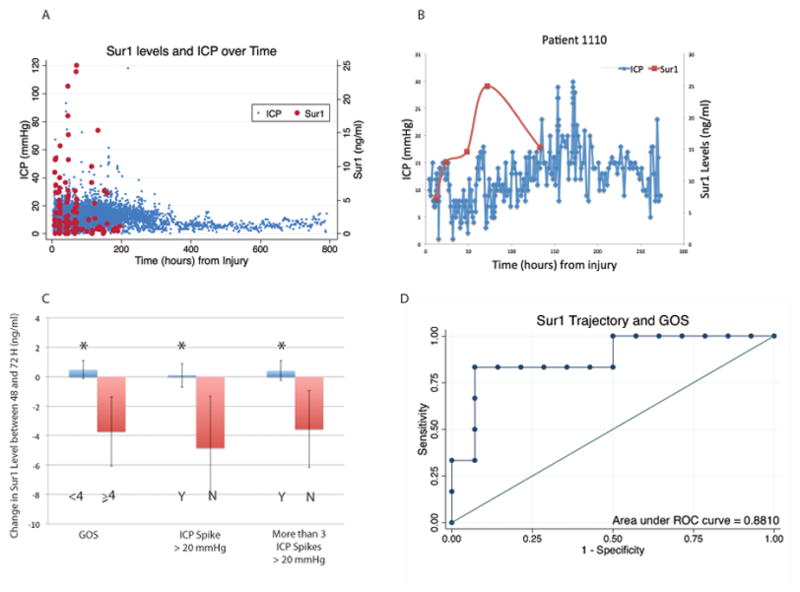
A) Aggregate measures of Sur1 and ICP over time demonstrate detectable Sur1 levels (red) by 9h from injury, peak at 48–72h and detectable up to 6–7 days post injury. Elevated ICP measurements (blue) lag Sur1 levels (p=0.089). B) Representative example (Patient 1110) showing ICP trend mimicking Sur1 pattern after a variable temporal delay C) Sur1 trajectories between 48 and 72h were associated with clinical outcomes and measures of CE by ICP: patients with good outcomes (GOS) had large declines in Sur1 (red, −3.73±2.33 ng/ml) vs. those with poor outcomes who had slight increases in Sur1 (blue, 0.48±0.61) (p=0.0268). Declining Sur1 levels during this time period were also associated with patients without any ICP spikes or <3 ICP spikes (red, −4.82±3.54 and −3.56±2.62ng/ml respectively) vs. those who had intracranial hypertension and Sur1 either increased slightly or minimally declined (blue, 0.10±0.80 p=0.0456, and 0.41±0.68 p=0.048 respectively). Area under ROC curves for models containing 48–72h Sur1 trajectory, initial GCS and edema on acute CT was 0.881 for GOS (D).
Sur1 is associated with CT edema
Inter-rater reliability was good (κ=0.79) and there was non-agreement in only 3 cases, requiring the input of a third (blinded) research assistant. Mean Sur1was higher in patients with edema on acute CT (4.96±1.13 ng/ml vs. 2.10±0.34 ng/ml, p=0.023, Table 1B, Figure 1B). Peak Sur1 was double in patients with CT edema (9.81±2.01 ng/ml versus 4.46±0.59 ng/ml, p=0.017, Table 1B, Figure 1C).
Sur1 timings/trajectories may inform CE and outcomes
(i) Sur1 is associated with initial degree of intracranial hypertension
The magnitude of the initial episode of intracranial hypertension (from time of injury) was positively correlated with mean (p=0.034) and peak (p=0.004) Sur1(Table 2). Sur1 detection did not always precede ICP elevation. In nine cases, the first ICP measurement >20 mmHg occurred before Sur1 detection suggesting that non-Sur1 related CE pathways likely predominated acutely. These ICP elevations were not peak measurements. The odds of having raised ICP before Sur1 detection was not influenced by hemorrhage pattern, initial GCS, age, or sex (Supplementary Table-1).
Table 2. Factors Associated with ICP.
Bivariate analyses of the relationship of mean and peak Sur1 levels with measures of elevated ICP. Mean and peak Sur1 levels are significantly linearly associated with the magnitude of the initial episode of intracranial hypertension (ICP measurement > 20 mmHg), but not associated with the proportion of ICP spikes, mean or peak ICP. CI indicates confidence interval. The β coefficient is the magnitude change in initial ICP measurement per unit change in the respective independent variable.
| Bivariate Analysis of ICP and Sur1 | ||||||||||||
|---|---|---|---|---|---|---|---|---|---|---|---|---|
| Magnitude of initial episode of intracranial hypertension | Proportion of ICP > 20 mmHg | Mean ICP | Peak ICP | |||||||||
|
|
|
|
|
|||||||||
| β | 95% CI | p | β | 95% CI | p | β | 95% CI | p | β | 95% CI | p | |
|
|
|
|
|
|||||||||
| Mean Sur1 | 1.37 | 0.11–2.63 | 0.034* | 6.33 | −5.40–18.06 | 0.27 | 0.16 | −0.27–0.60 | 0.44 | 0.24 | −2.79–3.27 | 0.87 |
| Peak Sur1 | 1.03 | 0.36–1.70 | 0.004* | 6.28 | −14.4–26.9 | 0.53 | −0.002 | −0.25–0.24 | 0.99 | −0.28 | −1.97–1.4 | 0.73 |
| Initial GCS | −0.96 | −3.94–2.02 | 0.51 | 0.008 | −0.02–0.036 | 0.58 | 0.48 | −0.41–1.38 | 0.28 | 2.94 | −3.31–9.19 | 0.34 |
| Age | 0.24 | 0.009–0.47 | 0.042* | 0.000 | −0.003–0.002 | 0.89 | −0.028 | −0.10–0.05 | 0.47 | −0.18 | −0.72–0.36 | 0.50 |
| Sex=F | - | - | 0.52 | 0.068 | −0.039–0.18 | 0.20 | 1.69 | −1.79–5.17 | 0.33 | 14.5 | −9.52–38.4 | 0.23 |
| CT edema | 7.25 | −1.44–17.0 | 0.11 | 0.029 | −0.062–0.12 | 0.52 | 0.45 | −2.49–3.38 | 0.76 | −4.56 | −24.9–15.8 | 0.65 |
(ii) Peak Sur1 precedes peak ICP
Based on preclinical models, we hypothesized that peak Sur1 levels would precede maximum CE (reflected by peak ICP). We aimed to determine the temporal delay between these two events since this might aid in stratifying high-risk patients and therapy timing.
Sur1 peaked by 42.5±6.24h and was mostly followed by peak ICP after a variable time interval. The correlation between time-to-peak Sur1 and ensuing time-to-peak ICP in all patients approached significance (Pearson’s ρ=0.33 weak, β-coefficient=0.61, p=0.089). Four patients had no ICPs>20 mmHg. In 22(91.7%) of the remaining patients, peak Sur1 preceded peak ICP. The delay for ensuing peak ICP from time of peak sur1 was 82.5±11.75h.
Examination of temporal Sur1 and ICP trends provided a more granular characterization and confirmed the aforementioned aggregate pattern where peak Sur1 was followed by peak ICP after a variable delay. Four categories of time-intervals between Sur1 and ICP peaks emerged that differed from one another (corrected p<0.005 for all groups, Supplementary-Figures 1A,2A–D). In many patients (Figure 2B) ICP trajectory and not just peak reflected the Sur1 pattern after a variable temporal interval.
(iii) Sur1 trajectories were associated with ICP elevation and outcomes
There was no association between mean/peak Sur1with mean/peak ICP, proportion of ICP measurements >20 mmHg(Table 2), use of edema-directed therapies, decompressive craniotomy, or 3-month GOS. Given the clinical variability of TBI, CE, and potential individual patient point values of Sur1 and sensitivities to this pathway, we hypothesized that Sur1 trajectory might better define intracranial hypertension development/resolution and outcomes (Supplementary Table-2). Sur1 trajectories between 48–72h revealed significant associations between GOS and edema (Figure 2C, Table 3). Precipitous declines in Sur1 were associated with favorable outcomes (3-month GOS≥4, p=0.0268). Patients with sTBI who had no episodes of intracranial hypertension during their ICU course had different Sur1 trajectories between 48–72h vs. patients with ICP spikes(p=0.0456). Sur1 in patients without intracranial hypertension declined during this time period (−4.82±3.54 ng/ml) vs the latter group where levels rose or decreased minimally (0.10±0.80 ng/ml). Similarly, patients with <3 ICP spikes had declining Sur1 between 48–72h (−3.56±2.62) vs those with multiple ICP measurements >20 mmHg(0.41±0.68, p=0.048). This trend was also noted in Sur1 level between 12–24h however was not statistically significant (Supplementary Table-2).
Table 3. Sur1 Trajectory and Outcomes.
Sur1 level changes (between 48–72H post-injury are associated with measures of CE and clinical outcomes. Patients with declining Sur1 levels between 48 and 72H did not have any ICP spikes > 20 mmHg (p=0.0456) and had good outcomes (p=0.0268). Multiple regression controlling for initial GCS score and acute CT edema supported these findings. As the trajectory of Sur1 levels (48h–72h) increased, the odds of elevated ICP tended to increase (p=0.090) and odds of good outcome tended to decrease (p=0.065). Declines in Sur1 during this time period were also associated with lower measures of CE such as having consecutive ICP spikes, > 10 measured ICP spikes, use of hypertonic saline, or any treatment specifically indicated for edema management - these trends did not attain statistical significance.
| Change in Sur1 Levels between 48H and 72H | |||||
|---|---|---|---|---|---|
|
| |||||
| T-test (mean ± SE) | p-value | Multiple Logistic Regression O.R | p-value (95% CI) | ||
|
|
|
||||
| Any ICP spike | N | −4.82 ± 3.54 | 0.046* | 1.26 (Y) | 0.090 (0.47–2.73) |
| Y | 0.10 ± 0.80 | ||||
| > 3 ICP spikes | N | −3.56 ± 2.62 | 0.048* | 1.23 (Y) | 0.15 (0.93–1.62) |
| Y | 0.41 ± 0.68 | ||||
| > 10 ICP spikes | N | −1.83 ± 1.40 | 0.16 | - | - |
| Y | 0.71 ± 0.99 | ||||
| Consecutive ICP spikes | N | −2.13 ± 1.57 | 0.13 | - | - |
| Y | 0.60 ± 0.92 | ||||
| Hypertonic Saline for Edema | N | −1.92 ± 1.39 | 0.13 | - | - |
| Y | 0.82 ± 0.98 | ||||
| Any Edema Targeting Treatment | N | −2.47 ± 1.74 | 0.09 | - | - |
| Y | 0.67 ± 0.79 | ||||
| GOS Score | ≥4 | −3.73 ± 2.33 | 0.03* | 0.67 (GOS ≥ 4) | 0.065 (0.44–1.03) |
| <4 | 0.48 ± 0.61 | ||||
Thus, rises or minimal changes in Sur1 between 48–72h were associated with ICP elevations and unfavorable outcomes, while declining Sur1 during this time period correlated with negligible/no intracranial hypertension and favorable outcomes. Area under ROC curves generated from regression models of Sur1 trajectory, initial GCS score and CT edema was 0.881 for dichotomized GOS(Figure 2D).
DISCUSSION
There have been many failed clinical TBI trials largely attributed to disease heterogeneity and lack of informative biomarkers(46, 47). CE is a common cause of in-hospital death in sTBI. A biomarker predicting its development might identify patients at-risk, evaluate disease progression, develop, target and monitor treatment and guide prognostication. Surprisingly, there are no clinically available CSF or circulating biomarkers for CE in TBI (akin to troponin levels). This could reflect recognition of challenges related to clinical variability of TBI pathology and the multiple molecular pathways involved. However, in truth, markers of CE have simply not been the focus of TBI biomarker development. Notwithstanding the challenges, the existence of different underlying mechanisms fundamental to edema generation presents an opportunity to develop biomarkers to categorize patients and guide individualized, molecularly-precise therapies. Such biomarkers could prove invaluable to management. While ICP-monitoring has been a cornerstone, it alone is insufficient to guide therapy(12). ICP measurements in isolation do not reflect differences in the subtypes of edema that may require different approaches(12). Supportive data from imaging, neurological-examinations, and biomarkers are valuable adjuncts. Sur1 is a promising and novel target: it has a pathophysiologic basis-its role in a specific pathway of CE is established in animal models(29–31), its upregulation is specific to CNS injury and is seen in human contusions(29, 32, 42), and inhibition of this receptor by Glibenclamide in animal models and early clinical trials in ischemic stroke has reduced the development of edema and improved outcomes(29–31, 41).
This study is exploratory and hypothesis generating. It has 4 central findings that strengthen the hypothesis of Sur1 as a useful biomarker in TBI to predict/monitor CE: 1) Sur1 was present in TBI but undetectable in controls- this finding links prior pre-clinical work and pathophysiology to human studies, 2) Mean and peak Sur1 levels were correlated with signs of edema on acute CT 3) there was a temporal delay between peak Sur1 and peak ICP and 4) declining Sur1 at 48–72h was associated with less odds of intracranial hypertension and greater odds of favorable outcomes. Our data may also inform on preventative therapeutic windows and identify patients at-risk for edema development. However, this is tempered by a lack of association between mean/peak Sur1 and mean/peak ICP, proportion of ICP > 20 mmHg, use of edema-directed therapies, decompressive craniotomy or 3 month Glasgow Outcome Score. This may reflect the limited sample size/power, patient-specific differences in degrees of receptor expression/sensitivity, and/or genetic variability(48, 49). It is also possible that, particularly given the complexity of cerebral edema in TBI, mean/peak Sur1 levels over 5 days do not provide the adequate granularity with which to evaluate associations with cerebral edema or outcomes- many other biomarkers (such as troponins, or creatinine levels) are followed at more frequent temporal intervals. Other limitations include varying treatment strategies/intensities. Given the multiple pathways implicated in edema generation, in some patients alternative mechanisms may supersede and/or complement Sur1.
Sur1 and radiographic edema
Edema on acute CT was associated with the degree of initial ICP elevation. However, the continued use of serial surveillance CTs is less practical than a CSF biomarker for reasons including radiation exposure, transport-related complications, and artifact. Moreover, CT is not quantitative, nor is it useful for predicting development or timing of intracranial hypertension but rather is obtained in response to elevated ICPs or clinical deteriorations. A biomarker to reduce CT scan frequency and assist with early identification, monitoring and treatment of TBI patients likely to develop CE could improve care. We sought to determine whether there was a correlation between Sur1 and CT edema to lay the foundation for future studies to evaluate whether monitoring Sur1 could represent an adjunctive index.
We observed an association between Sur1 and CE on acute CT. Thus, the Sur1 pathway may provide one pathophysiologic explanation for subsequent raised ICP in some patients. If validated in larger studies, Sur1 could represent a therapeutic target in a subgroup of patients with sTBI. Our exploratory data provide groundwork for future research addressing issues such as patient stratification and prognostication, phenotyping for evaluation of efficacy of agents targeting the Sur1 pathway, and/or utility of CSF Sur1 as an adjunct in decision making for current therapies targeting brain edema.
Sur1, clinical edema, and outcomes
Mean and peak Sur1 levels were associated with the magnitude of the initial episode of intracranial hypertension. This measure of ICP is the least contaminated by treatments. Mean/peak Sur1 levels were not associated with multiple other measures of edema or outcomes as discussed above.
Sur1 timing, clinical edema, and outcomes
Multiple molecular pathways likely regulate the development of CE. Nine patients had intracranial hypertension before Sur1 detection. This could reflect peri-contusional edema from vasogenic swelling, mass effect, and/or increased tissue osmolality(8, 9). Conversely, cellular edema can begin as early as 40–60 min post injury and continue for 7–14 days(7, 8). The time taken for Sur1 to peak preceded peak ICP measurements in 91.7% of patients, supporting the theory that this pathway may mediate edema development. Early increases in CSF Sur1 may portend intracranial hypertension to follow over the subsequent 24–100h. As ICP increases, Sur1 levels decrease- possibly due to an evolutionary protective feedback mechanism although additional study is needed to address this possibility.
Sur1 trajectory, clinical edema, and outcomes
Sur1 trajectory between 48–72h correlated with edema and outcome. Declining levels were associated with favorable outcomes and less or no episodes of intracranial hypertension. None of the patients with declining Sur1 at 48–72h had any episodes of intracranial hypertension despite sTBI requiring ICP monitoring. This differed from the trajectory of patients who did. These findings were significant for clinical outcomes and two measures of intracranial hypertension, and approached significance for multiple other measures of edema and multivariate analyses controlling for GCS score and CT edema. Our data do not prove causality and a key outcome lacking is an assessment of therapeutic intensity level. Nonetheless, if confirmatory studies reproduce our findings, monitoring Sur1 trajectories may aid in identifying patients with escalating vs improving edema, and help guide therapies.
Limitations
Our study is single-center and associative. Although our results are supported by pre-clinical data, the relationship of Sur1 to CE may be an epiphenomenon. The mechanism by which Sur1 becomes detectable in CSF remains unclear, as is its source- although not the focus of this paper, this warrants exploration.
Sur1 levels at injury were not obtainable, and 12h Sur1 was unavailable in 10 patients. The use of ICP as a proxy for CE is imperfect. Moreover, hourly ICP measurements do not account for simultaneous exposures to other treatments that may temporarily elevate the recordings regardless of CE (such as painful procedures, or timing of tracheal suctioning). Although there is equipoise regarding the use of continuous CSF drainage for ICP management (50), it is our standard and may have underestimated the degree of brain swelling, (50) limiting our ability to detect associations between Sur1 levels/trajectories with ICP. Fortunately this reduces the likelihood of a falsely positive relationship.
Notwithstanding an existing ICP-treatment protocol, practitioner preferences could introduce misclassification bias. Use of a validated measure such as ‘Therapeutic Intensity Level’(51) was unavailable and warrants investigation in larger studies. Nonetheless, declining Sur1 trajectory between 48–72H was significantly associated with no intracranial hypertension regardless of the underlying etiology (therapeutic maneuvers or spontaneous resolution)-suggesting the potential value of Sur1 in ICP resolution either in response to therapeutic maneuvers or spontaneous improvement.
There was an age and sex difference between patients and controls, potentially confounding the results-however control samples from a cohort of eight pediatric patients (50% male, unpublished) also had undetectable Sur1. Given this absence of Sur1 in control CSF, it is highly unlike that the observed differences in Sur1 between TBI and controls were related to age or sex differences.
CONCLUSIONS
Burgeoning medical technologies and genetic/molecular markers are increasingly allowing for targeted/individualized therapies in many fields. No such markers are available to evaluate CE in sTBI. Given the pathophysiologic pathway elucidated by pre-clinical models and its potential as a therapeutic focus, Sur1 is an appealing target to begin complementing traditional measures of edema like ICP and CT with molecular biomarkers. To our knowledge, this is the first report quantifying human CSF Sur1. Levels were detected in all patients with sTBI but undetectable in all controls and mean and peak Sur1 levels correlated with edema on CT. We showed a relationship between timing of Sur1 upregulation and development of peak ICP. Although there was no association between absolute values of mean/peak Sur1 with several measures of cerebral edema, declining Sur1 trajectory particularly between 48–72h may anticipate edema resolution. Monitoring Sur1 trajectory may therefore be a useful, patient-specific, adjunct to ICP and inform timing of therapy and need for additional resource intensity. It is also possible that Sur1 levels may provide information about patients who are more or less likely to respond to a therapy inhibiting this pathway. Since an existing inhibitor of Sur1 (Glibenclamide) is being evaluated in clinical trials and appears to potentially prevent brain edema in susceptible patients, larger studies validating our preliminary findings of the relationships between Sur1, CE and outcomes are warranted.
Supplementary Material
Supplementary Figure 1: The time lags between peak Sur1 level and peak ICP can be categorized into 24h, 48h, 72h and 100h as shown by the bar chart (B)- the time lag for each group is statistically significantly different from every other (p<0.005) after adjusting for multiple comparisons with Bonferroni’s correction.
Supplementary Figure 2: Representative examples of individual patient plots of Sur1 levels (connected scatter, ng/ml, red), ICP measurements (connected scatter, mmHg, green) and ICP trends (median spline, blue) versus time from injury (hours). Patients appeared to have temporal delays of approximately 24 (A), 48 (B), 72 (C) or 100 (D) hours between peak Sur1 and peak ICP periods (the latter determined by the median spline curve peaks).
Supplementary Figure 3: Standard curve for the Sur1 ELISA. Sur1 sample concentrations obtained were on the linear portion of the curve.
Acknowledgments
We are grateful to NIH Grants #: T-32HL007820, KL2 TR000146 and NIH/NINDS K23-NS073806 for their generous support.
Footnotes
Author contributions: R.M.J and P.M.K conceived the study. R.M.J, A.P, S.H.C., J.W., B.J.M., L.A.S., S.M.P., D.O.O., and P.M.K. contributed to the study design. K.L.J-F performed the CSF analyses. A.P., S.H.C., and D.O.O. enrolled the patients/controls and obtained CSF samples. S.H.C., B.E.Z., A.P and D.O.O. obtained demographic information, clinical variables, imaging analysis and outcome measures for patients/controls. R.M.J. and C.C.H.C. performed the statistical analyses. R.M.J. wrote the article. A.P., S.H.C., J.W., B.J.M., B.E.Z., L.A.S., S.M.P., D.O.O. and P.M.K. critically edited the article.
Copyright form disclosures:
Dr. Jha received support for article research from the National Institutes of Health (NIH). She disclosed other support: 1) Dr. Molyneaux is a site PI for GAMES-RP - a Remedy Pharmaceuticals funded study of Glibenclamide for malignant edema in stroke. There are no other relevant conflicts of interests of authors. 2) Dr. Chou is a board member of the Neurocritical Care Society (no payment received). 3) Dr. Chou has taught a workshop on acute stroke at the American Academy of Neurology. 4) Dr. Chou is a clinical endpoint committee member for Novartis. 5) Dr. Chou has an American Heart Association grant 10CRP2610341. 6) Drs. Puccio and Okonkwo have multiple grants that were not used to support this research [US Army W81XWH-10-1-0623 and WH81XWH-14-2-0018; NIH T- 32HL007820; NIH KL2 TR000146; NIH/NINDS K23-NS073806]. 7) Dr. Kochanek has multiple NIH and US army grants that were not used in this study. He has served as an expert witness on several cases over the past 36 months and received honoraria for numerous lectures at national meetings and/or as a guest professor at various institutions of higher education. Dr. Kochanek has received royalties for editing and authoring books and/or chapters (Elsevier, Wolters Kluwer), and has a provisional patent application filed 2/6/2015 Berger R, Kochanek P, Pak BJ, Smith PT, Kolesnikova MD Compositions and methods for identifying subjects at risk for traumatic brain injury Serial No: 62/113,292. Dr. Kochanek receives a stipend for serving as the editor of the journal Pediatric Critical Care Medicine. Her institution received funding from an NIH Grant (#T-32HL007820), from KL2 TR000146, and from NIH/NINDS K23-NS073806. Dr. Puccio received support for article research from the NIH. Dr. Chou received support for article research from the NIH. Her institution received support for article research from the NIH/NINDS (K23 award). Dr. Molyneaux’s institution received funding from the Remedy Pharmaceuticals for travel costs not related to current study. Dr. Zusman received two research stipends from the University of Pittsburgh Honors College for work unrelated to this submission and received support for article research from the NIH, the US Army, and the NINDS. He disclosed other support (His institution received one additional grant from the NIH and an additional grant from the US Army). His institution received funding from the US Army, the NIH, and the NIH/NINDS. Dr. Shutter received support for article research from the NIH and received funding from Gutglass Law Firm (expert testimony in a case not related to this work). She disclosed other support (Dr. Shutter: multiple grants that were not used to support this research: NIH/NINDS 1U10NS069498, NIH/NINDS 5410NS08371-03, NIH 1R01NR014221- 01A, DOD W81XWH-13-2-0079, USAMRMC W81XWH-14-2-0002). Her institution received support from the NIH (Grant #: T-32HL007820, NIH Institutional Grant KL2 TR000146, and NIH/NINDS K23-NS073806). Dr. Poloyac disclosed other support (He has received honoraria for lectures at national and regional pharmacy association meetings). His institution received funding (Dr. Poloyac is funded as a co-investigator on multiple NIH and a US army grant that was not used in this study). Dr. Kochanek disclosed other support (He is Editor in Chief for Pediatric Critical Care Medicine, received support from NIH and US Army [although not specifically for this work], and work as an expert witness although not specifically related to this research). The remaining authors have disclosed that they do not have any potential conflicts of interest.
Potential Conflicts of Interest: Dr. Bradley Molyneaux was a site PI for GAMES-RP - a Remedy Pharmaceuticals funded study of Glibenclamide for malignant edema in stroke. There are no other relevant conflicts of interests of authors. All other non-related commercial interests of authors have been disclosed in the ICMJE Conflict of Interest forms filed individually by each author.
References
- 1.Feldmann H, Klages G, Gärtner F, et al. The prognostic value of intracranial pressure monitoring after severe head injuries. Acta Neurochir Suppl (Wien) 1979;28:74–77. doi: 10.1007/978-3-7091-4088-8_15. [DOI] [PubMed] [Google Scholar]
- 2.Feickert HJ, Drommer S, Heyer R. Severe head injury in children: impact of risk factors on outcome. J Trauma. 1999;47:33–38. doi: 10.1097/00005373-199907000-00008. [DOI] [PubMed] [Google Scholar]
- 3.Miller JD, Becker DP, Ward JD, et al. Significance of intracranial hypertension in severe head injury. J Neurosurg. 1977;47:503–516. doi: 10.3171/jns.1977.47.4.0503. [DOI] [PubMed] [Google Scholar]
- 4.Saul TG, Ducker TB. Effect of intracranial pressure monitoring and aggressive treatment on mortality in severe head injury. J Neurosurg. 1982;56:498–503. doi: 10.3171/jns.1982.56.4.0498. [DOI] [PubMed] [Google Scholar]
- 5.Eisenberg HM, Gary HE, Aldrich EF, et al. Initial CT findings in 753 patients with severe head injury. A report from the NIH Traumatic Coma Data Bank. J Neurosurg. 1990;73:688–698. doi: 10.3171/jns.1990.73.5.0688. [DOI] [PubMed] [Google Scholar]
- 6.Narayan RK, Kishore PR, Becker DP, et al. Intracranial pressure: to monitor or not to monitor? A review of our experience with severe head injury. J Neurosurg. 1982;56:650–659. doi: 10.3171/jns.1982.56.5.0650. [DOI] [PubMed] [Google Scholar]
- 7.Barzó P, Marmarou A, Fatouros P, et al. Contribution of vasogenic and cellular edema to traumatic brain swelling measured by diffusion-weighted imaging. J Neurosurg. 1997;87:900–907. doi: 10.3171/jns.1997.87.6.0900. [DOI] [PubMed] [Google Scholar]
- 8.Marmarou A, Signoretti S, Fatouros PP, et al. Predominance of cellular edema in traumatic brain swelling in patients with severe head injuries. J Neurosurg. 2006;104:720–730. doi: 10.3171/jns.2006.104.5.720. [DOI] [PubMed] [Google Scholar]
- 9.Katayama Y, Mori T, Maeda T, et al. Pathogenesis of the mass effect of cerebral contusions: rapid increase in osmolality within the contusion necrosis. Acta Neurochir Suppl. 1998;71:289–292. doi: 10.1007/978-3-7091-6475-4_84. [DOI] [PubMed] [Google Scholar]
- 10.Walcott BP, Kahle KT, Simard JM. Novel Treatment Targets for Cerebral Edema. Neurotherapeutics. 2011;9:65–72. doi: 10.1007/s13311-011-0087-4. [DOI] [PMC free article] [PubMed] [Google Scholar]
- 11.Unterberg AW, Stover J, Kress B, et al. Edema and brain trauma. Neuroscience. 2004;129:1019–1027. doi: 10.1016/j.neuroscience.2004.06.046. [DOI] [PubMed] [Google Scholar]
- 12.Chesnut RM, Temkin N, Carney N, et al. A Trial of Intracranial-Pressure Monitoring in Traumatic Brain Injury. N Engl J Med. 2012;367:2471–2481. doi: 10.1056/NEJMoa1207363. [DOI] [PMC free article] [PubMed] [Google Scholar]
- 13.Rosenberg GA, Estrada EY, Dencoff JE. Matrix metalloproteinases and TIMPs are associated with blood-brain barrier opening after reperfusion in rat brain. Stroke. 1998;29:2189–2195. doi: 10.1161/01.str.29.10.2189. [DOI] [PubMed] [Google Scholar]
- 14.Rosenberg GA, Navratil M. Metalloproteinase inhibition blocks edema in intracerebral hemorrhage in the rat. Neurology. 1997;48:921–926. doi: 10.1212/wnl.48.4.921. [DOI] [PubMed] [Google Scholar]
- 15.Sood RR, Taheri S, Candelario-Jalil E, et al. Early beneficial effect of matrix metalloproteinase inhibition on blood-brain barrier permeability as measured by magnetic resonance imaging countered by impaired long-term recovery after stroke in rat brain. J Cereb Blood Flow Metab. 2008;28:431–438. doi: 10.1038/sj.jcbfm.9600534. [DOI] [PMC free article] [PubMed] [Google Scholar]
- 16.Wang J, Tsirka SE. Neuroprotection by inhibition of matrix metalloproteinases in a mouse model of intracerebral haemorrhage. Brain. 2005;128:1622–1633. doi: 10.1093/brain/awh489. [DOI] [PubMed] [Google Scholar]
- 17.Shigemori Y, Katayama Y, Mori T, et al. Matrix metalloproteinase-9 is associated with blood-brain barrier opening and brain edema formation after cortical contusion in rats. Acta Neurochir Suppl. 2006;96:130–133. doi: 10.1007/3-211-30714-1_29. [DOI] [PubMed] [Google Scholar]
- 18.Kawai N, Kawanishi M, Okada M, et al. Treatment of cold injury-induced brain edema with a nonspecific matrix metalloproteinase inhibitor MMI270 in rats. J Neurotrauma. 2003;20:649–657. doi: 10.1089/089771503322144563. [DOI] [PubMed] [Google Scholar]
- 19.Hadass O, Tomlinson BN, Gooyit M, et al. Selective inhibition of matrix metalloproteinase-9 attenuates secondary damage resulting from severe traumatic brain injury. PLoS ONE. 2013;8:e76904. doi: 10.1371/journal.pone.0076904. [DOI] [PMC free article] [PubMed] [Google Scholar]
- 20.Papadopoulos MC, Verkman AS. Aquaporin-4 and brain edema. Pediatr Nephrol. 2007;22:778–784. doi: 10.1007/s00467-006-0411-0. [DOI] [PMC free article] [PubMed] [Google Scholar]
- 21.Papadopoulos MC, Papadopoulos MC, Manley GT, et al. Aquaporin-4 facilitates reabsorption of excess fluid in vasogenic brain edema. FASEB J. 2004;18:1291–1293. doi: 10.1096/fj.04-1723fje. [DOI] [PubMed] [Google Scholar]
- 22.Kimbler DE, Shields J, Yanasak N, et al. Activation of P2X7 promotes cerebral edema and neurological injury after traumatic brain injury in mice. PLoS ONE. 2012;7:e41229. doi: 10.1371/journal.pone.0041229. [DOI] [PMC free article] [PubMed] [Google Scholar]
- 23.Qing WG, Dong YQ, Ping TQ, et al. Brain edema after intracerebral hemorrhage in rats: the role of iron overload and aquaporin 4. J Neurosurg. 2009;110:462–468. doi: 10.3171/2008.4.JNS17512. [DOI] [PubMed] [Google Scholar]
- 24.Tang Y, Wu P, Su J, et al. Effects of Aquaporin-4 on edema formation following intracerebral hemorrhage. Experimental Neurology. 2010;223:485–495. doi: 10.1016/j.expneurol.2010.01.015. [DOI] [PubMed] [Google Scholar]
- 25.Lopez-Rodriguez AB, Acaz-Fonseca E, Viveros M-P, et al. Changes in cannabinoid receptors, aquaporin 4 and vimentin expression after traumatic brain injury in adolescent male mice. Association with edema and neurological deficit. PLoS ONE. 2015;10:e0128782. doi: 10.1371/journal.pone.0128782. [DOI] [PMC free article] [PubMed] [Google Scholar]
- 26.Yao X, Uchida K, Papadopoulos MC, et al. Mildly Reduced Brain Swelling and Improved Neurological Outcome in Aquaporin-4 Knockout Mice Following Controlled Cortical Impact Brain Injury. J Neurotrauma. 2015 doi: 10.1089/neu.2014.3675. [DOI] [PMC free article] [PubMed] [Google Scholar]
- 27.Laird MD, Shields JS, Sukumari-Ramesh S, et al. High mobility group box protein-1 promotes cerebral edema after traumatic brain injury via activation of toll-like receptor 4. Glia. 2014;62:26–38. doi: 10.1002/glia.22581. [DOI] [PMC free article] [PubMed] [Google Scholar]
- 28.Okuma Y, Liu K, Wake H, et al. Anti-high mobility group box-1 antibody therapy for traumatic brain injury. Ann Neurol. 2012;72:373–384. doi: 10.1002/ana.23602. [DOI] [PubMed] [Google Scholar]
- 29.Simard JM, Chen M, Tarasov KV, et al. Newly expressed SUR1-regulated NC(Ca-ATP) channel mediates cerebral edema after ischemic stroke. Nat Med. 2006;12:433–440. doi: 10.1038/nm1390. [DOI] [PMC free article] [PubMed] [Google Scholar]
- 30.Patel AD, Meriggioli MN, Sanders DB, et al. Glibenclamide reduces hippocampal injury and preserves rapid spatial learning in a model of traumatic brain injury. J Neuropathol Exp Neurol. 2010;69:1177–1190. doi: 10.1097/NEN.0b013e3181fbf6d6. [DOI] [PubMed] [Google Scholar]
- 31.Simard JM, Kilbourne M, Tsymbalyuk O, et al. Key role of sulfonylurea receptor 1 in progressive secondary hemorrhage after brain contusion. J Neurotrauma. 2009;26:2257–2267. doi: 10.1089/neu.2009.1021. [DOI] [PMC free article] [PubMed] [Google Scholar]
- 32.Simard JM, Woo SK, Schwartzbauer GT, et al. Sulfonylurea receptor 1 in central nervous system injury: a focused review. J Cereb Blood Flow Metab. 2012;32:1699–1717. doi: 10.1038/jcbfm.2012.91. [DOI] [PMC free article] [PubMed] [Google Scholar]
- 33.Zweckberger K, Hackenberg K, Jung CS, et al. Glibenclamide reduces secondary brain damage after experimental traumatic brain injury. Neuroscience. 2014;272:199–206. doi: 10.1016/j.neuroscience.2014.04.040. [DOI] [PubMed] [Google Scholar]
- 34.Simard JM, Kahle KT, Gerzanich V. Molecular mechanisms of microvascular failure in central nervous system injury--synergistic roles of NKCC1 and SUR1/TRPM4. J Neurosurg. 2010;113:622–629. doi: 10.3171/2009.11.JNS081052. [DOI] [PMC free article] [PubMed] [Google Scholar]
- 35.Jayakumar AR, Panickar KS, Curtis KM, et al. Na-K-Cl cotransporter-1 in the mechanism of cell swelling in cultured astrocytes after fluid percussion injury. Journal of Neurochemistry. 2011;117:437–448. doi: 10.1111/j.1471-4159.2011.07211.x. [DOI] [PubMed] [Google Scholar]
- 36.Kiening KL, van Landeghem FKH, Schreiber S, et al. Decreased hemispheric Aquaporin-4 is linked to evolving brain edema following controlled cortical impact injury in rats. Neuroscience Letters. 2002;324:105–108. doi: 10.1016/s0304-3940(02)00180-5. [DOI] [PubMed] [Google Scholar]
- 37.Liang F, Luo C, Xu G, et al. Deletion of aquaporin-4 is neuroprotective during the acute stage of micro traumatic brain injury in mice. Neuroscience Letters. 2015;598:29–35. doi: 10.1016/j.neulet.2015.05.006. [DOI] [PubMed] [Google Scholar]
- 38.Chen M, Dong Y, Simard JM. Functional coupling between sulfonylurea receptor type 1 and a nonselective cation channel in reactive astrocytes from adult rat brain. J Neurosci. 2003;23:8568–8577. doi: 10.1523/JNEUROSCI.23-24-08568.2003. [DOI] [PMC free article] [PubMed] [Google Scholar]
- 39.Woo SK, Kwon MS, Ivanov A, et al. The Sulfonylurea Receptor 1 (Sur1)-Transient Receptor Potential Melastatin 4 (Trpm4) Channel. J Biol Chem. 2013;288:3655–3667. doi: 10.1074/jbc.M112.428219. [DOI] [PMC free article] [PubMed] [Google Scholar]
- 40.Chen M, Simard JM. Cell swelling and a nonselective cation channel regulated by internal Ca2+ and ATP in native reactive astrocytes from adult rat brain. J Neurosci. 2001;21:6512–6521. doi: 10.1523/JNEUROSCI.21-17-06512.2001. [DOI] [PMC free article] [PubMed] [Google Scholar]
- 41.Sheth K, Elm J, Hinson H, et al. GAMES (Glyburide Advantage in Malignant Edema and Stroke) RP: A Phase II Study Toward Preventing Edema After Ischemia (S7. 004) Neurology. 2016 [Google Scholar]
- 42.Martínez-Valverde T, Vidal-Jorge M, Martinez-Saez E, et al. Sulfonylurea Receptor 1 in Humans with Post-Traumatic Brain Contusions. Journal of Neurotrauma. 2015;32:1478–1487. doi: 10.1089/neu.2014.3706. [DOI] [PMC free article] [PubMed] [Google Scholar]
- 43.Kerr ME, Ilyas Kamboh M, Yookyung K, et al. Relationship between apoE4 allele and excitatory amino acid levels after traumatic brain injury. Critical Care Medicine. 2003;31:2371–2379. doi: 10.1097/01.CCM.0000080484.72004.C4. [DOI] [PubMed] [Google Scholar]
- 44.Eisenberg HM, Gary HE, Aldrich EF, et al. Initial CT findings in 753 patients with severe head injury. A report from the NIH Traumatic Coma Data Bank. J Neurosurg. 1990;73:688–698. doi: 10.3171/jns.1990.73.5.0688. [DOI] [PubMed] [Google Scholar]
- 45.Miller MT, Pasquale M, Kurek S, et al. Initial head computed tomographic scan characteristics have a linear relationship with initial intracranial pressure after trauma. Journal of Trauma and Acute Care Surgery. 2004;56:967–973. doi: 10.1097/01.ta.0000123699.16465.8b. [DOI] [PubMed] [Google Scholar]
- 46.Schwamm LH. Progesterone for traumatic brain injury--resisting the sirens’ song. N Engl J Med. 2014;371:2522–2523. doi: 10.1056/NEJMe1412951. [DOI] [PubMed] [Google Scholar]
- 47.Saatman KE, Duhaime A-C, Bullock R, et al. Classification of traumatic brain injury for targeted therapies. J Neurotrauma. 2008;25:719–738. doi: 10.1089/neu.2008.0586. [DOI] [PMC free article] [PubMed] [Google Scholar]
- 48.Dardiotis E, Paterakis K, Tsivgoulis G, et al. AQP4 Tag Single Nucleotide Polymorphisms in Patients with Traumatic Brain Injury. J Neurotrauma. 2014;31:1920–1926. doi: 10.1089/neu.2014.3347. [DOI] [PMC free article] [PubMed] [Google Scholar]
- 49.Dardiotis E, Fountas KN, Dardioti M, et al. Genetic association studies in patients with traumatic brain injury. Neurosurg Focus. 2010;28:E9. doi: 10.3171/2009.10.FOCUS09215. [DOI] [PubMed] [Google Scholar]
- 50.Nwachuku EL, Puccio AM, Fetzick A, et al. Intermittent versus continuous cerebrospinal fluid drainage management in adult severe traumatic brain injury: assessment of intracranial pressure burden. Neurocrit Care. 2014;20:49–53. doi: 10.1007/s12028-013-9885-3. [DOI] [PubMed] [Google Scholar]
- 51.Marion DW, Obrist WD, Carlier PM, et al. The use of moderate therapeutic hypothermia for patients with severe head injuries: a preliminary report. J Neurosurg. 1993;79:354–362. doi: 10.3171/jns.1993.79.3.0354. [DOI] [PubMed] [Google Scholar]
Associated Data
This section collects any data citations, data availability statements, or supplementary materials included in this article.
Supplementary Materials
Supplementary Figure 1: The time lags between peak Sur1 level and peak ICP can be categorized into 24h, 48h, 72h and 100h as shown by the bar chart (B)- the time lag for each group is statistically significantly different from every other (p<0.005) after adjusting for multiple comparisons with Bonferroni’s correction.
Supplementary Figure 2: Representative examples of individual patient plots of Sur1 levels (connected scatter, ng/ml, red), ICP measurements (connected scatter, mmHg, green) and ICP trends (median spline, blue) versus time from injury (hours). Patients appeared to have temporal delays of approximately 24 (A), 48 (B), 72 (C) or 100 (D) hours between peak Sur1 and peak ICP periods (the latter determined by the median spline curve peaks).
Supplementary Figure 3: Standard curve for the Sur1 ELISA. Sur1 sample concentrations obtained were on the linear portion of the curve.