Abstract
The human σ1 receptor is an enigmatic ER-resident transmembrane protein implicated in a variety of disorders including depression, drug addiction, and neuropathic pain1. Recently, an additional connection to amyotrophic lateral sclerosis (ALS) has emerged from studies of human genetics and mouse models2. Unlike many transmembrane receptors that belong to large, extensively studied families such as G protein-coupled receptors or ligand-gated ion channels, the σ1 receptor is an evolutionary isolate with no discernible similarity to any other human protein. Despite its increasingly clear importance in human physiology and disease, the molecular architecture of the σ1 receptor and its regulation by drug-like compounds remain poorly defined. Here, we report crystal structures of the human σ1 receptor in complex with two chemically divergent ligands, PD144418 and 4-IBP. The structures reveal a trimeric architecture with a single transmembrane domain in each protomer. The carboxy-terminal domain of the receptor shows an extensive flat, hydrophobic membrane-proximal surface, suggesting an intimate association with the cytosolic surface of the ER membrane in cells. This domain includes a cupin-like β-barrel with the ligand-binding site buried at its center. This large, hydrophobic ligand-binding cavity shows remarkable plasticity in ligand recognition, binding the two ligands in similar positions despite dissimilar chemical structures. Taken together, these results reveal the overall architecture, oligomerization state, and molecular basis for ligand recognition by this important but poorly understood protein.
The development of radiolabeled opiates in the 1960s and 1970s led to the discovery that the effects of these drugs are mediated by specific receptor sites with discrete pharmacological properties3. These receptors were divided into four classes based their ligand binding properties and tissue distribution, leading to the concept of μ (morphine), δ (vas deferens), κ (ketazocine), and σ (SKF-10047) opioid receptor subtypes. Pharmacological studies suggested μ, δ, and κ receptors were closely related to one another, while the σ receptor was shown to be distinct. Unlike canonical opioid receptors, the σ1 receptor shows negligible affinity for naloxone and naltrexone. In addition, it exhibits a marked preference for the (+)-enantiomers of benzomorphan drugs while canonical opioid receptors bind with high affinity only to the (−)-enantiomers4. In 1995, the molecular cloning of the σ1 receptor confirmed definitively that the receptor is dissimilar in sequence from the true opioid receptors5. The σ1 receptor plays a key role in human physiology, and has been shown to modulate a variety of diseases of the cardiovascular and nervous system6. Of particular note, a point mutation in this receptor was identified as a cause of juvenile-onset amyotrophic lateral sclerosis (ALS) in humans7, and mouse studies further support a role in the progression of this disease8. Other important research has suggested a role for the σ1 receptor as an ER chaperone protein and regulator of calcium signaling9, and it has been reported to regulate the activity of various ion channels10 and GPCRs11.
Despite the increasingly apparent importance of the σ1 receptor in human physiology, remarkably little is known regarding its structure and the details of its function at the molecular level. Even the overall topology of the receptor has remained in doubt, with single-pass12 and two-pass13 transmembrane architectures proposed. To address the gap in structural information surrounding the σ1 receptor, we undertook biochemical and crystallographic studies to elucidate its structure in complex with two distinct ligands. A receptor construct bearing an amino-terminal FLAG tag was expressed in Sf9 insect cells and purified in detergent (Extended Data Figure 1). Using lipidic cubic phase crystallization we obtained crystals and used experimental phasing with tantalum bromide clusters to solve a 2.5 Å resolution structure of the σ1 receptor bound to PD144418, a high-affinity and selective σ1 antagonist14,15. A similar approach also enabled structure determination for σ1 receptor bound to a second ligand16, 4-IBP, at 3.2 Å resolution (Extended Data Table 1; Extended Data Figure 2). 4-IBP has an incompletely understood efficacy profile, with functional properties suggestive of either agonist or inverse agonist activity17.
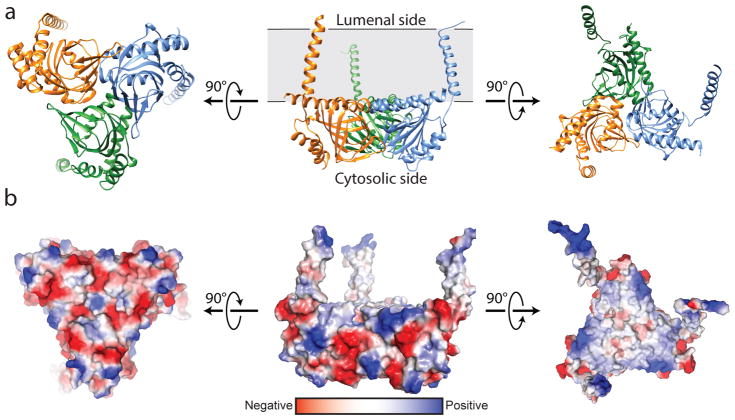
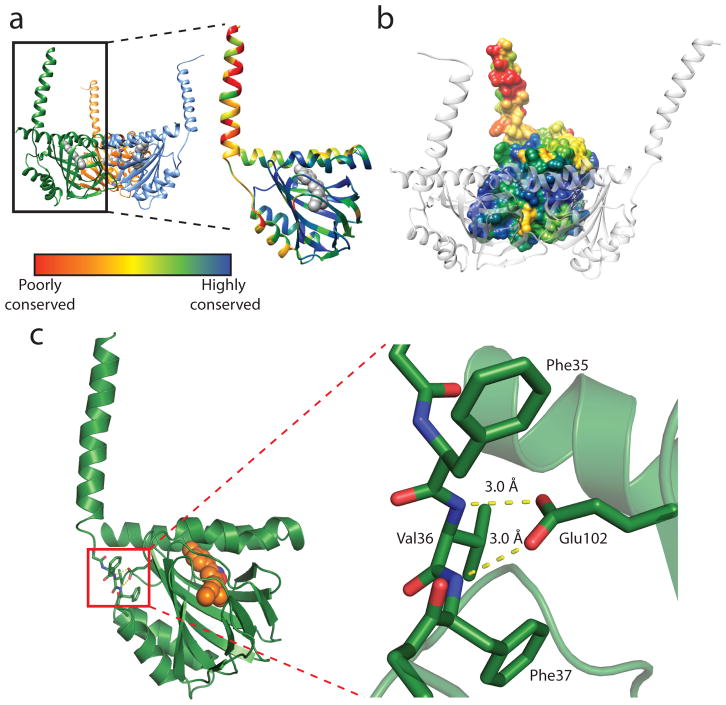
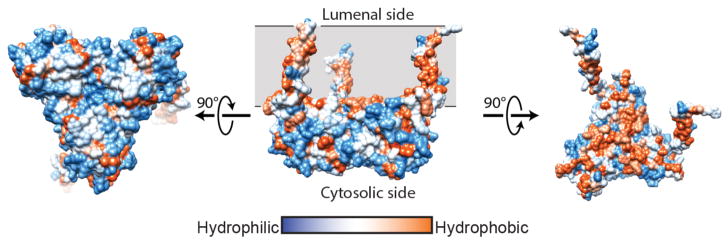
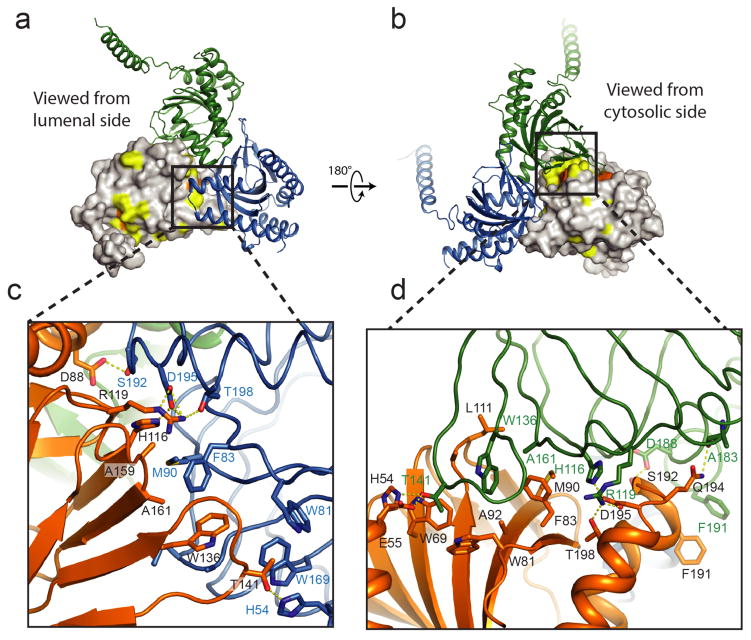
The overall structure of the σ1 receptor reveals a trimeric organization with a three-fold non-crystallographic symmetry axis normal to the membrane plane (Figure 1a). The receptor contains only a single transmembrane domain for each protomer, contrary to the prevailing models of a two-pass transmembrane architecture. The carboxy-terminal membrane-adjacent domains mediate the trimeric structure of the receptor, packing closely together with an interface of ~9300 Å2 between each adjacent pair of protomers. In contrast, the three transmembrane helices are widely separated from one another, located at each corner of the triangular trimer where they mediate lattice contacts (Extended Data Figure 3). The membrane-proximal side of the cytosolic domains is an extremely flat hydrophobic surface, which is likely embedded within the membrane plane (Figure 1b; Extended Data Figure 4). The cytosolic domain of each of the three protomers shows a β-barrel fold with the ligand at its center, flanked by four alpha helices (Figure 2). The ligand-binding domain is highly conserved in sequence across species, as is the intermolecular interface among the three protomers (Extended Data Figures 5 and 6). The overall fold of the β-barrel ligand-binding region closely resembles that of cupin family proteins, most of which are oligomeric bacterial enzymes (Extended Data Table 2). While there is no obvious functional similarity between such proteins and the σ1 receptor, the enzyme catalytic sites are generally synonymous with the ligand binding site of the σ1 receptor, suggesting the σ1 receptor may represent a repurposed enzyme in which the catalytic site inside the β-barrel has been co-opted as a ligand binding site.
Figure 1. Overall structure of the σ1 receptor.
a, Viewed perpendicular to the membrane plane, the σ1 receptor shows a triangular structure comprised of three tightly associated protomers, each with a single transmembrane domain at a corner of the oligomeric triangle. From the side, the receptor reveals a flat membrane-associated surface. The location of the membrane plane is shown in grey, based on PPM server30 prediction. b, Coloring by electrostatic potential reveals a polar cytosolic surface (left side), and a non-polar membrane-interacting surface flanked by positive charges, suggesting it is partially buried in the membrane.
Figure 2. Structure of the σ1 protomer.
a, The receptor shows a cupin-like β-barrel fold flanked by four α-helices with the ligand (grey) bound at the center of the cupin domain. The receptor is colored by sequence conservation, revealing a high degree of conservation in the ligand-binding domain, and relatively lower conservation of the transmembrane helices, which may simply act to tether the receptor to the membrane. b, The intermolecular interface among protomers of the receptor trimer is likewise highly conserved. c, Glu102 forms a pair of hydrogen bonds (yellow dashed lines) with backbone amide nitrogen atoms, providing a structural explanation for receptor destabilization due to the ALS-associated mutation E102Q.
Recently, a mutation in the σ1 receptor, E102Q, was identified as a cause of inherited juvenile-onset ALS in a family in eastern Saudi Arabia7. Cell biological experiments have shown that this receptor mutant is prone to aggregation, leading to mislocalization of TDP43 and consequent cytoxicity18. The structures reported here offer an explanation for the phenotype of this mutant. The highly conserved Glu102 is deeply buried, with its carboxyl oxygen atoms each accepting a hydrogen bond from the backbone amides of Val36 and Phe37, which are part of a structured tether between the transmembrane domain and cytosolic domain (Figure 2c). Mutation of Glu to Gln would block this interaction, converting one of the two favorable hydrogen bond interactions into an energetically unfavorable juxtaposition of hydrogen bond donors, accounting for the previously observed receptor destabilization.
One of the most intriguing features of the σ1 receptor is the remarkable diversity of the ligands to which it binds. These include a multitude of biologically active compounds targeted at other receptors, such as dextromethorphan (Ki = 200 nM)19, haloperidol (Ki = 1.1 nM), fluoxetine (Ki = 1.9 μM), quetiapine (Ki = 220 nM), clemastine (Ki = 67 nM), and chloroquine (Ki = 109 nM), among many others (affinities are from the PDSP Ki database20 unless otherwise noted). These ligands are diverse in chemical structure, sharing few common features with the exception of a cationic amine and at least one aromatic ring. To understand the molecular basis for this ligand-binding promiscuity, we performed additional crystallization and structure determination experiments with receptor bound to the ligand 4-IBP. The two ligands, 4-IBP and PD144418, were selected in part on the basis of their divergence in chemical structure, with a Tanimoto similarity coefficient of 0.235 indicating no substantial structural similarity. Nonetheless, it should be noted that both compounds are positively charged, elongated molecules with substantial hydrophobic character – all common features among σ1 receptor ligands.
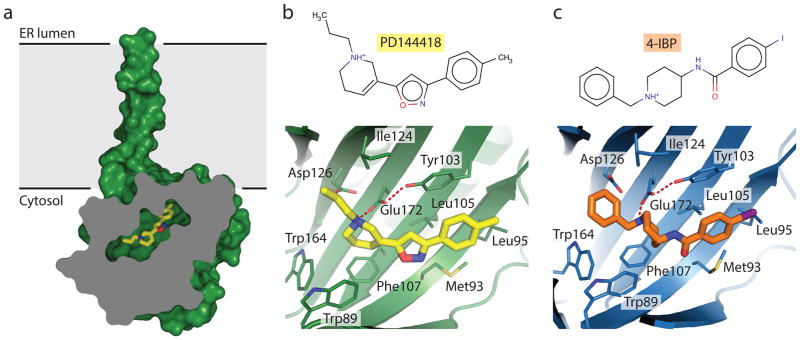
In comparing the two structures, very little deviation is seen in receptor conformation, and the all-atom RMSD for the two structures is 0.4 Å. The two ligands bind in similar positions (Extended Data Figure 7), in each case interacting with the receptor through a charge-charge interaction with the highly conserved Glu172, consistent with previous mutagenesis experiments identifying this residue as essential for ligand binding21. A second essential acidic residue, Asp126, forms a 2.7 Å hydrogen bond with Glu172, indicating it is likely protonated at least when ligands are bound. With the exception of these two amino acids, the binding pocket overall is very hydrophobic and its interior is completely occluded from solvent (Figure 3a). Other residues in the binding site include Val84, Trp89, Met93, Leu95, Leu105, Phe107, Ile124, Trp164, and Leu182, which interact with hydrophobic regions on the bound ligands, and Tyr103, which engages in an aromatic stacking interaction in both structures (Figure 3b, c). In addition, Tyr103 makes a hydrogen bond to Glu172, accounting for a five-fold reduction in binding affinity to (+)-pentazocine in a Y103F mutant22.
Figure 3. Ligand recognition.
a, Cross-section view of the receptor bound to PD144418, showing the deeply buried antagonist and occlusion of the binding pocket from solvent. The ligand is shown in yellow sticks. b, View of PD144418 binding pose, showing charge-charge interaction with Glu172 (red dotted line) and extensive hydrophobic contacts with other binding pocket residues. A hydrogen bond between Glu172 and Tyr103 is also shown as a red dotted line. c, Corresponding structure of the 4-IBP binding pose.
Given the highly occluded structure of the binding pocket, it remains unclear how ligands enter and exit this site. Two possibilities are apparent: ligands could enter and exit through a gap between the two membrane adjacent helices, directly into/out of the plasma membrane, or they could access the binding site though the cytosolic surface, passing through a polar region occluded by Gln135, Glu158, and His154. Since both potential points of entry/egress are in a closed conformation in the current structures, some degree of conformational plasticity must exist to account for reversible ligand binding. Notably, the occluded structure of the binding site accounts for the very slow ligand binding kinetics typically seen with σ1 receptor, and the resulting requirement to use of elevated temperatures or very long incubation times to reach equilibrium in radioligand binding assays23.
A key unanswered question surrounding σ1 receptor function regards the molecular basis for ligand efficacy. The classification of σ1 ligands as agonists and antagonists is largely based on whole-animal physiology, with agonists defined as ligands that induce hyperlocomotion or other physiological responses through binding to σ1, while antagonists are σ1 ligands that block or blunt this response24,25. In addition, antagonists show similar functional effects to receptor knockdown, suggesting they indeed operate through blockade of σ1 activity26. The relationship between ligand binding to σ1 receptor and the subsequent biological response remains only partially understood27. However, a recent study28 offered biochemical evidence for ligand-mediated changes in σ1 receptor oligomerization state. Subsequent FRET studies in cells have revealed similar results, showing in addition that antagonists stabilize high molecular weight oligomers, while agonists favor dissociation of these complexes29.
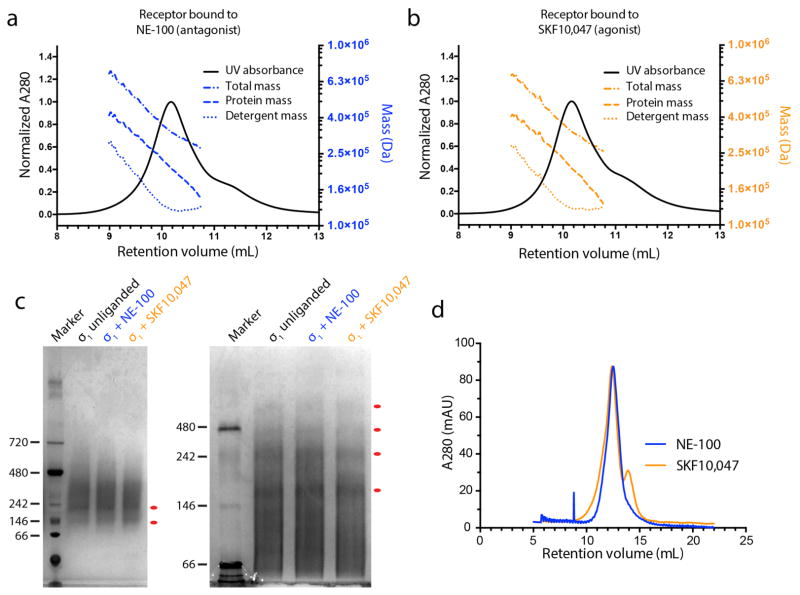
To better understand σ1 receptor oligomerization, we performed size exclusion chromatography with multi-angle light scattering (SEC-MALS) experiments as well as native PAGE analysis. Samples in SEC-MALS showed a single sharp peak of protein, but light scattering and refractive index analysis revealed that this peak comprises protein species ranging in molecular weight from at least 140 kDa (excluding detergent mass) to about 400 kDa. This suggests the presence of oligomers ranging in size from hexamers to as large as 15-mers (Extended Data Figure 8a, b). Native PAGE experiments showed similar results, again revealing a polydisperse mixture of high molecular weight oligomers (Extended Data Figure 8c). These experiments in pure detergents showed little difference between agonist-and antagonist-bound receptor. In contrast, size exclusion in a mixed micelle of maltose neopentyl glycol detergent with cholesterol hemisuccinate showed modest differences in SEC profile (Extended Data Figure 8d), with agonists partially disrupting high order oligomers. It is important to note that our results in detergent may not fully recapitulate receptor behavior in vivo, but taken together with the previously reported biochemical and cellular studies, these data suggest oligomerization is a key functional property of the σ1 receptor and may be linked to ligand efficacy.
In summary, the results presented here show for the first time the overall molecular structure of the σ1 receptor, an important but poorly understood human transmembrane receptor. The structure reveals the basis for receptor oligomerization and ligand binding, and moreover shows an unexpected single-pass transmembrane topology. These results now offer a solid foundation for the development of future biochemical and biophysical studies toward understanding the σ1 receptor at the molecular level.
Methods
Expression and purification
The human σ1 receptor was cloned into pFastbac1 with an amino-terminal hemagglutinin signal sequence followed by a FLAG epitope tag and a 3C protease cleavage site. Following proteolytic digest to remove the FLAG tag, the resulting protein is identical to the wild-type receptor with the exception of an amino terminal protease site scar, comprising the sequence “GPGS”. This receptor construct was expressed in Sf9 insect cells (Expression Systems) using the FastBac baculovirus system (ThermoFisher) according to the manufacturer’s instructions. Infection was performed when cells reached a density of 4 × 10⁶ cells/mL, and flasks were shaken at 27 °C for two days prior to harvest.
Cells were harvested by centrifugation and frozen at −80 °C until purification. For both PD144418 and 4-IBP-bound receptors, 1 μM of ligand was added in all purification steps. After thawing frozen cell paste, cells were lysed by osmotic shock in 20 mM HEPES pH 7.5, 2 mM magnesium chloride, and 1:100,000 (v:v) benzonase nuclease (Sigma Aldrich). Lysed cells were centrifuged at 20,000 rpm in a Sorvall RC 5C Plus centrifuge with an SS-34 rotor for 15 minutes. The receptor was then extracted using a glass dounce tissue grinder in a solubilization buffer containing 250 mM NaCl, 20 mM HEPES pH 7.5, 20% (v/v) glycerol, 1% (w/v) lauryl maltose neopentyl glycol (LMNG; Anatrace), and 0.1% (w/v) cholesterol hemisuccinate (CHS; Steraloids). Samples were stirred for 2 hr at 4 °C, and then centrifuged as before for 20 min. Next, samples were filtered on a glass microfiber filter. The filtered supernatant containing solubilized receptor was supplemented with 2 mM calcium chloride and loaded by gravity flow onto 5 mL anti-FLAG antibody affinity resin. The resin was washed extensively, first in 50 mL of buffer containing 100 mM NaCl, 20 mM HEPES pH 7.5, 2 mM calcium chloride, 0.2% glycerol, 0.1% LMNG, and 0.01% CHS, and then in 50 mL of buffer containing 100 mM NaCl, 20 mM HEPES pH 7.5, 2 mM calcium chloride, 0.02% glycerol, 0.01% LMNG, and 0.001% CHS. The receptor was eluted in the same buffer supplemented with 5 mM EDTA and 0.2 mg/mL FLAG peptide in lieu of calcium. 3C protease was added (1:100 w:w) and incubated with the receptor at 4 °C overnight.
The receptor was further purified by size exclusion chromatography (SEC) on a Sephadex S200 column (GE Healthcare) in buffer containing 0.01% LMNG, 0.001% CHS, 100 mM NaCl, 20 mM HEPES pH 7.5, and 1 μM of ligand. The receptor was biochemically pure but consistently ran as a high molecular weight oligomer during SEC. Following preparative SEC, the protein was concentrated to 20 –30 mg/mL and flash frozen with liquid nitrogen in aliquots of 8 –9 μL. Samples were stored at −80°C until use for crystallography. Purity and monodispersity of crystallographic samples was evaluated by SDS-PAGE and analytical SEC, respectively (Extended Data Figure 1).
Crystallography and data collection
Purified σ1 receptor was reconstituted into lipidic cubic phase by mixing with a 10:1 (w:w) mix of monoolein (Hampton Research) with cholesterol (Sigma Aldrich) at a ratio of 1.5:1.0 lipid:protein by mass, using the coupled syringe reconstitution method31. All samples were mixed at least 100 times. The resulting phase was dispensed in 30 –40 nL drops onto either a glass plate or a hanging drop cover, and overlaid with 600 nL of precipitant solution using a Gryphon LCP robot (Art Robbins Instruments). Crystals grew in precipitant solution containing 40 –50% PEG 300, 220 –250 mM LiSO4, 0.1 M MES pH 6.5. Initial crystallization hits grew slowly, with crystals reaching full size over the course of two to four weeks. Crystals were harvested using mesh loops and stored in liquid nitrogen until data collection.
Data collection was performed at Advanced Photon Source GM/CA beamlines 23ID-B and 23ID-D (native data), and at NE-CAT beamline 24ID-C (Tantalum Bromide derivative). An initial grid raster with 80 × 30 μm beam dimensions was performed using a 20 μm beam to locate crystals in the loop. Additional rasters were performed using a 10 μm beam diameter to optimally position the crystal for data collection. Data collection used a 10 μm beam and diffraction images were collected in 0.2 to 1 degree oscillations at a wavelength of 1.033 Å. For σ1 bound to PD144418 a complete dataset was obtained from a single crystal. For σ1 bound to 4-IBP, a complete dataset was the result of merging data from three crystals.
Experimental phasing and structure refinement
To obtain phases, crystals of σ1 receptor bound to PD144418 were grown using a hanging-drop LCP methodology adapted from a previous report32. In brief, this entailed dispensing cubic phase drops onto a plastic cover film (Art Robbins Instruments) and overlaying with precipitant solution as described above. This film was then inverted over a matched plate with identical crystallization solutions to the precipitant surrounding the lipid drop. The resulting crystals could be soaked and resealed, unlike conventional glass sandwich lipidic cubic phase plates. Crystals prepared in this way were soaked with tantalum bromide clusters for approximately 12 hours by adding crushed granules of tantalum clusters to the edge of the well. The crystals were harvested and data collected as described above, but at a wavelength of 1.2548 Å.
Initial phases were obtained in SHARP33 using single isomorphous replacement and anomalous scattering (SIRAS). Three transmembrane α-helices were identifiable in the initial map, suggesting three molecules in the asymmetric unit with an unusual solvent content of ~70%. Experimental phases were iteratively combined with model-derived phase to improve the electron density map through solvent flattening in SHARP. Model building was performed in Coot34, and refinement was performed in phenix.refine35. All three chains are highly similar in structure, with all-atom pairwise RMSD of cytosolic domains ranging from 0.22 Å to 0.26 Å, while the orientation of the transmembrane helix relative to the soluble domain varies among protomers.
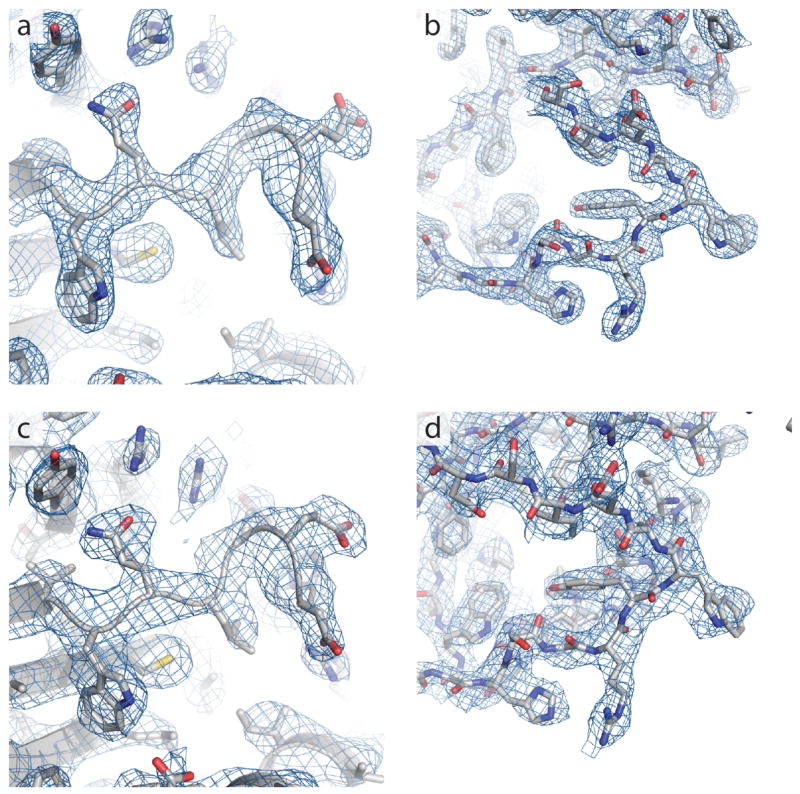
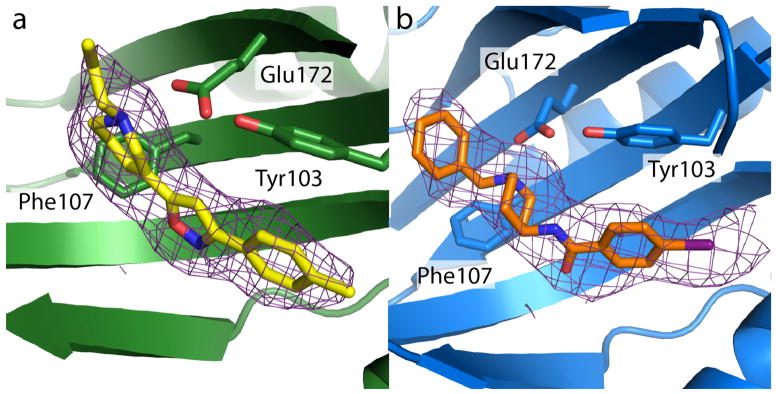
Assignment of sequence register was straightforward and unambiguous due to the relatively high resolution, almost completely ordered structure, and high frequency bulky amino acid side chains (σ1 receptor is roughly 5% tryptophan). As a control for register assignment, the structure was built and register assigned in two independent ways. First it was manually built and register assigned by inspection of electron density. In parallel, sequence register was independently assigned automatically with phenix.autobuild, and results were confirmed to be identical throughout the entire polypeptide chain of each protomer. Representative composite omit map density is shown in Extended Data Figure 2. Ligands were manually placed into Fo−Fc difference maps (Extended Data Figure 7). In the case of PD144418 the electron density was clear, and ligand position and pose were unambiguous. For 4-IBP, the pose was unambiguous due to the high Fo−Fc peak resulting from the ligand iodine atom. Following refinement, structure quality was assessed using MolProbity36, and figures were prepared in PyMOL37 and UCSF Chimera38. All crystallographic data processing, refinement, and analysis software was compiled and supported by the SBGrid Consortium39.
Sequence and structure conservation analysis
Sequence conservation analysis in Figure 2 was computed using the ConSurf server40. In brief, a multiple sequence alignment of human σ1 receptor to its closest 330 homologs was generated using a protein sequence BLAST search on the NCBI public database using the human wild-type σ1 receptor protein sequence as query. These sequences were then used for ConSurf analysis, with conservation scores plotted using UCSF Chimera. Analysis of fold conservation was performed using the DALI server41 with the PD144418-bound structure of the σ1 receptor as query. Structures with Z-scores in excess of 8 were selected for further analysis with results summarized in Extended Data Table 2.
Oligomerization analysis
The oligomeric state of σ1 receptor was assessed by SEC-MALS using a Wyatt Dawn Heleos II multi-angle light scattering detector and Optilab TrEX refractive index monitor with an Agilent isocratic HPLC system. Receptor was prepared as described above, but with no ligand added during purification. The ligand-free receptor was diluted to 0.5 mg/mL in SEC-MALS buffer (0.025% n-dodecyl maltoside, 20 mM HEPES pH 7.5, 100 mM sodium chloride). Ligands were added to a final concentration of 25 μM to ensure stoichiometric excess over receptor and the sample was incubated with ligand at least 2 hours at room temperature. Separation steps were performed in SEC-MALS buffer with a Tosoh G4SWxl column at a flow rate of 0.5 mL/min. Data analysis was performed with the Astra software package version 6.1.4.25 (Wyatt) using the protein conjugate method with previously reported dn/dc values for detergent42. The effect of ligands in LMNG/CHS mixed micelle buffer was examined by analytical size exclusion in a similar procedure. The receptor was incubated with a 2-fold stoichiometric excess of the appropriate ligand and then subjected to SEC on a Superdex 200 column in a buffer consisting of 100 mM sodium chloride, 20 mM HEPES pH 7.5, 0.01% LMNG, 0.001% CHS, 1 μM ligand.
Oligomerization state was also assessed by native PAGE. For these experiments, 7.5 μg of σ1 receptor was mixed with 10-fold stoichiometric excess of SKF10,047 or NE-100 in a 10 μl reaction containing 20 mM HEPES pH 7.5, 250 mM NaCl, 0.1% MNG, 0.001% CHS. After incubation at room temperature for 1 h, the reaction was added to 1 μl loading buffer consisting of 50% glycerol and 0.25% (w/v) bromophenol blue and separated by 10% native PAGE running in Tris-glycine (pH 8.3) buffer supplemented with 0.5% CHAPS and 0.5% sodium cholate for 4 h at 150 volts in an ice bath. Blue native PAGE was performed as previously described43. In brief, 10 μl reaction was supplemented with 1 μl of 50% glycerol and 1.5 μl of 0.1% Coomassie blue G-250 and was loaded onto a linear 3–12% gradient native PAGE gel (Life technologies) running in blue cathode buffer supplemented with 0.05% MNG, 0.0005% CHS for 4 h at 150 volts in an ice bath. The gel was stained using InstantBlue staining Kit (CBS Scientific).
Radioligand binding
Radioligand binding experiments were performed similarly to established procedures23. In brief, Sf9 membranes expressing σ1 receptor were prepared by dounce homogenization followed by centrifugation. Resuspended membranes were aliquoted and flash frozen prior to use. For each binding experiment, membranes were incubated with 3H (+)-pentazocine (Perkin Elmer) at the indicated concentration or at a fixed concentration of 10 nM for competition binding assays. To approximate physiological conditions, incubation was carried out at 37 °C for 2 hours in 150 mM sodium chloride and 20 mM HEPES pH 7.5. Filter pads were incubated with 0.3% polyethyleneimine for 20 minutes, then samples were loaded onto the filter and washed using a Brandel harvester. Radioactivity was quantified by liquid scintillation counting. Non-specific binding was quantified by replicate reactions in the presence of 2 μM haloperidol. All measurements were performed in triplicate and repeated in two independent experiments. Experiments in Tris pH 7.5 showed similar results to those conducted in HEPES. Data analysis was performed in GraphPad Prism, with Ki values calculated by Cheng-Prusoff correction using the experimentally measured probe Kd.
Extended Data
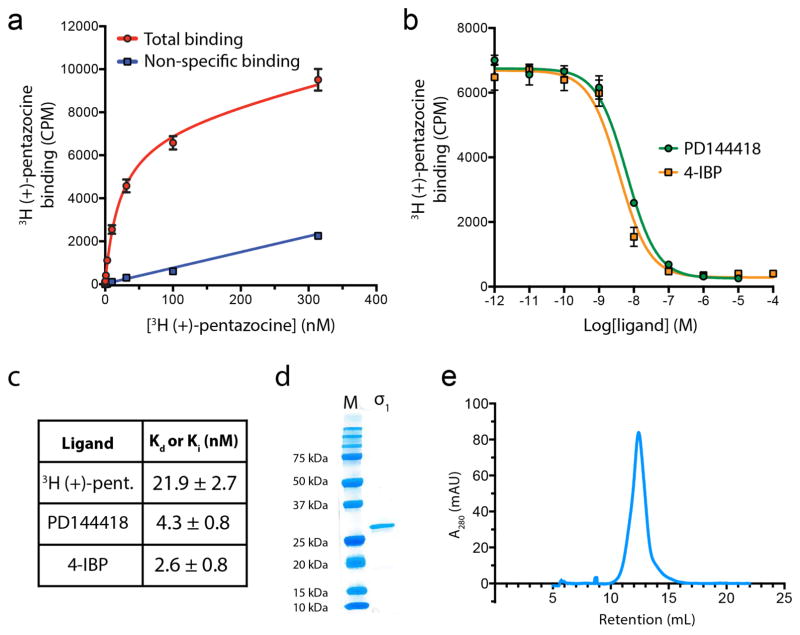
Extended Data Figure 1. Assessment of σ1 functional properties and biochemical quality.
a, Saturation binding curve to measure Kd for 3H (+)-pentazocine, with points shown as mean +/− SEM. b, Competition binding measurement of affinities for the two co-crystallized ligands with points shown as mean +/− SEM. c, Summary of binding affinities with 95% confidence intervals for Kd/Ki values. d, Analysis of receptor purity by SDS-PAGE. e, Analytical size exclusion of purified σ1 receptor in LMNG/CHS detergent buffer on a Superdex 200 column.
Extended Data Figure 2. Representative electron density.
a, Composite omit 2Fo−Fc electron density contoured at 1.0 σ for σ1 receptor bound to PD144418, showing a loop from Val73 to Glu78 as well as surrounding residues. b, The same map over a loop from His116 to Ser125. c, The equivalent map to that in panel (a), calculated for σ1 receptor bound to 4-IBP. d, The equivalent map to that in panel (b), calculated for σ1 receptor bound to 4-IBP.
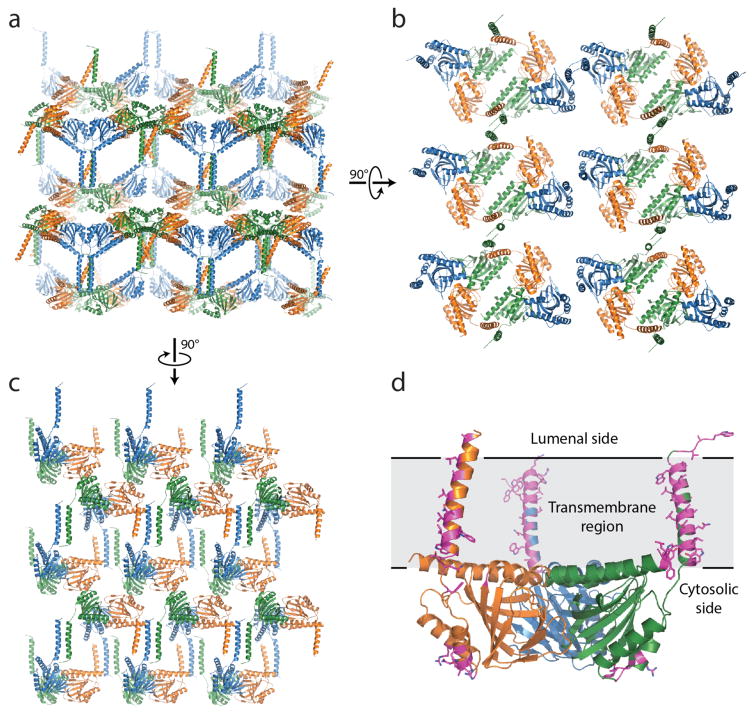
Extended Data Figure 3. Lattice contacts.
a, Lattice packing of the σ1 receptor viewed parallel to the membrane plane. b and c show a view normal to the membrane and another parallel view, respectively. d, A single σ1 trimer is shown, with lattice contact residues highlighted in magenta sticks. Lattice contacts are formed primarily through interactions of the relatively poorly conserved transmembrane helices.
Extended Data Figure 4. Hydrophobicity analysis.
a, The structure of σ1 receptor shows a hydrophilic (blue) surface on the cytosolic face (left), while transmembrane domains and the membrane-facing surface of the receptor trimer are hydrophobic (orange; right panels). Hydrophobicity analysis was conducted using UCSF Chimera.
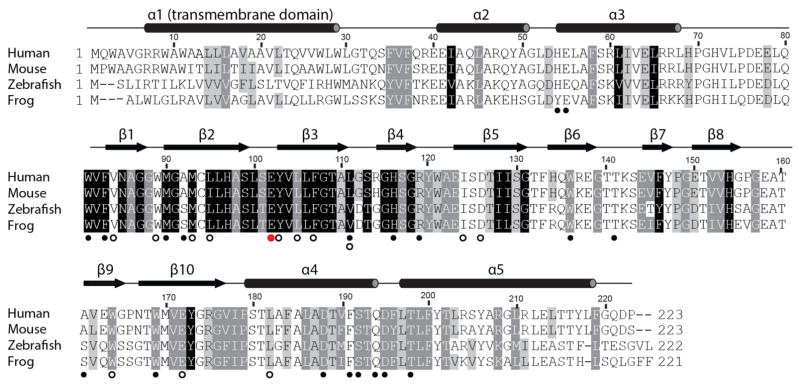
Extended Data Figure 5. Sequence conservation.
The results of an alignment of 277 sigma receptor sequences from a vertebrates with Homo sapiens, Mus musculus, Danio rerio, and Xenopus laevis displayed. Residues with 98%, 80%, and 60% similarity are shown in black, grey, and light grey respectively. Secondary structure elements are shown above the alignment based on the human σ1 receptor crystal structure. Open black circles mark residues within 4 Å of the ligand binding site, solid black circles below the alignment denote residues located in the trimerization interface, and a red circle marks the site of the ALS-associated mutation E102Q.
Extended Data Figure 6. Trimerization interface.
a, b, Two views of the trimerization interface are shown, colored by sequence conservation. Residues highlighted in yellow are more than 80% conserved among a selection of 300 σ1 receptor homologs, and residues in orange surface are more than 98% conserved. c, d, Closeup views of the interface, showing the extensive hydrophobic and polar contacts at the oligomerization interface.
Extended Data Figure 7. Omit maps of PD144418 and 4-IBP.
a, An Fo−Fc omit map contoured at 1 σ showing the electron density (purple) of PD144418 (yellow). b, An equivalent map showing the electron density (purple) of 4-IBP (orange).
Extended Data Figure 8. Oligomerization state.
a, Analysis of receptor oligomerization by size exclusion chromatography with multi-angle light scattering (SEC-MALS) in the presence of the classical antagonist NE-100 or b, the classical agonist SKF-10,047. The peak is 38% detergent and 62% protein by mass. The total mass of each component varies throughout the peak, indicating a mix of oligomeric species. c, Analysis of oligomerization state by blue native PAGE (left) and a higher resolution detergent-supplemented tris-glycine native PAGE gel (right), showing a similar polydisperse profile. Discrete oligomers are marked with red dots, corresponding to possible trimers, hexamers, and higher-order species. d, In a mixed micelle of lauryl maltose neopentyl glycol and cholesterol hemisuccinate modest differences in SEC profile are observed between agonist- and antagonist-treated receptor.
Extended Data Table 1.
Data collection and refinement statistics.
| σ1 bound to PD144418 (native) | σ1 bound to 4-IBP | σ1 bound to PD144418 Ta6Br12 soak | |
|---|---|---|---|
| Data collectiona | |||
| Wavelength (Å) | 1.033 | 1.033 | 1.2548 |
| Space group | P21 21 2 | P21 21 2 | P 21 21 2 |
| Number of crystals | 1 | 3 | 1 |
| Unit cell dimensions | |||
| a, b, c (Å) | 85.6, 126.1, 109.7 | 85.7, 126.8, 110.8 | 85.0, 127.4, 109.4 |
| α, β, γ (°) | 90, 90, 90 | 90, 90, 90 | 90, 90, 90 |
| Resolution (Å) | 40 – 2.5 (2.65 – 2.50) | 50 – 3.2 (3.30 – 3.20) | 46.2–3.50 (3.63–3.50) |
| Completeness (%) | 98.8 (97.7) | 97.1 (97.8) | 99.0 (99.2) |
| <I/σ(I)> | 10.1 (0.9) | 5.8 (1.9) | 12.4 (3.1) |
| CC1/2 (%)f | 99.8 (40.1) | 98.0 (35.6) | 98.2 (12.9) |
| Multiplicity | 3.5 (3.4) | 3.2 (3.2) | 3.1 (3.1) |
| Refinement | |||
| Resolution (Å) | 40 – 2.51 (2.57 – 2.51) | 33.6 – 3.2 (3.28 – 3.20) | |
| No. reflections | 41026 (2000 in test set) | 19968 (1998 in test set) | |
| Rwork/Rfree (%) | 19.5/23.3 | 21.8/26.1 | |
| No. atoms | |||
| Protein | 5097 | 5027 | |
| Ligand | 63 | 69 | |
| Solvent ions/lipid | 160 | 130 | |
| Water | 136 | 0 | |
| B factors (Å2) | |||
| Protein | 79.5 | 66.5 | |
| Ligands | 84.6 | 90.2 | |
| Water | 76.8 | N/A | |
| Solvent ions/lipids | 116.8 | 96.6 | |
| RMS deviation | |||
| Bond length (Å) | 0.003 | 0.003 | |
| Bond angles (°) | 0.586 | 0.613 | |
| Ramachandran statisticsb | |||
| Favored | 98.8% | 98.4% | |
| Allowed | 1.2% | 1.6% | |
| Outliers | 0% | 0% |
Extended Data Table 2.
Structural homologs of the σ1 receptor.Structural homologs of the σ1 receptor were identified by search with the DALI server, and those with Z-score values above 8 are summarized here. All are cupin fold proteins, with a majority showing oligomeric structures based on annotated biological assembly in the Protein Data Bank. Trimeric structures like that seen for the σ1 receptor have not been reported previously for other cupin-fold proteins.
| PDB ID | Z-score | RMSD (Å) | Seq. ID to σ1 (%) | Name and bound metal ion | Oligomerization state |
|---|---|---|---|---|---|
| 3BCW | 10.8 | 2.8 | 8 | Unknown function cupin (no metal ion) | Dimer |
| 2PFW | 9.9 | 2.5 | 11 | Unknown function cupin (no metal ion) | Dimer |
| 4AXO | 9.4 | 3.5 | 9 | CD1908, a bacterial microcompartment for the breakdown of ethanolamine (no metal ion) | Hexamer |
| 4BIF | 9.4 | 2.6 | 12 | Manganese- dependent hydroxynitrile lyase (Mn) | Tetramer |
| 1VJ2 | 9.3 | 2.7 | 10 | Manganese-containing cupin (Mn) | Dimer |
| 4UXA | 9.3 | 2.7 | 12 | (R)-selective manganese-dependent hydroxynitrile lyase (Mn) | Dimer |
| 2Y0O | 9.2 | 2.6 | 10 | Probable D-lyxose ketol isomerase (Zn) | Dimer |
| 4E2G | 9.2 | 2.9 | 8 | Cupin fold protein Sthe2323 (Ni) | Dimer |
| 2OYZ | 9.2 | 2.5 | 11 | Unknown function protein VPA0057 (no metal ion) | Dimer |
| 4QM8 | 9.1 | 2.7 | 6 | Cysteine dioxygenase (Fe) | Monomer |
| 3LWC | 9.1 | 2.5 | 11 | Unknown function (no metal ion) | Dimer |
| 3EBR | 9.0 | 2.9 | 12 | Rmlc-like cupin protein (no metal ion) | Tetramer |
| 1O4T | 9.0 | 2.6 | 15 | Predicted oxalate decarboxylase (Mn) | Dimer |
| 2F4P | 9.0 | 2.4 | 11 | Hypothetical protein TM1010 (no metal ion) | Dimer |
| 5BPX | 8.9 | 2.9 | 15 | 2,4′-dihydroxyacetophenone dioxygenase (Fe) | Dimer |
| 3HT2 | 8.9 | 3.3 | 11 | Zinc containing polyketide cyclase RemF (Zn) | Dimer |
| 2OPK | 8.9 | 2.2 | 14 | Putative mannose-6-phosphate isomerase (no metal ion) | Dimer |
| 3BAL | 8.8 | 2.9 | 15 | Acetylacetone dioxygenase (Zn) | Tetramer |
| 1YLL | 8.8 | 3.4 | 6 | Unknown function PA5104 (no metal ion) | Tetramer |
| 4E2S | 8.7 | 4.2 | 9 | (S)-ureidoglycine aminohydrolase (Mn) | Octamer |
| 3ESG | 8.7 | 3.1 | 8 | HutD (no metal ion) | Dimer |
| 3L2H | 8.7 | 3.1 | 14 | Putative sugar phosphate isomerase (no metal ion) | Tetramer |
| 1 H1 I | 8.6 | 3.4 | 3 | Quercetin 2,3-dioxygenase (Cu) | Dimer |
| 1GQG | 8.4 | 3.4 | 3 | Cu-dependent Quercetin 2,3-Dioxygenase (Cu) | Dimer |
| 3SCH | 8.4 | 3.0 | 9 | Hydroxypropylphosphonic acid epoxidase (Fe) | Tetramer |
| 3KMH | 8.3 | 3.0 | 7 | Sugar isomerase (Mn) | Dimer |
| 1V70 | 8.2 | 3.0 | 9 | Probable antibiotics synthesis protein (Na) | Dimer |
| 4LA2 | 8.2 | 2.9 | 15 | Dimethylsulphoniopropionate lyase (Zn) | Monomer |
Acknowledgments
We thank beamline staff at the Advanced Photon Source for their superb technical assistance and support. We thank Stephen Blacklow and Brandon Zimmerman for helpful discussions and input throughout the project, and Kelly Arnett for assistance with SEC-MALS experiments. Financial support for this work was provided by departmental startup funds. SZ is supported by a Merck Postdoctoral Fellowship in Biological Chemistry and Molecular Pharmacology, and HRS is supported by the Biological and Biomedical Sciences training grant at Harvard Medical School (T32GM007226).
Footnotes
Author Contributions Receptor purification and crystallization experiments were conducted by H.R.S., E.G., and A.C.K. X-ray data collection was performed by H.R.S., A.M., A.K., and A.C.K. Data processing, phase calculation, and structure refinement were carried out jointly by H.R.S., S.Z., and A.C.K. SEC-MALS experiments were performed by A.C.K., radioligand binding by H.R.S., and native-PAGE by S.Z. Overall project design, molecular cloning, and pilot studies were conducted by A.M. and A.C.K.
Coordinates and structure factors for the σ1 receptor bound to PD144418 and 4-IBP are deposited in the RCSB Protein Data Bank under accession codes 5HK1 and 5HK2, respectively
The authors declare no competing financial interests
Readers are welcome to comment on the online version of the paper.
References
- 1.Cobos EJ, Entrena JM, Nieto FR, Cendán CM, Del Pozo E. Pharmacology and Therapeutic Potential of Sigma(1) Receptor Ligands. Curr Neuropharmacol. 2008;6:344–366. doi: 10.2174/157015908787386113. [DOI] [PMC free article] [PubMed] [Google Scholar]
- 2.Mavlyutov TA, Guo LW, Epstein ML, Ruoho AE. Role of the Sigma-1 receptor in Amyotrophic Lateral Sclerosis (ALS) J Pharmacol Sci. 2015;127:10–16. doi: 10.1016/j.jphs.2014.12.013. [DOI] [PMC free article] [PubMed] [Google Scholar]
- 3.Brownstein MJ. A brief history of opiates, opioid peptides, and opioid receptors. Proc Natl Acad Sci USA. 1993;90:5391–5393. doi: 10.1073/pnas.90.12.5391. [DOI] [PMC free article] [PubMed] [Google Scholar]
- 4.Largent BL, Wikstrom H, Gundlach AL, Snyder SH. Structural determinants of sigma receptor affinity. Mol Pharmacol. 1987;32:772–784. [PubMed] [Google Scholar]
- 5.Hanner M, et al. Purification, molecular cloning, and expression of the mammalian sigma1-binding site. Proc Natl Acad Sci USA. 1996;93:8072–8077. doi: 10.1073/pnas.93.15.8072. [DOI] [PMC free article] [PubMed] [Google Scholar]
- 6.Su TP, Hayashi T, Maurice T, Buch S, Ruoho AE. The sigma-1 receptor chaperone as an inter-organelle signaling modulator. Trends Pharmacol Sci. 2010;31:557–566. doi: 10.1016/j.tips.2010.08.007. [DOI] [PMC free article] [PubMed] [Google Scholar]
- 7.Al-Saif A, Al-Mohanna F, Bohlega S. A mutation in sigma-1 receptor causes juvenile amyotrophic lateral sclerosis. Ann Neurol. 2011;70:913–919. doi: 10.1002/ana.22534. [DOI] [PubMed] [Google Scholar]
- 8.Mavlyutov TA, et al. Lack of sigma-1 receptor exacerbates ALS progression in mice. Neuroscience. 2013;240:129–134. doi: 10.1016/j.neuroscience.2013.02.035. [DOI] [PMC free article] [PubMed] [Google Scholar]
- 9.Hayashi T, Su TP. Sigma-1 receptor chaperones at the ERmitochondrion interface regulate Ca(2+) signaling and cell survival. Cell. 2007;131:596–610. doi: 10.1016/j.cell.2007.08.036. [DOI] [PubMed] [Google Scholar]
- 10.Wu Z, Bowen WD. Role of sigma-1 receptor C-terminal segment in inositol 1,4,5-trisphosphate receptor activation: constitutive enhancement of calcium signaling in MCF-7 tumor cells. J Biol Chem. 2008;283:28198–28215. doi: 10.1074/jbc.M802099200. [DOI] [PMC free article] [PubMed] [Google Scholar]
- 11.Kim FJ, et al. Sigma 1 receptor modulation of G-protein-coupled receptor signaling: potentiation of opioid transduction independent from receptor binding. Mol Pharmacol. 2010;77:695–703. doi: 10.1124/mol.109.057083. [DOI] [PMC free article] [PubMed] [Google Scholar]
- 12.Dussossoy D, et al. Colocalization of sterol isomerase and sigma(1) receptor at endoplasmic reticulum and nuclear envelope level. Eur J Biochem/FEBS. 1999;263:377–386. doi: 10.1046/j.1432-1327.1999.00500.x. [DOI] [PubMed] [Google Scholar]
- 13.Aydar E, Palmer CP, Klyachko VA, Jackson MB. The sigma receptor as a ligand-regulated auxiliary potassium channel subunit. Neuron. 2002;34:399–410. doi: 10.1016/s0896-6273(02)00677-3. [DOI] [PubMed] [Google Scholar]
- 14.Akunne HC, et al. The pharmacology of the novel and selective sigma ligand, PD 144418. Neuropharmacology. 1997;36:51–62. doi: 10.1016/s0028-3908(96)00161-x. [DOI] [PubMed] [Google Scholar]
- 15.Lever JR, et al. Relationship between cerebral sigma-1 receptor occupancy and attenuation of cocaine’s motor stimulatory effects in mice by PD144418. doi: 10.1124/jpet.114.216671. [DOI] [PMC free article] [PubMed] [Google Scholar]
- 16.John CS, Vilner BJ, Bowen WD. Synthesis and characterization of [125I]-N-(N-benzylpiperidin-4-yl)-4- iodobenzamide, a new sigma receptor radiopharmaceutical: high-affinity binding to MCF-7 breast tumor cells. J Med Chem. 1994;37:1737–1739. doi: 10.1021/jm00038a002. [DOI] [PubMed] [Google Scholar]
- 17.Bermack JE, Debonnel G. Distinct modulatory roles of sigma receptor subtypes on glutamatergic responses in the dorsal hippocampus. Synapse (New York, NY) 2005;55:37–44. doi: 10.1002/syn.20085. [DOI] [PubMed] [Google Scholar]
- 18.Tagashira H, Shinoda Y, Shioda N, Fukunaga K. Methyl pyruvate rescues mitochondrial damage caused by SIGMAR1 mutation related to amyotrophic lateral sclerosis. Biochim Biophys Acta. 2014;1840:3320–3334. doi: 10.1016/j.bbagen.2014.08.012. [DOI] [PubMed] [Google Scholar]
- 19.Shin EJ, et al. Dextromethorphan attenuates trimethyltin-induced neurotoxicity via sigma1 receptor activation in rats. Neurochem Int. 2007;50:791–799. doi: 10.1016/j.neuint.2007.01.008. [DOI] [PubMed] [Google Scholar]
- 20.Roth BL, Lopez E, Patel S, Kroeze WK. The Multiplicity of Serotonin Receptors: Uselessly Diverse Molecules or an Embarrassment of Riches? Neuroscientist. 2000;6:252–262. [Google Scholar]
- 21.Seth P, et al. Expression pattern of the type 1 sigma receptor in the brain and identity of critical anionic amino acid residues in the ligand-binding domain of the receptor. Biochim Biophys Acta. 2001;1540:59–67. doi: 10.1016/s0167-4889(01)00117-3. [DOI] [PubMed] [Google Scholar]
- 22.Yamamoto H, et al. Amino acid residues in the transmembrane domain of the type 1 sigma receptor critical for ligand binding. FEBS Lett. 1999;445:19–22. doi: 10.1016/s0014-5793(99)00084-8. [DOI] [PubMed] [Google Scholar]
- 23.Kovacs KJ, Larson AA. Up-regulation of [3H]DTG but not [3H](+)-pentazocine labeled sigma sites in mouse spinal cord by chronic morphine treatment. Eur J Pharmacol. 1998;350:47–52. doi: 10.1016/s0014-2999(98)00220-9. [DOI] [PubMed] [Google Scholar]
- 24.Martin WR, Eades CG, Thompson JA, Huppler RE, Gilbert PE. The effects of morphine- and nalorphine- like drugs in the nondependent and morphine-dependent chronic spinal dog. J Pharmacol Exp Ther. 1976;197:517–532. [PubMed] [Google Scholar]
- 25.Nguyen L, et al. Role of sigma-1 receptors in neurodegenerative diseases. J Pharmacol Sci. 2015;127:17–29. doi: 10.1016/j.jphs.2014.12.005. [DOI] [PubMed] [Google Scholar]
- 26.Mei J, Pasternak GW. Sigma1 receptor modulation of opioid analgesia in the mouse. J Pharmacol Exp Ther. 2002;300:1070–1074. doi: 10.1124/jpet.300.3.1070. [DOI] [PubMed] [Google Scholar]
- 27.Maurice T, Su TP. The pharmacology of sigma-1 receptors. Pharmacol Ther. 2009;124:195–206. doi: 10.1016/j.pharmthera.2009.07.001. [DOI] [PMC free article] [PubMed] [Google Scholar]
- 28.Gromek KA, et al. The oligomeric states of the purified sigma-1 receptor are stabilized by ligands. J Biol Chem. 2014;289:20333–20344. doi: 10.1074/jbc.M113.537993. [DOI] [PMC free article] [PubMed] [Google Scholar]
- 29.Mishra AK, et al. The sigma-1 receptors are present in monomeric and oligomeric forms in living cells in the presence and absence of ligands. Biochem J. 2015;466:263–271. doi: 10.1042/BJ20141321. [DOI] [PMC free article] [PubMed] [Google Scholar]
- 30.Lomize MA, Pogozheva ID, Joo H, Mosberg HI, Lomize AL. OPM database and PPM web server: resources for positioning of proteins in membranes. Nucleic Acids Res. 2012;40:D370–376. doi: 10.1093/nar/gkr703. [DOI] [PMC free article] [PubMed] [Google Scholar]
- 31.Caffrey M, Cherezov V. Crystallizing membrane proteins using lipidic mesophases. Nat Protocols. 2009;4:706–731. doi: 10.1038/nprot.2009.31. [DOI] [PMC free article] [PubMed] [Google Scholar]
- 32.Rasmussen SG, et al. Structure of a nanobody-stabilized active state of the beta(2) adrenoceptor. Nature. 2011;469:175–180. doi: 10.1038/nature09648. [DOI] [PMC free article] [PubMed] [Google Scholar]
- 33.Bricogne G, Vonrhein C, Flensburg C, Schiltz M, Paciorek W. Generation, representation and flow of phase information in structure determination: recent developments in and around SHARP 2.0. Acta Crystallogr Biol Crystallogr. 2003;D59:2023–2030. doi: 10.1107/s0907444903017694. [DOI] [PubMed] [Google Scholar]
- 34.Emsley P, Cowtan K. Coot: model-building tools for molecular graphics. Acta Crystallogr Biol Crystallogr. 2004;D60:2126–2132. doi: 10.1107/S0907444904019158. [DOI] [PubMed] [Google Scholar]
- 35.Afonine PV, et al. Towards automated crystallographic structure refinement with phenix.refine. Acta Crystallogr Biol Crystallogr. 2012;D68:352–367. doi: 10.1107/S0907444912001308. [DOI] [PMC free article] [PubMed] [Google Scholar]
- 36.Chen VB, et al. MolProbity: all-atom structure validation for macromolecular crystallography. Acta Crystallogr Biol Crystallogr. 2010;D66:12–21. doi: 10.1107/S0907444909042073. [DOI] [PMC free article] [PubMed] [Google Scholar]
- 37.Schrodinger, LLC. The PyMOL Molecular Graphics System, Version 1.3r1. 2010. [Google Scholar]
- 38.Pettersen EF, et al. UCSF Chimera--a visualization system for exploratory research and analysis. J Comput Chem. 2004;25:1605–1612. doi: 10.1002/jcc.20084. [DOI] [PubMed] [Google Scholar]
- 39.Morin A, et al. Collaboration gets the most out of software. eLife. 2013;2 doi: 10.7554/eLife.01456. [DOI] [PMC free article] [PubMed] [Google Scholar]
- 40.Ashkenazy H, Erez E, Martz E, Pupko T, Ben-Tal N. ConSurf 2010: calculating evolutionary conservation in sequence and structure of proteins and nucleic acids. Nucleic Acids Res. 2010;38:W529–533. doi: 10.1093/nar/gkq399. [DOI] [PMC free article] [PubMed] [Google Scholar]
- 41.Holm L, Rosenstrom P. Dali server: conservation mapping in 3D. Nucleic Acids Res. 2010;38:W545–549. doi: 10.1093/nar/gkq366. [DOI] [PMC free article] [PubMed] [Google Scholar]
- 42.Strop P, Brunger AT. Refractive index-based determination of detergent concentration and its application to the study of membrane proteins. Prot Sci. 2005;14:2207–2211. doi: 10.1110/ps.051543805. [DOI] [PMC free article] [PubMed] [Google Scholar]
- 43.Reisinger V, Eichacker LA. Analysis of Membrane Protein Complexes by Blue Native PAGE. PROTEOMICS. 2006;6:6–15. doi: 10.1002/pmic.200600553. [DOI] [PubMed] [Google Scholar]


