Abstract
Understanding the fundamental biophysics behind protein-nanoparticle (NP) interactions is essential for the design and engineering bio-NP systems. We describe the development of a protein-NP coarse-grained model adapted from a protein-(flat)surface interaction model and a structure centric coarse grained protein model. A key feature of our protein-NP model is its ability to quantitatively account for the hydrophobic character of residues in the protein and their interactions with the NP surface. In addition, the curvature of the NP is taken into account to capture protein behavior on NPs of different size. We evaluated this model by comparing our findings for the structure and adsorption of a model protein interacting with a NP to experimental work that provides protein structure-related information on a NP. We demonstrate that our simulation results successfully recapitulate the structure of the small protein GB1 on the NP for data from circular dichroism and fluorescence spectroscopy. In addition, the calculated protein adsorption free energy agrees well with the experimental value. We predict the dependence of protein folding on the NP size, surface chemistry, and temperature. Our model has the potential to guide NP design efforts by predicting protein behavior on NP surfaces with various chemical properties and curvatures.
Keywords: nanoparticle, protein corona, coarse-grained simulation, thermodynamics, free energy
TOC image
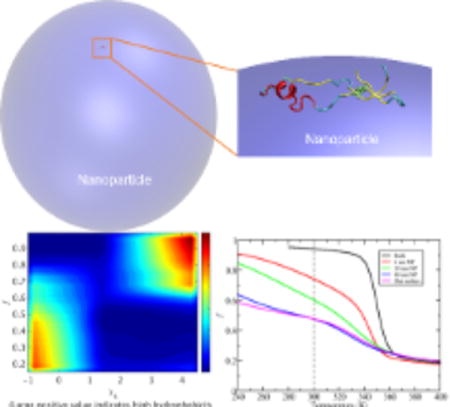
In this study we successfully build a general model to describe the interactions between protein residues and the nanoparticle (NP). Curvature and hydrophobic effects are accurately captured by this model so that predictions of protein behavior in various protein-NP systems are feasible. Therefore, we expect this model will play an important role in NP-biosensor design.
1. Introduction
Nanoparticle-based materials are emerging as key components of many new materials and techniques in biological applications, including diagnosis, imaging, drug delivery, catalysis, and biosensors.[1–4] Most of these approaches benefit from the distinct small size of nanoparticles. For example, NPs can be used to precisely deliver drugs to target tissues or cells, which can be difficult to achieve utilizing traditional techniques.[5, 6] Despite these successes and the advances that NPs have played a role in as components of drug delivery systems, toxicity remains a serious concern. A number of experimental studies, e.g. those by Linse et al.[7–9] have reported that polymeric nanoparticles may either catalyze or inhibit aggregation of amyloid proteins on surfaces, and that this behavior depends on the inherent protein stability, surface hydrophobicity, and surface curvature. These factors, together with surface charge and particle aggregation, are broadly recognized as main components controlling protein-nanoparticle interactions and have been well summarized in a review by Nel et al.[10] While the general importance of these individual factors is recognized, the inter-dependency of each factor is not well characterized, thereby limiting our ability to successfully design NP-based drug delivery systems.[5]
NPs may be prepared by many techniques with various base materials and surface-coatings, such as the popular self-assembled monolayers (SAMs). Besides the stability and chemical properties of NP surfaces, attention has focused on the type, function and chemical properties of the interior layer of proteins, or the “corona”, adsorbed on these particles. It is widely acknowledged that the protein corona on the NP, but not necessarily the NP surface, plays an important role in interacting with the environment of the biological system.[1, 8, 11] Adsorbed proteins may change their conformations on NP surfaces, which lead to possible unexpected functions or toxicity. Many biophysical methods for determining protein structure in solution, such as circular dichroism (CD), attenuated total reflection Fourier transform IR (ATR-FTIR), and nuclear magnetic resonance (NMR) spectroscopy, as well as atomic force microscopy (AFM), have been applied to study protein conformational change or orientation at solid interfaces.[12–18] Based on results from these methods, it is generally believed that several surface properties affect interactions between the first-layer proteins and NP surfaces, including the surface hydrophobicity,[19] the curvature of the NP and the protein shape.[4, 20] However, routine application of these experimental methods to characterize the details of protein-NP interactions is limited either due to the low-resolution structural information available from these techniques or difficulty in achieving measurements on surface adsorbed proteins. Nasir et al.[21] developed a high-throughput screening method to measure protein conformational changes on different NP materials over a large range of time scales (from milliseconds to days) using mobile fluorophores as indicators. Even though this method largely enhanced the experimental capability of testing the overall protein stability on NPs, further quantification of the detailed conformations of the denatured proteins is still needed. These challenges have limited our ability to understand the physical principles governing protein-NP interactions using experimental methods alone.
Molecular simulations provide a complementary tool for improving our understanding of the stability and structure of proteins on NP surfaces at high resolution. Probing protein folding on NP surfaces is largely inaccessible to atomistic simulations due to the long time scale and large-scale conformational rearrangements involved. A more computationally efficient and well-established alternative is the application of coarse-grained models to investigate protein folding at residue-level-resolution.[22–26] Although it seems clear that such an approach would be useful, only a few studies[27, 28] have employed coarse-grained models for protein-NP interactions, mainly due to the lack of a model with high quality parameters that is able to quantify the residue-level binding affinity between the protein and NP. For instance, Voicescu et al.[28] performed experiments and Monte Carlo simulations to understand how the proteins bovine serum albumin and human serum albumin behave on silver NPs. While that work revealed agreement between experiment and simulation for the overall change in protein structure due to protein-NP binding, a more detailed structural comparison to experimental measurements is not available. A coarse-grained model for protein-NP interaction was developed recently, which was used to estimate the binding energy and protein orientation of blood plasma on the NP.[27] This study discussed the surface chemistry and NP curvature effects on the protein binding affinity and on the protein preferential orientation. However, this model treats proteins as rigid bodies, thereby neglecting conformational changes due to the interactions between the protein and the NP. Fu et al.[29] investigated the effects of the hydrophobic interactions and dehydration on tertiary structure and aggregation of Alzheimer’s amyloid-β peptides interfacing a single-wall carbon nanotube (SWNT) using all-atom simulations. Such a study provided very interesting biophysical insights of peptide-nanotube interactions. Auer et al.[30] employed discontinuous molecular dynamics (DMD) to study peptide aggregation on a hydrophobic nano-sphere by a coarse-grained protein model and found that the peptide aggregation went through a condensation-ordering mechanism. Using the same type of amyloid peptides and simulation techniques (DMD), Radic et al.[31] employed a two-bead-per-residue coarse-grained model to study the effects of strength of non-specific peptide-NP attraction and peptide/NP relative concentrations on the peptide aggregation propensity. Their work revealed how different attractive forces could either promote or inhibit peptide aggregation on NP surfaces. Despite the interesting biophysical knowledge obtained by these models, quantitative comparison of detailed peptide structure and thermodynamic properties with experimental measurements were not addressed.
In this work, we develop a residue-resolution coarse-grained model to capture the effect of surface hydrophobicity and curvature on NP-protein interactions. Our method extends a coarse-grained model for protein-(flat) surface interactions[32] to describe the effect of curvature, or NP size, on protein stability and structure. Moreover, the model quantitatively accounts for the hydrophobicity of the surface that interacts with each residue in the protein. Since surface curvature and hydrophobicity are key factors influencing protein stability on NPs, we present a practical framework from which to investigate protein behavior on a NP. We assess this model for protein-NP interactions by comparing structural features of the protein G B1 domain (indicated as GB1 hereafter) on a NP surface to CD and fluorescence data and by showing that the protein adsorption free energy obtained from simulation is in excellent agreement with experiment.[33]
The GB1 is a small globular protein composed of a four stranded β-sheet and one α-helix with a total of 56 residues. The folding energy landscape of GB1 was successfully studied using the Karanicolas and Brooks (KB) -like model and found to be fully consistent with experimental observations.[23] Using the same protein model and combining it with the well-parameterized NP force field in this study, we are able to accurately access the folding/unfolding free energy surface and intermediate structures of GB1 while it contacts the NP surface. Given the difficulty in achieving high-resolution information reporting on protein structure and stability on NP surfaces, we predict protein behavior on NPs over a wide range of surface hydrophobicities and curvatures.
2. Results
2.1. Protein-NP model system
To test the model developed in this work (as outlined in the Methods section below), we built a protein-NP interaction system that reflects a recent experimental study in which interactions between the protein GB1 and latex NPs with a diameter of 80 nm were investigated.[33] In these experiments, changes in protein structure and solvent environment were probed by the fluorescence of a single tryptophan residue (W43) in GB1. The side chain of W43 is embedded in a hydrophobic pocket, such that the residue is only partially exposed to solvent (Figure 1), and thus the fluorescence of this residue is sensitive to (un)folding and adsorption on the NP surface. Since the surface of the latex NP is hydrophobic, the surface hydrophobicity parameter, , in our model is set to 4.5, which corresponds to a hydrophobic surface (see Methods). The reference experimental studies in Pan’s work[33] used a dilute protein (0.1 mg/mL) and latex NP (under 0.05% w/v concentrations) solution mixed in water by incubation or the stopped flow technique. The experiments were maintained at 25°C and neutral pH level (7.4), which correspond to the conditions of the KB Go-like model as developed in this work.
Figure 1.
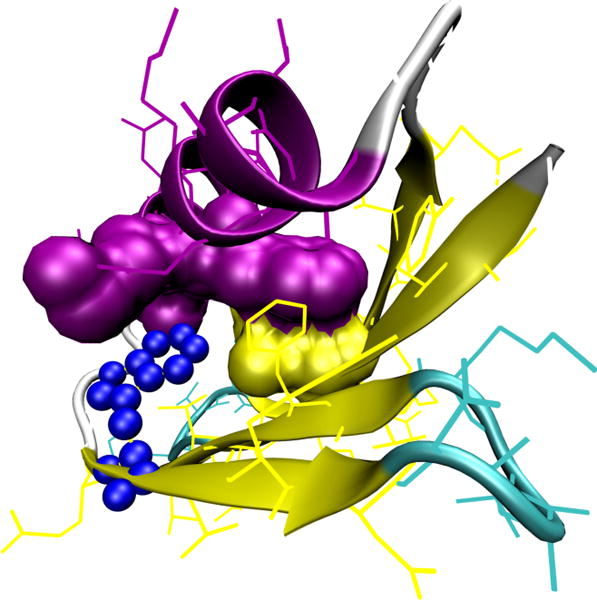
The overall structure is protein GB1 depicted in cartoon representation, with the secondary structure elements highlighted: yellow for β-stands, purple for an α-helix, and cyan for turns/coils. A single tryptophan residue (W43; blue beads) is responsible for a fluorescence signal in experiment.[33] Eight residues form native contacts with W43: four of these residues (F52, T53, V54, and T55) reside in the neighboring β-sheet and form native contacts with the backbone of W43, while the other four residues (L5, F30, K31, and A34 depicted by the van der Waals surfaces) interact with the side chain of W43.
2.2. Elucidating protein adsorption on hydrophobic NPs
We first investigate the mechanism of protein adsorption onto a hydrophobic NP, which parallels experimental adsorption measurements on latex NPs, using umbrella sampling methods (see Methods). [33] These methods allow us to measure the overall binding affinity of GB1 on the latex NP and provide the free energy landscape that characterizes the GB1 adsorption/unfolding pathway, with which we are interested to compare with the experimental study by Pan et al. [33] Throughout the umbrella sampling simulations, no restraint is applied on the protein conformation or orientation but only a harmonic restraint for the distance between the protein center and the center of NP sphere (see Methods).
As shown in Figure 2, the protein and NP do not interact at large separation distances between protein center and the NP surface (approaching 100 Å). As the protein approaches the NP, a barrier to protein-NP adsorption of ~4 kcal/mol appears (at ~26 Å). This barrier represents a desolvation effect preceding adsorption, as observed as the “dewetting” transition in the interaction of two hydrophobic surfaces.[34] Therefore, the free energy surface can be divided into two domains: one within the protein-surface separation distance of (26 Å for the hydrophobic NP surface), which we term the bound domain, and the other with a larger distance we call the unbound domain. The adsorption free energy for the hydrophobic surface with a specific (surface hydrophobicity) of 4.5 is calculated to be ~−2.5 kcal/mol. This result is close to the experimental result of ~−2.3 kcal/mol.[33] It is interesting to note that there are three local wells with a distance lower than 10 Å in the bound domain. Within a distance range of about 3.5 to 10 Å the NP surface is expected to have strong interactions with hydrophobic residues of the protein. The three minima on the free energy surface correspond to different GB1 interacting orientations on the NP.
Figure 2.
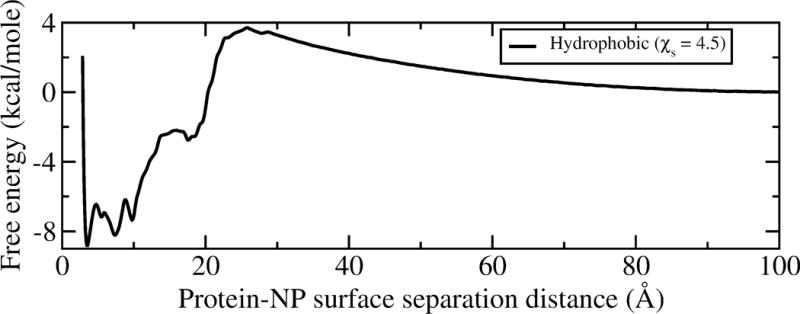
The adsorption free energy surface of GB1 as a function of its surface separation distance on a hydrophobic NP with the diameter of 80 nm.
We also constructed two-dimensional free energy surfaces to characterize how the protein structure changes as a function of the protein-NP separation distance (Figure 3). Changes in protein structure are tracked by the radius of gyration ( ) and fraction of native contacts (f). The two-dimensional free energy surfaces both reveal two broad basins: one which is located far from the surface (separation distance of ~40–50 Å), and another that is close to the NP surface (separation distance <15 Å). Figure 3(a) shows that GB1 has low until it is adsorbed onto the NP surface, where a larger range of values is accessed, suggesting that the protein is subject to large fluctuations in size due to its interactions with the surface. Similarly, Figure 3(b) exhibits f values near 1 when it is located far away from the NP surface and stable in its natively folded conformation. As the protein approaches the barrier separating the bound and unbound states from the unbound side, the native contacts decrease by about 20%. When GB1 proceeds into the bound domain (a separation less than ~26 Å), a significant number of native contacts break (to 40%) and lower f values are favored. Similar to the experimental observation, the mechanism of GB1 adsorption onto the latex NP occurs in two steps: a pre-adsorption equilibrium is reached rapidly with native-like structure followed by adsorption with GB1 partial denaturation induced by interactions with the NP surface. This finding suggests good consistency between our free energy surface obtained by umbrella sampling and the experimental data[33] of binding thermal equilibrium and adsorption/unfolding kinetics.
Figure 3.
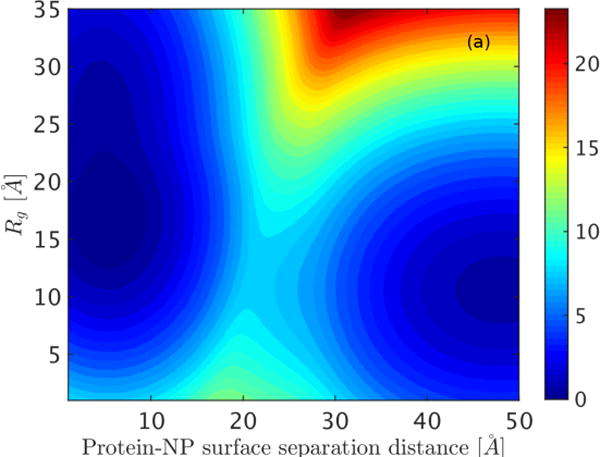
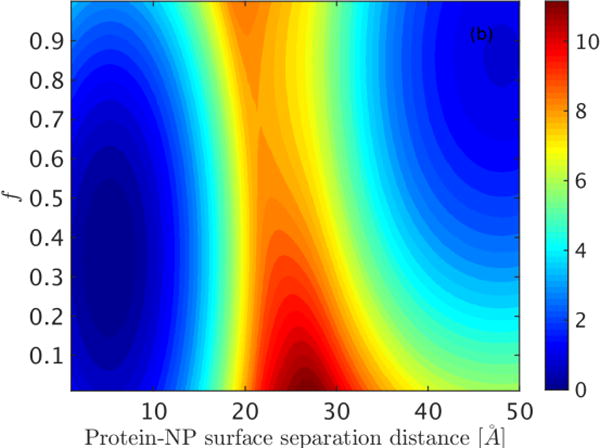
Free energy landscapes constructed in the plane of the protein-NP separation distance and (a) protein radius of gyration ( ) and (b) fraction of native contacts (f). Free energy is reported in units of kcal/mol.
2.3. Resolving the structure and orientation of intermediates associated with spontaneous adsorption on the NP surface
To further explore this model, we examine structural changes in GB1’s secondary structure due to interactions with the hydrophobic NP surface. We used temperature replica exchange simulations of GB1 on a hydrophobic NP of 80 nm diameter (see Methods). As shown in Figure 4(a), where we display the fraction of folded protein vs temperature, GB1 is partially denatured on the NP surface at 300 K, indicated by the value of 0.5 for the fraction of native contacts (f) at that temperature. As indicated by the sigmoidal decrease in the curve with inflection around 320 K, the remainder of the protein denatures at this temperature with a small degree of cooperativity. To provide more detail of the adsorbed structure at 300 K, we determined the secondary structure of the system, as plotted in Figure 4(b). As indicated in this figure, GB1 has lost most of its secondary structure, all of , more than half of the α region and , while most of and remain. A representative configuration is illustrated in Figure 4(c) using a cartoon scheme. In total, 38% of the helical structure and 32% of the beta sheet are maintained on the NP surface at 300 K. Remarkably consistent with the CD data from experiments, [33] our simulation results suggest a globular structure of GB1 with highly decreased secondary structure on the NP. The loss in secondary structure observed from the simulation is consistent with the decrease in the ellipticity signal at 222 nm and 210 nm as measured using CD experiments and the persistence of the interactions between the three β-sheets (Figure 4(b)) parallels the lack of change in the CD signal near 200 nm, which would indicate an increase of random coil structure.
Figure 4.
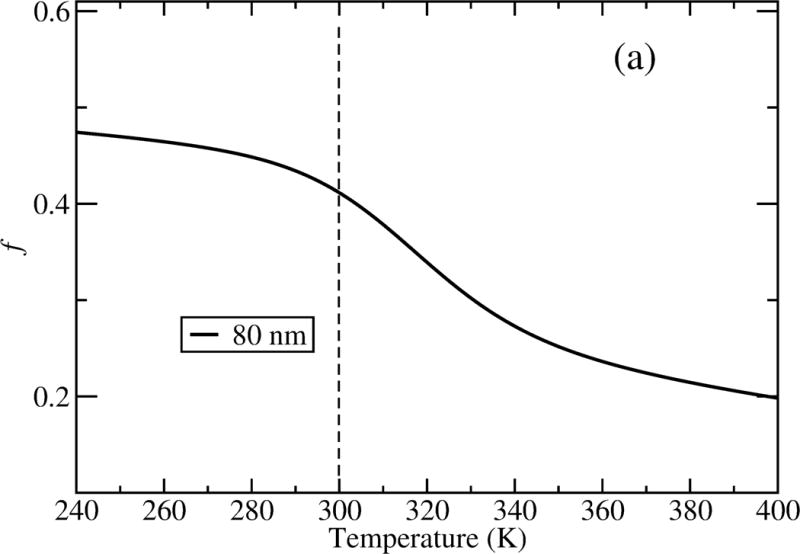
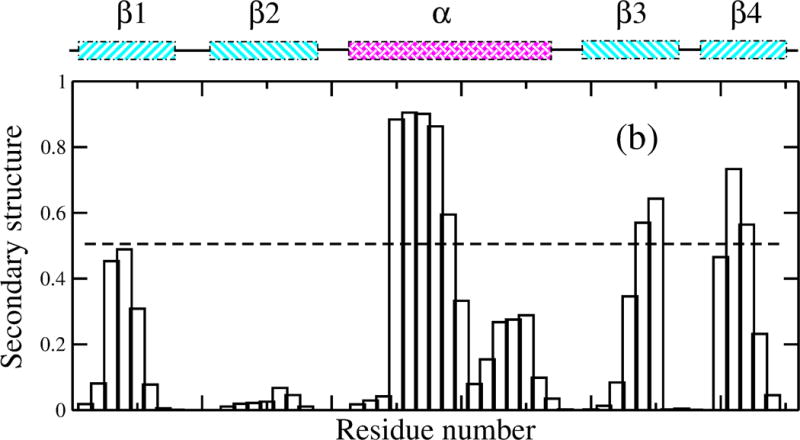
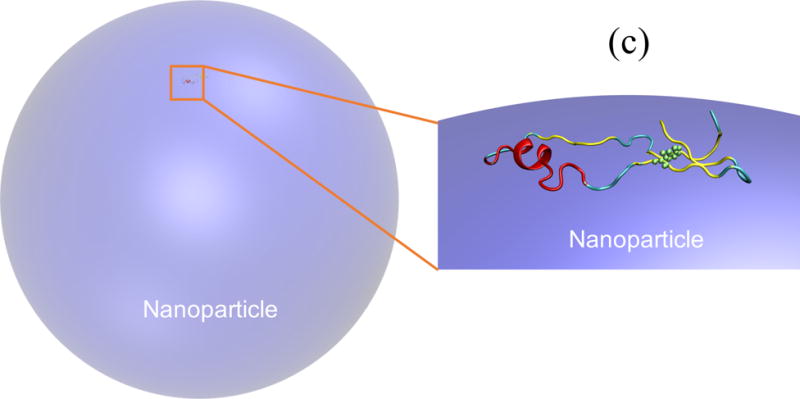
(a) Unfolding of GB1 on a hydrophobic NP with a diameter of 80 nm; (b) secondary structure formed at each residue for adsorbed GB1 at 300 K; and (c) a representative structure by cartoon showing W43 highlighted as green spheres in the cartoon representation.
As suggested by the adsorption/unfolding free energy surfaces (see Figure 3), GB1 adsorption and denaturation on the latex NP follows a two-step process. Therefore, we would like to further explore GB1 structure and orientation during this process. To achieve that goal, we performed 10 independent molecular dynamics simulations of GB1 adsorption on the hydrophobic NP. Simulations were initiated with fully folded GB1 located 16 Å from the NP surface and each was initiated with a random starting orientation. Since there is no biasing potential as used in these simulations, GB1 is free to accommodate any pose and structure during the adsorption process. The time evolution of the protein geometry is captured (Figure 5) from one typical simulation since all 10 simulations showed similar behavior. As shown in Figure 5, the protein adsorbs onto the NP surface through multiple stages as characterized by the decrease of the distance between GB1 and the NP surface and the increase of the protein radius of gyration. In the first stage, the protein-NP separation distance rapidly decreases from 16 Å to 10 Å, while the radius of gyration ( ) of the protein remains unchanged (~11 Å), as the protein adopts a pre-adsorbed configuration. During the second stage, a decrease in the protein-NP separation distance to 6 Å is accompanied by an increase in the to ~17 Å. The separation distance then decreases slightly, while the protein undergoes a large increase in the from ~17 to ~35 Å. The fully adsorbed protein then collapses to a globular structure (with the of ~17 Å) with no further change throughout the rest of simulations. This observation is fully consistent with our previous discussion concerning the two-step adsorption/denaturation process suggested by the free energy landscapes, which, in turn, is consistent with the adsorption process proposed based on the experiments.[33]
Figure 5.

Time evolution of the protein-surface separation distance to the NP surface (black curve) and the radius of gyration (red curve). Representative structures are shown at each stage of absorption, with W43 is highlighted by green spheres in the cartoon representations on the NP surface (purple).
Representative structures from each stage and the initial pose are also shown in Figure 5. The native structure of GB1 is placed at a distance of 16 Å from the NP surface. As it is first adsorbed on the NP, the protein rotates such that helical structural elements face the surface and a compact intermediate state is adopted. This pre-adsorbed configuration is consistent with the experimental observation of the blue-shift of the tryptophan fluorescence emission maximum,[33] the specific orientation of GB1 obtained from the simulation shows that W43 is fully buried in a hydrophobic shell covered by the NP surface (Figure 5). Unlike protein denaturation in bulk water, where the tryptophan fluorescence emission maximum would red-shift, the blue-shifted fluorescence emission curves indicate that W43 is surrounded by a more hydrophobic environment with little accessibility to water molecules.
Before proceeding to explore the behavior of this protein on NPs with various altered characteristics, e.g., surface hydrophobicity and particle size, we summarize our observations for the fidelity of the model in reproducing the experimental results:
from the binding free energy landscape we measured the GB1-latex NP binding affinity for an 80 nm spherical NP and found it to be in good agreement with experimental findings;
the adsorption free energy landscapes suggested a two-step mechanism of GB1 adsorption on the latex NP, with GB1 first adsorbed to the NP surface and then denatured. The same mechanism was recapitulated from the evaluation of GB1 structures during the course of kinetic binding simulations;
thermodynamic analysis confirmed the globular structure of GB1 on the NP surface at 300 K, which is consistent with the CD signal measured experimentally;[33]
GB1 adopts a pose on the NP with W43 buried in a hydrophobic shell and covered by the NP surface, which is consistent with the blue-shifted fluorescence from the experiment.[33]
Based on the success in describing GB1 adsorption on the 80 nm latex NP, we now use our model to predict protein properties for GB1, structure/thermodynamics, for NPs of varying size and composition. These predictions will be of utility in the design of NPs that yield desired protein structural characteristics when adsorbed on the surface and point the way to the use of our model as a general tool in exploring structure/thermodynamic/activity relationships for proteins interacting with NPs in the design of biosensors and related applications.
2.4. Predicting the dependency of GB1 stability on NP size and hydrophobicity
As discussed above, experimental findings indicate a dependency of protein thermal stability on NP size.[4, 9, 20, 35] To explore this dependence for GB1, we performed temperature replica exchange simulations (see Methods) on NPs with various sizes and compared protein stability to that in bulk solution and on a flat surface. For this comparison we used a moderately-hydrophilic NP surface (with = 1.5). A surface of moderate hydrophilicity was chosen to avoid either the strong interactions from a hydrophobic surface that could perturb the protein structure below room temperature or the weak interactions from a weakly hydrophilic surface that may be insufficient to keep the protein adsorbed at higher temperatures during the replica exchange simulation.
We captured the protein thermal stability by plotting the fraction of native contacts as a function of temperature. In bulk solution, the protein is a two-state folder (Figure 6 black curve) with a folding temperature of ~350 K. Adsorbing the protein onto NPs of increasing size (radii of 6 nm, 20 nm, and 80 nm) leads to progressively more unfolding at lower temperatures (Figure 6). These changes are accompanied by a decreased protein melting temperature and a less cooperative folding transition as the radius of the NP increases. The stability curve for the protein adsorbed onto a flat surface (Figure 6, magenta curve) is similar to that of the protein interacting with the largest NP (Figure 6, blue curve). The large NP surface curvature for the smallest NP radius allows better solvent accessibility to the adsorbed GB1, and thus behavior closer to that of bulk folding. Also, it is energetically unfavorable for the protein to distort to be fully adsorbed on the NP surface with large curvature, which contributes to a more stable structure compared to the flatter NP surfaces.
Figure 6.
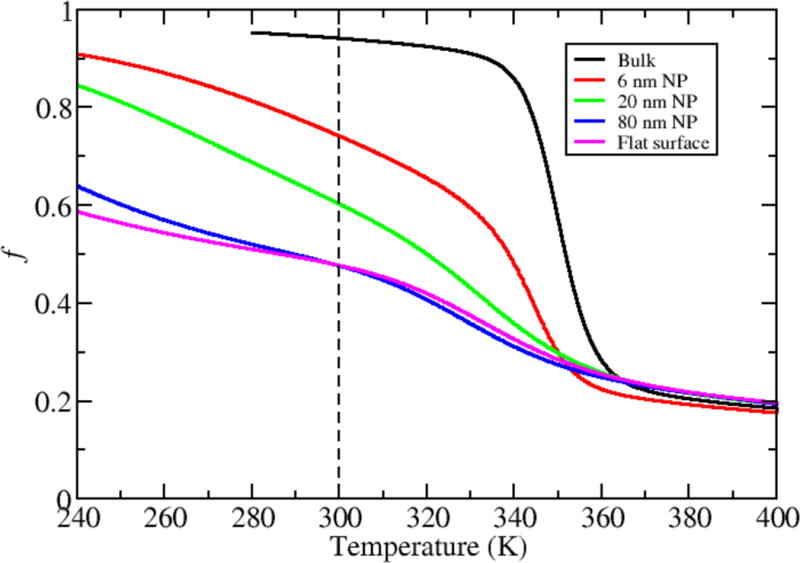
Dependence of protein stability on NP size.
To quantify the effect of secondary structure disturbance in the protein by the NPs with different sizes (including the flat surface), the fraction of secondary structure is estimated at 300 K (Figure 7). Most notably, upon interaction with NPs of increasing size, the protein loses all secondary structure in the strand and most of that in the α region, while the C-terminal region and the strand are less affected. The secondary structure profile for the largest NP and for the flat surface are nearly identical, with the region completely unfolded.
Figure 7.

The fraction of secondary structure motifs of GB1 NPs of varying size and on a flat surface at 300 K. The cyan regions show where the four β-sheets are located and the magenta region represents the α-helix in the middle of the protein sequence.
Using the conformational ensemble achieved from replica exchange simulations with the 80 nm-diameter NP and a moderately-hydrophilic surface as a reference, we next employed the Hamiltonian Mapping reweighting procedure[36, 37] in order to predict how protein folding depends on surface hydrophobicity (see Methods). We analyze the NP surface hydrophobic effect by constructing a free energy surface in the plane of the fraction of native contacts (f) and surface hydrophobicity ( ) (Figure 8). The hydrophobicity index on the horizontal axis ranges from −1.0 to 4.5, corresponding to surfaces from hydrophilic to hydrophobic. GB1 is well folded on the hydrophilic NPs with over 85% of native contacts maintained. On the other hand, interaction with hydrophobic surfaces results in a significant degree of protein unfolding (f 0.4), indicating a partially melted structure (see the final structure shown in Figure 4). A clear transition at 1.5 connects these two regions, and both folded and unfolded states exist on such moderately-hydrophilic surfaces. A similar trend is observed for the same free energy surface computed at different temperatures, with the transition region shifting toward more hydrophilic surfaces as the temperature increases (Figure S2). This prediction is consistent with several experimental measurements that show proteins are generally more stable on hydrophilic NPs than on hydrophobic ones. Since high temperature leads to protein denaturation, and thus increased hydrophobic exposure, a more hydrophilic NP may be required to maintain a folded protein structure at elevated temperatures. We also note that the protein sequence and nature of the protein surface should also influence these results. The protein GB1 has a sequence composition of 32% hydrophobic residues (A, I, V, L, F, C, M) and 68% hydrophilic residues (G, S, T, D, E, H, N, Q, K, Y, R, P, W) and exposes 663.1 Å2 of hydrophobic surface area. As the protein composition and surface character becomes more hydrophobic, we anticipate that the adsorption and partial denaturation on hydrophobic NPs will be accentuated from that observed here.
Figure 8.
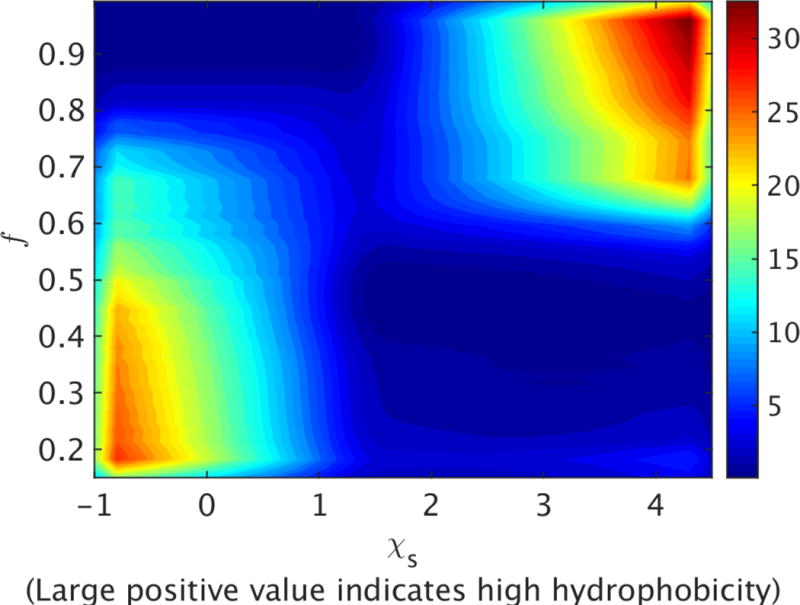
Dependence of protein stability on NP surface hydrophobicity for an 80 nm diameter NP. The free energy landscape is constructed in the plane of the fraction of native contacts (f) and surface hydrophobicity ( ) at 300 K. Free energy is reported in units of kcal/mole.
2.5. Predicting the dependency of GB1 adsorption affinity on NP size and hydrophobicity
As GB1 is adsorbed on hydrophilic surfaces (with negative values of ), the predicted folding structure of the protein suggests a weak interaction with the NP. However, it is unclear whether the adsorption affinity between the protein and NP is large enough to keep the protein on the surface. To test how the NP surface hydrophobicity would affect the adsorption affinity of GB1, we calculated the adsorption free energy surfaces (Figure 9) of GB1 on NPs with of 4.5, 1.5 and −1.0 (representing hydrophobic, moderately-hydrophilic, and hydrophilic surfaces) at 298 K using umbrella sampling simulations. As shown in the free energy surfaces (Figure 9), as the NP surface character becomes more hydrophilic, the adsorption energy well becomes shallower, which indicates a lower the adsorption affinity. This result is consistent with the prediction that the protein structure changes less as adsorbed on more hydrophilic NPs. As indicated by the red curve in the Figure 9, there is a clear negative peak at ~10 Å, which suggests a favorable adsorption distance between GB1 and the NP. When GB1 interacts with the more hydrophilic NP, as shown by the green curve in Figure 9, the free energy surface indicates positive values as the protein is close to the NP surface. This result suggests that it is favorable for GB1 to be desorbed from the hydrophilic NP. Therefore, to minimize the surface adsorption of the protein on the NP we would like a NP surface with low hydrophobicity. While if our purpose is to design a NP that maintains GB1 adsorbed on the surface and its native structure, the optimal surface hydrophobicity index should be just lower than 1.5, which is the transition point as suggested in Figure 8.
Figure 9.
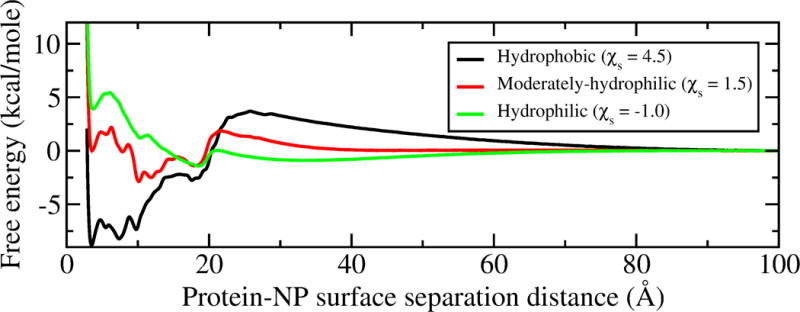
GB1 adsorption free energy surface on 80 nm NPs at 298 K with different hydrophobicity.
We also would like to understand if the adsorption affinity of GB1 depends on NP size. Again, to avoid the dominate hydrophobic effects, we choose the moderately-hydrophilic surface ( = 1.5) in the simulations to observe the size effect. The adsorption free energy surfaces of GB1 on NPs with different sizes are shown in Figure 10. As the NP size decreases, it is noticed that the de-wetting energy barrier of GB1 adsorption increases, which is consistent with our argument (see above) that the large curvature (on a small NP) would accommodate more solvent molecules between the protein and the NP surface. Furthermore, on all three NPs with different sizes, there is a favorable adsorption free energy minimum for GB1. It is also noticed that the NP size affects the protein-NP adsorption affinity, however, it is a much weaker factor compared to the surface hydrophobicity. The depth of the local minima on the free energy surfaces vary with different sizes of NP, which is again due to the different protein orientations.
Figure 10.
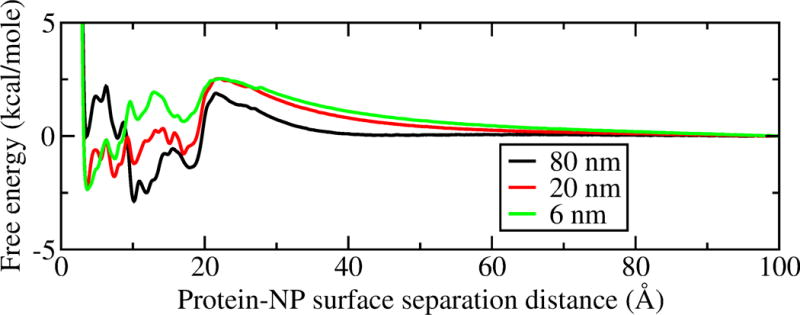
GB1 adsorption free energy surface on moderately-hydrophilic NP surfaces at 298 K with different sizes.
3. Conclusion
We built a simple coarse-grained model to study protein-NP interactions. Our model builds on the KB G -like protein model and a protein-flat surface force field, the latter of which has been successfully applied in several cases to predict protein or peptide behavior of SAM biosensors.[38–41] Our work represents a significant step toward a quantitative model to explore protein structure, energetics and function on spherical NPs, as it captures both the surface curvature of the NP and the surface chemistry that influences protein-NP interactions (e.g., the hydrophobic effect). Since the model was parameterized based on hydrophobic properties of several kinds of SAM surfaces, NP surfaces with hydrophobicity in a similar range would also be suitable to use with this model. Furthermore, this model can be used to describe protein-NP interactions with no charge-charge interactions such as polymer- and SAM-coated NPs. Moreover, the model is a promising framework for further development of more specific NP surface properties by adding extra potential terms. The corresponding parameters could be obtained and validated in close connection with experimental measurements such as binding affinity of each type of residue to the specific material surface.[42]
Our model accurately captures adsorption behavior and protein conformation on the surface of the NP, and our results are consistent with several experimental observations.[1–4] Intriguingly, we observed that GB1 is adsorbed onto the NP surface with an initial slight conformational change with a specific favored orientation. The adsorbed GB1 is then melted and refolded into a half-denatured structure followed by no further conformation or orientation change. This structure shows a large loss of the α-helix and structural elements but keeps most of the other β structure intact, indicating that the protein adopts a partially melted structure on the NP surface. The specific adsorption orientation and local conformational change of protein GB1 leads to a more hydrophobic environment of W43, which suggests a blue-shifted fluorescence signal as observed in the experimental work by Pan et al.[33] The adsorption free energy calculated for the GB1-NP interaction closely matches the experimental value, suggesting that we have achieved a proper balance between intermolecular protein-NP interactions and intramolecular protein folding forces. Furthermore, we predict the dependence of GB1 stability on NPs of varying size and hydrophobicities. The predictions suggest that a smaller NP with a more hydrophilic surface will maintain a folded GB1 structure; GB1 begins to unfold as the NP surface hydrophobicity increases. Moreover, the GB1 folding transition region progressively shifts to more hydrophilic values at elevated temperatures. These predictions were rapidly obtained using an efficient reweighting procedure[43] and a single, well-sampled trajectory. Thus, we anticipate that our model, albeit simple, will be useful for informing the experimental design of protein-NP systems.
4. Models
4.1. Coarse-grained model for protein-NP interactions
Protein-surface interactions are described based on the -resolution Karanicolas and Brooks (KB) G -like protein model,[23]which has successfully recapitulated experimental folding mechanisms for several systems.[22–26] In this model, native contacts provide the primary driving force for protein folding. Key features of the KB G -like model are the sequence-dependence of the native contact interactions and backbone torsional angle potential, as well as a non-bonded potential form that captures cooperative contact formation.[23] We use the form of this native contact potential as a basis for describing the interaction between each residue in the protein and the NP as indicated by Equation 1.
| (1) |
where the summation is over all residues (N) in the protein and and are the residue-specific interaction strength and radius, respectively. The values of are the hydropathy indices of the amino acids determined by experiment.[44] The values for are the parameterized hydropathy indices (with values of 4.5, 1.5, and −1.0) of the corresponding (hydrophobic, moderately-hydrophilic, and hydrophilic) surfaces.[32] The surface force field is calibrated by determining the coefficients such that identical adsorption free energy values are obtained at 298 K for peptide-SAM surface data sets. The coefficients are shown in Table 1, and details on how they were obtained can be found in previous work.[32]
Table 1.
Parameters for the surface model.
|
|
|
|
|
|
|||||
|---|---|---|---|---|---|---|---|---|---|
| 0.250 | 0.533 | 0.224 | 0.016 | 0.054 |
This equation, which represents the interactions between the nanoparticle and each of the protein amino acid sites, is an integrated interaction potential, where the first three terms describe the integrated, and generic, interactions between the NP and the protein sites and the last term accounts for the hydrophobicity of surface interactions with the protein residues.[32] This potential form accounts for both the protein-NP surface adsorption features and the desolvation effects associated with forming those interactions.
We further note that the influence of a finite radius spherical NP is accounted for through the introduction of a curvature scale factor ( ), in which is the radius of the NP sphere and is defined as the shortest distance between each residue and a point on the NP sphere. The quantity is calculated as
| (2) |
where is the distance between residue and the center of the NP. The scale factor is obtained by performing integration of the potential between each residue and surface atom over the whole NP surface. If is sufficiently large, the scale factor approximately equals unity and represents a flat surface.[32] On the other hand, if is sufficiently small, then this scale factor accounts for the curvature of the protein.
4.2. Renormalization of intramolecular folding forces
The G -like model used here, as described above, has been successful in reproducing folding mechanisms of numerous proteins. [22–26] However, to ensure that the protein model folding free energetics are congruent with the surface energetics, the coarse-grained interactions need to be renormalized. To achieve this objective, we rescale the contact energetics so as to reproduce the experimental folding temperature and this provides the desired balance between the intramolecular free energetics (interactions and chain entropy) and the empirically derived surface interactions. This allows for quantitative comparisons to be made between the simulated and experimental folding behavior in the absence and presence of interacting surfaces or NPs. The details of this renormalization procedure is described in the Supporting Information.
4.3. Calculating the adsorption free energy with umbrella sampling
To validate the protein-NP model we calculated the protein adsorption free energy on the NP using umbrella sampling methods.[45, 46] We employed a harmonic, center of geometry separation based biasing potential to sample protein-NP separations between 1 Å and 100 Å, as described in the Supporting Information. Our simulations utilized the canonical ensemble by thermostating molecular dynamics simulations at 298 K using a Nosé-Hoover integration scheme (see description in Supporting Information).[47–49]
4.4. Analyzing protein stability on NP surfaces with replica exchange simulations
As described above, surface curvature was taken into account in this model since it has been identified to affect the protein stability as adsorbed on a NP.[4, 20] Therefore, we would like to understand and predict protein stability on NPs as a function of various sizes. To that end, we employed temperature replica exchange (TREX) molecular dynamics simulations with a large temperature range to enhance the ability to sample protein-NP interactions and to measure the protein thermal stability. The details of replica exchange simulations for different NP sizes are described in Supporting Information.
4.5. Hamiltonian Mapping
We also would like to understand how different surface hydrophobicity affects GB1 stability. To address this question, we employed the Hamiltonian Mapping formalism[36, 37] to extrapolate the folding/unfolding ensemble of GB1 onto different NP surfaces. This analysis was based on one simulation trajectory with a reference Hamiltonian and achieved by reweighting the probability distribution of f (the fraction of native contacts). The details of this technique can be found in the Supporting Information.
Supplementary Material
Acknowledgments
This research was supported by the Army Research Office (W911NF-11-1-0251), National Science Foundation Award (CHE 1506273) and NIH Ruth L. Kirschstein National Research Service Award Postdoctoral Fellowship (to L.S.A., grant GM108298).
Footnotes
Supporting Information
Supporting Information is available from the Wiley Online
Contributor Information
Dr. Shuai Wei, Department of Chemistry, University of Michigan, Ann Arbor, Michigan 48109 USA
Dr. Logan S. Ahlstrom, Department of Chemistry, University of Michigan, Ann Arbor, Michigan 48109 USA
Charles L. Brooks, III, Department of Chemistry and Biophysics Program, University of Michigan, Ann Arbor, Michigan 48109 USA
References
- 1.Lynch I, Dawson KA. Nano Today. 2008;3(1–2):40–47. [Google Scholar]
- 2.Rumyantsev KA, Shemetov AA, Nabiev IR, Sukhanova AV. Nanotechnol Russ. 2013;8(11):700–720. [Google Scholar]
- 3.Sharma P, Brown S, Walter G, Santra S, Moudgil B. Adv Colloid Interface Sci. 2006:123–126. doi: 10.1016/j.cis.2006.05.026. [DOI] [PubMed] [Google Scholar]
- 4.Shemetov AA, Nabiev I, Sukhanova A. ACS Nano. 2012;6(6):4585–4602. doi: 10.1021/nn300415x. [DOI] [PubMed] [Google Scholar]
- 5.Bianco A, Kostarelos K, Prato M. Curr Opin Chem Biol. 2005;9(6):674–679. doi: 10.1016/j.cbpa.2005.10.005. [DOI] [PubMed] [Google Scholar]
- 6.Klumpp C, Kostarelos K, Prato M, Bianco A. Biochim Biophys Acta, Biomembr. 2006;1758(3):404–412. doi: 10.1016/j.bbamem.2005.10.008. [DOI] [PubMed] [Google Scholar]
- 7.Cabaleiro-Lago C, Szczepankiewicz O, Linse S. Langmuir. 2012;28(3):1852–1857. doi: 10.1021/la203078w. [DOI] [PMC free article] [PubMed] [Google Scholar]
- 8.Cedervall T, Lynch I, Lindman S, Berggård T, Thulin E, Nilsson H, Dawson KA, Linse S. Proc Natl Acad Sci USA. 2007;104(7):2050–2055. doi: 10.1073/pnas.0608582104. [DOI] [PMC free article] [PubMed] [Google Scholar]
- 9.Linse S, Cabaleiro-Lago C, Xue W-F, Lynch I, Lindman S, Thulin E, Radford SE, Dawson KA. Proc Natl Acad Sci USA. 2007;104(21):8691–8696. doi: 10.1073/pnas.0701250104. [DOI] [PMC free article] [PubMed] [Google Scholar]
- 10.Nel AE, Madler L, Velegol D, Xia T, Hoek EMV, Somasundaran P, Klaessig F, Castranova V, Thompson M. Nat Mater. 2009;8(7):543–557. doi: 10.1038/nmat2442. [DOI] [PubMed] [Google Scholar]
- 11.Lesniak A, Fenaroli F, Monopoli MP, Åberg C, Dawson KA, Salvati A. ACS Nano. 2012;6(7):5845–5857. doi: 10.1021/nn300223w. [DOI] [PubMed] [Google Scholar]
- 12.Giacomelli CE, Bremer MG, Norde W. J Colloid Interface Sci. 1999;220(1):13–23. doi: 10.1006/jcis.1999.6479. [DOI] [PubMed] [Google Scholar]
- 13.Giacomelli CE, Norde W. J Colloid Interface Sci. 2001;233(2):234–240. doi: 10.1006/jcis.2000.7219. [DOI] [PubMed] [Google Scholar]
- 14.Gray J. J Curr Opin Struct Biol. 2004;14(1):110–5. doi: 10.1016/j.sbi.2003.12.001. [DOI] [PubMed] [Google Scholar]
- 15.Kim DT, Blanch HW, Radke CJ. Langmuir. 2002;18(15):5841–5850. [Google Scholar]
- 16.Long JR, Shaw WJ, Stayton PS, Drobny GP. Biochemistry. 2001;40(51):15451–15455. doi: 10.1021/bi010864c. [DOI] [PubMed] [Google Scholar]
- 17.Sharp JS, Forrest JA, Jones RA. Biochemistry. 2002;41(52):15810–9. doi: 10.1021/bi020525z. [DOI] [PubMed] [Google Scholar]
- 18.Tarasevich YI, Monakhova LI. Colloid J. 2002;64(4):482–487. [Google Scholar]
- 19.Puddu V, Perry CC. ACS Nano. 2012;6(7):6356–6363. doi: 10.1021/nn301866q. [DOI] [PubMed] [Google Scholar]
- 20.Albanese A, Tang PS, Chan WCW. Annu Rev Biomed Eng. 2012;14(1):1–16. doi: 10.1146/annurev-bioeng-071811-150124. [DOI] [PubMed] [Google Scholar]
- 21.Nasir I, Fatih W, Svensson A, Radu D, Linse S, Cabaleiro Lago C, Lundqvist M. PLoS One. 2015;10(8):e0136687. doi: 10.1371/journal.pone.0136687. [DOI] [PMC free article] [PubMed] [Google Scholar]
- 22.Hills RD, Jr, Brooks CL., III Int J Mol Sci. 2009;10(3):889–905. doi: 10.3390/ijms10030889. [DOI] [PMC free article] [PubMed] [Google Scholar]
- 23.Karanicolas J, Brooks CL., III Protein Sci. 2002;11(10):2351–2361. doi: 10.1110/ps.0205402. [DOI] [PMC free article] [PubMed] [Google Scholar]
- 24.Karanicolas J, Brooks CL., III Proc Natl Acad Sci USA. 2003;100(7):3954–9. doi: 10.1073/pnas.0731771100. [DOI] [PMC free article] [PubMed] [Google Scholar]
- 25.Karanicolas J, Brooks CL., III J Mol Biol. 2003;334(2):309–25. doi: 10.1016/j.jmb.2003.09.047. [DOI] [PubMed] [Google Scholar]
- 26.Karanicolas J, Brooks CL., III Proc Natl Acad Sci U S A. 2004;101(10):3432–7. doi: 10.1073/pnas.0304825101. [DOI] [PMC free article] [PubMed] [Google Scholar]
- 27.Lopez H, Lobaskin V. J Chem Phys. 2015;143(24):243138. doi: 10.1063/1.4936908. [DOI] [PubMed] [Google Scholar]
- 28.Voicescu M, Ionescu S, Angelescu DG. J Nanopart Res. 2012;14(10):1–13. [Google Scholar]
- 29.Fu Z, Luo Y, Derreumaux P, Wei G. Biophy J. 2009;97(6):1795–1803. doi: 10.1016/j.bpj.2009.07.014. [DOI] [PMC free article] [PubMed] [Google Scholar]
- 30.Auer S, Trovato A, Vendruscolo M. PLoS Comput Biol. 2009;5(8):e1000458. doi: 10.1371/journal.pcbi.1000458. [DOI] [PMC free article] [PubMed] [Google Scholar]
- 31.Radic S, Davis TP, Ke PC, Ding F. RSC Adv. 2015;5(127):105489–105498. doi: 10.1039/C5RA20182A. [DOI] [PMC free article] [PubMed] [Google Scholar]
- 32.Wei S, Knotts TA., IV J Chem Phys. 2013;139(9):095102. doi: 10.1063/1.4819131. [DOI] [PubMed] [Google Scholar]
- 33.Pan H, Qin M, Meng W, Cao Y, Wang W. Langmuir. 2012;28(35):12779–12787. doi: 10.1021/la302258k. [DOI] [PubMed] [Google Scholar]
- 34.Berne BJ, Weeks JD, Zhou R. Annu Rev Phys Chem. 2009;60(1):85–103. doi: 10.1146/annurev.physchem.58.032806.104445. [DOI] [PMC free article] [PubMed] [Google Scholar]
- 35.Shang W, Nuffer JH, Dordick JS, Siegel RW. Nano Letters. 2007;7(7):1991–1995. doi: 10.1021/nl070777r. [DOI] [PubMed] [Google Scholar]
- 36.Law SM, Ahlstrom LS, Panahi A, Brooks CL., III J Phys Chem Lett. 2014;5(19):3441–3444. doi: 10.1021/jz501811k. [DOI] [PMC free article] [PubMed] [Google Scholar]
- 37.Shea J-E, Nochomovitz YD, Guo Z, Brooks CL., III J Chem Phys. 1998;109(7):2895–2903. [Google Scholar]
- 38.Li Y, Wei S, Wu J, Jasensky J, Xi C, Li H, Xu Y, Wang Q, Marsh ENG, Brooks CL, III, Chen Z. J Phys Chem C. 2015;119(13):7146–7155. [Google Scholar]
- 39.Ogorzalek TL, Wei S, Liu Y, Wang Q, Brooks CL, III, Chen Z, Marsh ENG. Langmuir. 2015;31(22):6145–6153. doi: 10.1021/acs.langmuir.5b01735. [DOI] [PubMed] [Google Scholar]
- 40.Wang Q, Wei S, Wu J, Zou X, Sieggreen O, Liu Y, Xi C, Brooks CL, III, Chen Z. J Phys Chem C. 2015;119(39):22542–22551. [Google Scholar]
- 41.Wei S, Brooks CL., III Chin Chem Lett. 2015;26(4):485–490. [Google Scholar]
- 42.Wei Y, Latour RA. Langmuir. 2009;25(10):5637–5646. doi: 10.1021/la8042186. [DOI] [PMC free article] [PubMed] [Google Scholar]
- 43.Law SM, Frank AT, Brooks CL., III J Comput Chem. 2014;35(24):1757–1761. doi: 10.1002/jcc.23683. [DOI] [PMC free article] [PubMed] [Google Scholar]
- 44.Nelson DL, Cox MM. Lehninger Principles of Biochemistry. W.H. Freeman; 2013. [Google Scholar]
- 45.Beutler TC, van Gunsteren WF. J Chem Phys. 1994;100(2):1492–1497. [Google Scholar]
- 46.Torrie GM, Valleau JP. J Comput Phys. 1977;23(2):187–199. [Google Scholar]
- 47.Hoover WG. Phys Rev A. 1985;31(3):1695–1697. doi: 10.1103/physreva.31.1695. [DOI] [PubMed] [Google Scholar]
- 48.Nosé S. J Chem Phys. 1984;81(1):511–519. [Google Scholar]
- 49.Nosé S. J Phys: Condens Matter. 1990;2(S):SA115. [Google Scholar]
- 50.Kumar S, Rosenberg JM, Bouzida D, Swendsen RH, Kollman PA. J Comput Chem. 1992;13(8):1011–1021. [Google Scholar]
- 51.Woo H-J, Roux B. Proc Natl Acad Sci U S A. 2005;102(19):6825–6830. doi: 10.1073/pnas.0409005102. [DOI] [PMC free article] [PubMed] [Google Scholar]
- 52.Ahlstrom LS, Law SM, Dickson A, Brooks CL., III J Mol Biol. 2015;427(8):1670–1680. doi: 10.1016/j.jmb.2015.01.002. [DOI] [PMC free article] [PubMed] [Google Scholar]
- 53.O’Brien EP, Brooks BR, Thirumalai D. J Am Chem Soc. 2012;134(2):979–987. doi: 10.1021/ja206557y. [DOI] [PMC free article] [PubMed] [Google Scholar]
Associated Data
This section collects any data citations, data availability statements, or supplementary materials included in this article.


