

Abstract
Adequate blood flow is essential to brain function, and its disruption is an early indicator in diseases, such as stroke and diabetes. However, the mechanisms contributing to this impairment remain unclear. To address this gap, in the diabetic and nondiabetic male mouse retina, we combined an unbiased longitudinal assessment of vasomotor activity along a genetically defined vascular network with pharmacological and immunohistochemical analyses of pericytes, the capillary vasomotor elements. In nondiabetic retina, focal stimulation of a pericyte produced a robust vasomotor response, which propagated along the blood vessel with increasing stimulus. In contrast, the magnitude, dynamic range, a measure of fine vascular diameter control, and propagation of vasomotor response were diminished in diabetic retinas from streptozotocin-treated mice. These functional changes were linked to several mechanisms. We found that density of pericytes and their sensitivity to stimulation were reduced in diabetes. The impaired response propagation from the stimulation site was associated with lower expression of connexin43, a major known gap junction unit in vascular cells. Indeed, selective block of gap junctions significantly reduced propagation but not initiation of vasomotor response in the nondiabetic retina. Our data establish the mechanisms for fine local regulation of capillary diameter by pericytes and a role for gap junctions in vascular network interactions. We show how disruption of this balance contributes to impaired vasomotor control in diabetes.
SIGNIFICANCE STATEMENT Identification of mechanisms governing capillary blood flow in the CNS and how they are altered in disease provides novel insight into early states of neurological dysfunction. Here, we present physiological and anatomical evidence that both intact pericyte function as well as gap junction-mediated signaling across the vascular network are essential for proper capillary diameter control and vasomotor function. Changes to capillary blood flow precede other anatomical and functional hallmarks of diabetes establishing a significant window for prevention and treatment.
Keywords: connexin43, diabetes, diabetic retinopathy, functional hyperemia, pericyte
Introduction
An issue of ongoing debate in the brain, including the retina, has been the mechanism for vasomotor control of capillary blood flow. Pericytes, the only contractile cells on the capillary walls, have been convincingly argued to bidirectionally regulate capillary diameter (Peppiatt et al., 2006) or to play no significant role (Hill et al., 2015). In particular, a large source of controversy stems from the assumption that there must be a strict spatial relationship between the presence of a pericyte and the vasomotor activity. This view, which potentially ignores heterogeneity in vascular interactions, often relies on a few spot measurements of the capillary diameter. In reality, these responses have a variety of attributes that are not accurately described by a single metric, demanding precise and robust means to evoke and measure vasomotor response. Better understanding of the mechanisms of vasomotor activity is essential because changes to capillary blood flow are an early event in numerous diseases (Hall et al., 2014) and will provide new insights for treatment strategies.
Similar to other parts of the body, retinal blood flow finely matches local activity, a process called functional hyperemia (Roy and Sherrington, 1890; Pournaras et al., 2008; Newman, 2013). In diabetes, vascular lesions and proliferative neovascularization are known features of advanced retinopathy. However, in diabetic patients as well as animal models of diabetic retinopathy, the earliest sign of disease is impaired functional hyperemia (Patel et al., 1992; Muir et al., 2012). What contributes to this impairment is unclear.
We addressed these gaps by using live whole-mount retina, a model system for brain neurovascular interactions, to combine vasomotor response assessment of defined capillary networks with pharmacological and immunohistochemical analyses of vasomotor elements. To provide a more comprehensive view, we developed an unbiased longitudinal vasomotor response assessment protocol. Specifically, for a capillary network within an intact retina, we performed a series of functional and structural measurements, rather than a single measurement. Using this approach, we detected and investigated vasomotor response to focal electrical stimulation and its impairment in diabetic retinopathy, a complication of diabetes and a leading cause of blindness (Kempen et al., 2004; Antonetti et al., 2012). In conclusion, our data establish mechanisms for fine local regulation of vascular diameter by pericytes and its widespread effect along gap junction-mediated vascular networks.
Materials and Methods
In all experimental procedures, animals were treated in compliance with protocols approved by the Institutional Animal Care and Use Committee of Weill Cornell Medicine, and in accordance with the National Institutes of Health Guide for the care and use of laboratory animals. The use and application of streptozotocin were in accordance with safety protocols approved by Weill Cornell Medicine's Environmental Health and Safety, Institutional Biosafety Committee, and Institutional Animal Care and Use Committee Protection and Control subcommittee.
Animal models.
Diabetes was induced in two mouse lines: C57BL/6 mice (The Jackson Laboratory, stock #000664, RRID:IMSR_JAX:000664) and NG2-DsRed mice (The Jackson Laboratory, Tg(Cspg4-DsRed.T1)1Akik/J, stock #008241, RRID:IMSR_JAX:008241). In all experiments, we used the streptozotocin (STZ) diabetic mouse model (Feit-Leichman et al., 2005). Male mice 6–8 weeks of age were fasted for 4 h before the injections. The animals were injected intraperitoneally on 5 consecutive days with 50 mg/kg STZ (Sigma-Aldrich, S0130) freshly dissolved in citrate buffer, pH 4.5. Control animals received a citrate buffer injection without STZ. In the STZ mouse model of diabetes, the levels of blood glucose reached maximum elevation at 1 month after STZ injection and remained elevated. The diabetes was defined by nonfasting blood glucose >300 mg/dl verified 1 month after the last STZ injection and confirmed on the day of the experiment. Glucose and body weight of the animals can be found in Table 1.
Table 1.
Body weight and glucose measurements in experimental animalsa
| Group | 1 d before injection |
5 weeks after injection |
16 weeks after injection |
|||
|---|---|---|---|---|---|---|
| Weight, g | Glucose mg/dl | Weight, g | Glucose, mg/dl | Weight, g | Glucose, mg/dl | |
| Nondiabetic | 19.8 ± 0.7 (19) | 195.0 ± 12.2 (19) | 25.4 ± 0.5 (19) | 154.3 ± 6.7 (19) | 31.8 ± 0.8 (19) | 171.6 ± 15.7 (19) |
| Diabetic | 20.2 ± 0.4 (21) | 198.2 ± 5.9 (21) | 20.7 ± 0.4 (21) | 506.0 ± 16.8 (21) | 25.6 ± 0.5 (21) | 484.9 ± 23.0 (21) |
| t test | p = 0.37 | p = 0.83 | p < 0.0001 | p < 0.0001 | p < 0.0001 | p < 0.0001 |
| Age | 7 weeks | 12 weeks | 24 weeks | |||
aValues in parentheses indicate number of animals in each group.
Whole-mount retina preparation.
Methods for whole-mount tissue preparation have been described in detail previously (Toychiev et al., 2013). After the animal was killed, its eyes were enucleated and placed in bicarbonate-buffered Ames solution, constantly equilibrated with 95% O2 and 5% CO2. It has been shown that variations in O2 level in brain tissue can affect functional hyperemia by modulating the synthesis of both neuronal and glial messengers (for review, see Attwell et al., 2010). Hall et al. (2014) directly compared the effects of 95% and more physiological 20% O2 on vasomotor activity in the isolated brain tissue. They showed that, while capillaries were more dilated in 20% versus 95% O2, they responded in the same direction to the stimuli in both conditions. In a separate report, maintaining artificially high O2 in vivo did not lead to smaller vasomotor response or emergence of vasoconstrictions (Lindauer et al., 2010). To reduce any discrepancy that may arise due to changing O2 levels, all our measurements have been made under consistent O2 levels across all experimental conditions. The cornea, iris, and lens were removed. The retina was dissected into four equal quadrants. Quadrants were placed photoreceptor surface down on a modified Biopore Millicell filter (Millipore). This preparation was transferred to a recording chamber on the stage of an upright Nikon FN1 microscope equipped with Hoffman modulation contrast optics (Modulation Optics) and bathed (1 ml/min) with bicarbonate-buffered Ames solution (Sigma, A1420). Pharmacological agents were added to this solution at a final concentration indicated in the text. All experiments were performed at a near physiological temperature of 32°C.
Vasomotor response assessment.
In the retina whole mount, identified pericytes (Fig. 1A–C) were targeted on capillaries in the superficial vascular layer (order 3–5 branches in Fig. 1D), avoiding those located on arterioles and veins. Capillaries were defined based on several morphological criteria: (1) diameter not exceeding 10 μm, approximately equivalent to the diameter of red blood cells, which are readily present in the living tissue; (2) lack of a smooth muscle actin (SMA; Fig. 1D–F); and (3) presence of clearly visible pericytes (Fig. 1E). In the initial experiments, we targeted fluorescently labeled pericytes in NG2-DsRed mice. In genetically unmodified mice, we were able to identify pericytes in contrast optics based on “bump on a log” appearance of the individual pericytes on the abluminal side of the vessel wall (Kawamura et al., 2003). The location of pericytes was confirmed using confocal microscopy of NG2-DsRed or anti-NG2-stained preparations following vasomotor assessment (Fig. 1E). Pericytes on straight capillaries and at the forks were focally stimulated by an increasing current pulse (0.1–1000.0 μA, 2 ms; Grass Technologies) using an electrode filled with HEPES-buffered extracellular Ringer's solution, containing the following (in mm): 137 NaCl, 2.5 KCl, 2.5 CaCl2, 1.0 MgCl2, 10 Na-HEPES, 28 glucose, pH 7.4. Electrodes were pulled from borosilicate glass (WPI, 1B150F-4) with a P-97 Flaming/Brown puller (Sutter Instruments) and had a measured resistance of ∼5 mΩ. For consistency across all experiments, the electrode was placed near the cell body of the targeted pericyte (Fig. 1C). During puff stimulation, electrode solution was supplemented with a vasoactive compound (Fig. 1F) and delivered with picospritzer (Parker Hannifin) via broken patch pipette positioned above the targeted pericyte. For the experiments involving light stimulation, the microscope's illuminator was used to deliver a 100 μm spot of light that was centered on the targeted pericyte cell body and focused on the photoreceptor cell layer. An aperture, a series of neutral density filters, and the FN-C LWD condenser (Nikon) were used to control the size, intensity, and focal plane of the stimulus. The tissue was adapted at 30 cd/m2, and stimulus was 270 cd/m2. Light spot 5 Hz flicker, an established stimulus to produce a robust vasomotor response, was controlled by a shutter (Uniblitz, Vincent Associates). Responses to stimuli were captured on video or time-lapse photo with a microscope-mounted Sony A7 s full frame camera. For consistency in capillary diameter measurements, the focus of the image was continually kept on capillary lumen aided by live image projection onto an external HDMI monitor. High-resolution images of blood vessels were analyzed in ImageJ (RRID: SCR_003070) using a region of interest (ROI) tracing tool. At each experimental condition, the capillary lumen cross sections were mapped at 2 μm steps along 150 μm lengths at each direction and at adjacent vascular branches (Fig. 1G). The ImageJ measure tool was used to generate numerical values, which were plotted against their relative position along the capillary to yield a vasomotor response profile (Fig. 1H). This X-Y profile was then imported to Spike2 software (CED) for further analysis. For each stimulus intensity, the response was measured as a deviation from the baseline diameter of the blood vessel (5 s before stimulation). R(I) = Rmax × Ib/(SI50b − Ib), where Rmax is the maximum response, I is the stimulus intensity (in log units), b is the slope factor, and SI50 is a stimulus intensity producing 50% of Rmax. The following metrics of vasomotor function were analyzed: peak amplitude of the response, the value of the maximum change in vessel diameter from baseline state; area of the response, change in the area above the response profile curve following stimulation; sensitivity index, SI50 in the Hill fit to intensity response (IR) curve; response dynamic range, span of intensity (in log units) over which response changes from 5% of Rmax to 95% of Rmax, estimated from a slope factor b in the Hill fit (Thibos and Werblin, 1978; Sampath and Rieke, 2004).
Figure 1.

Targeting pericytes for stimulation and analysis of vasomotor response in living retina. A–C, Fluorescent images of whole-retina explant from an NG2-DsRed mouse. NG2-positive mural cells, which include both pericytes on capillaries and veins and smooth muscle cells on arterioles, are readily identifiable. B, Fluorescent cells are visually identified as pericytes (arrowheads) and are selectively targeted for focal electrical stimulation. C, Differential interference contrast image of the same sample from B shows an electrode (arrow) in position to stimulate an identified pericyte (*). The identity and the dendritic tree of the stimulated pericyte are confirmed by pipette backfilling with Alexa-488 (inset). D, Immunohistochemical labeling of the same retina showing distribution of vascular elements. Arterioles (a) contain SMA-positive smooth muscle cells that form prominent bands around blood vessels. Expression of SMA decreases with order of the vessel indicated by a number. SMA is absent in veins (D) and capillaries (E, F). Pericytes with a characteristic cell body and finger-like processes are noted in capillaries (3–5) and veins (v) only. G, Probing and analysis of the vasomotor response. The diameter of capillary lumen is measured along its length at 2 μm steps. H, In this representative ROI, the varying diameter of the individual blood vessel branch adjacent to the stimulation site (*) is plotted in the series of diameter measurements. Plotting longitudinal vasomotor activity shows where the maximal response occurs and how it relates to the site of stimulation and pericyte location. This approach allows for quantification of both constrictive and dilatory vasomotor activity across the length of affected vascular network in response to electrical (H), chemical (I, J), and natural (light, K) stimuli. Scale bars: A, 1 mm; D, 150 μm; B, C, E–K, 50 μm. Scale bars: A, 1 mm; D, 150 μm; B, C, E–G, I–K, 50 μm.
Immunohistochemistry.
After physiological recording, each sample still attached to the Biopore insert was submersion-fixed in freshly prepared 4% carbodiimide in 0.1 m phosphate saline (PBS, pH 7.3) for 15 min at room temperature. After fixation, the samples were washed in PBS, and the retinas were separated from the insert. Retinal whole mounts were blocked for 10 h in a PBS solution containing 5% Chemiblocker (membrane-blocking agent, Millipore Bioscience Research Reagents), 0.5% Triton X-100, and 0.05% sodium azide (Sigma). Primary antibodies were diluted in the same solution and applied for 72 h, followed by incubation for 48 h in the appropriate secondary antibody, conjugated to Alexa-488 (1:1000; green fluorescence, Invitrogen), Alexa-568 (1:1000; red fluorescence, Invitrogen). In multilabeling experiments, whole mounts were incubated in a mixture of primary antibodies, followed by a mixture of secondary antibodies. All steps were performed at room temperature. After staining, the retinal pieces were flat mounted on a slide, ganglion cell layer up, and coverslipped using Vectashield mounting medium (H-1000, Vector Laboratories). The coverslip was sealed in place with nail polish. To avoid extensive squeezing and damage to the retina, small pieces of a broken glass coverslip (number 1 size) were placed between the slide and the coverslip. The primary antibodies used in this study were the following: rabbit anti-Cx43 (Cx43, 1:2000, Sigma-Aldrich, C6219, RRID:AB_476857), rabbit anti-NG2 coupled to Cy3 fluorescent label (NG2, 1:600, EMD Millipore, AB5320C3, RRID:AB_11214368), mouse anti-claudin5 coupled to Alexa-488 (claudin5, 1:10,000, Invitrogen, 352588, RRID:AB_2532189), and goat anti-mouse albumin (albumin, 1:800, Bethyl Laboratories, A90-234A, RRID: AB_67122). Polyclonal antibody against Cx43 was produced against a synthetic peptide corresponding to the C-terminal segment of the cytoplasmic domain (amino acids 363–382 with N-terminal added lysine) of human/rat Cx43. The antibody specificity was confirmed by Western blot and immunocytochemistry in human and rodent retina (Kerr et al., 2010; Danesh-Meyer et al., 2012). Blood vessels were visualized by Isolectin coupled to Alexa-488 fluorescent label (1:300, Invitrogen, I21411, RRID:AB_2314662). Stock solution of Isolectin was prepared as previously described (Connor et al., 2009) and further diluted in a mixture of the secondary antibody. Retinal samples were imaged under a Nikon Eclipse Ti-U confocal microscope. For Cx43 labeling, the 212 × 212 μm2 areas at the stimulation sites were evaluated with a 60× water objective (5 diabetic animals, 13 areas; 5 nondiabetic animals, 15 areas). For pericyte evaluation, the second eye of the same animal was imaged with 20× objective in the areas of 636 × 636 μm2 (5 diabetic animals, 10 areas; 6 nondiabetic animals, 12 areas). The samples from diabetic and nondiabetic animals were imaged under identical acquisition conditions, including laser intensity, photomultiplier amplification, and Z-stack step size. All images were processed and analyzed using ImageJ software (RRID:SCR_003070). For the quantitative analysis, Cx43 labeling was set at a fixed threshold level. The same threshold was applied to all samples, and only labeling with the intensity above the threshold was further evaluated. Each Cx43-positive plaque was identified using a particle recognition algorithm. In total, we evaluated 18295 individual Cx43-plaques in nondiabetic and 6430 Cx43-plaques in diabetic animals. The size of the individual plaques was measured. To calculate the density of the Cx43-plaque per capillary length, the blood vessels in the same images, labeled by Isolectin, were manually traced and their total length was estimated. NG2-positive labeling was evaluated using the same algorithm. In total, we evaluated 1007 individual pericytes in nondiabetic and 561 pericytes in diabetic animals.
Statistical analysis.
Statistical analysis was performed in either SPSS version 19 (IBM, RRID:SCR_003210) or SigmaPlot version 11 (Systat, RRID:SCR_003210), using t test. For multiple comparisons, ANOVA with post hoc Tukey's test or repeated-measures ANOVA was used. The data are presented as mean ± SE. The number of samples (N) indicates number of animals per group. To avoid introduction of nonindependent data into statistical analysis, first, multiple samples from individual animals were averaged within subject; then the data between animals were compared (Aarts et al., 2014).
Results
Unbiased longitudinal measurements reveal robust vasomotor response following focal pericyte stimulation in the living retina
In each retina capillary region, we obtained >150 measures of vascular lumen at a 2 μm interval along the length of the capillaries covering ∼300 μm around the site of stimulation. This allowed for volumetric comparisons between and within capillary branches. In both nondiabetic and diabetic retinas, with increasing stimulus intensity, we monitored the local lumen diameter changes and recruitment of additional proximal and distal pericytes estimated from expansion of the vasomotor response beyond the anatomical borders of stimulated pericyte. In living tissue, dendritic field of the target pericyte was determined by backfilling with Alexa-488 fluorescent dye via stimulating patch pipette (Fig. 1C, inset). This image was then matched to NG2-DsRed-labeled pericyte network. Direct electrical stimulation provides robust quantification of pericyte-mediated vasomotor activity (Peppiatt et al., 2006). We also tested our approach to measure spatial profiles of both constrictive and dilatory vasomotor activity to a battery of more natural stimuli. Purinergic receptor agonist UTP (100 μm) constricted capillaries (Fig. 1I), whereas sodium nitroprusside, an NO donor (100 μm), increased capillary diameter (Fig. 1J) at the area adjacent to the site of delivery, as did stimulation with a light spot flicker (100 μm diameter at 5 Hz; Fig. 1K). Some of the benefits of our approach to measure vascular diameter along the length of capillaries are illustrated in Figure 1G–K: (1) it measures the vasomotor response where it actually occurred, and not where it is anticipated to take place; (2) it quantifies spatial and temporal interactions among local and distant vascular networks; and (3) when combined with pharmacological and structural assessment of vasomotor elements, this approach provides a deeper insight into both fundamental properties of the vasomotor activity as well as how it is affected in disease.
Vasomotor response magnitude is impaired in early stages of diabetes
Using the longitudinal measurements approach, we compared the vasomotor responses in both nondiabetic and early diabetic retinas. Here, we define early diabetes as a condition with persistent hyperglycemia before appearance of manifest vascular deficit, such as acellular capillaries and tortuosities. The presence of the retina–blood barrier was also verified with a blood albumin assay, showing that albumin was contained within blood vessel in both nondiabetic and early diabetic retinas. Claudin5, a tight junction component, also appeared to be similar across nondiabetic and early diabetic samples (Fig. 2F). The stimulus protocol consisted of a series of brief (2 ms) electrical pulses applied at 0.5 log unit increments from 0.1 to 1000 μA and separated by time sufficient for 90% recovery (10 s to 30 min). At each stimulus intensity, the response amplitude was measured as a maximum change of vascular lumen diameter from the baseline value at 5 s before stimulation (dD/Dbase). In nondiabetic retinas, changes in diameter increased with stimulus intensity (Fig. 2); the contractile response was centered on the site of stimulation, where the electrode contacted the capillary. With increasing levels of stimulus, the response was more pronounced, both in the amount of contraction and in the extent of its propagation along the capillary, measured as a change in vascular lumen area. In diabetic retina (8–12 weeks following the onset of hyperglycemia), vasomotor responses were significantly reduced in both maximal response amplitude (Fig. 2D; 0.95 ± 0.027 vs 0.63 ± 0.078, nondiabetic vs diabetic, respectively, p < 0.001, N = 7 mice with 2 or 3 sites per mice in each group) as well as change in vascular lumen area following stimulation (Fig. 2E; 612 ± 68 μm2 vs 136 ± 17 μm2, nondiabetic vs diabetic, respectively, p < 0.001, N = 7 mice with 2 or 3 sites per mice in each group; see also Movies 1, 2). These data demonstrate that both local vasomotor response and its propagation are impaired at the early stages of diabetes.
Figure 2.
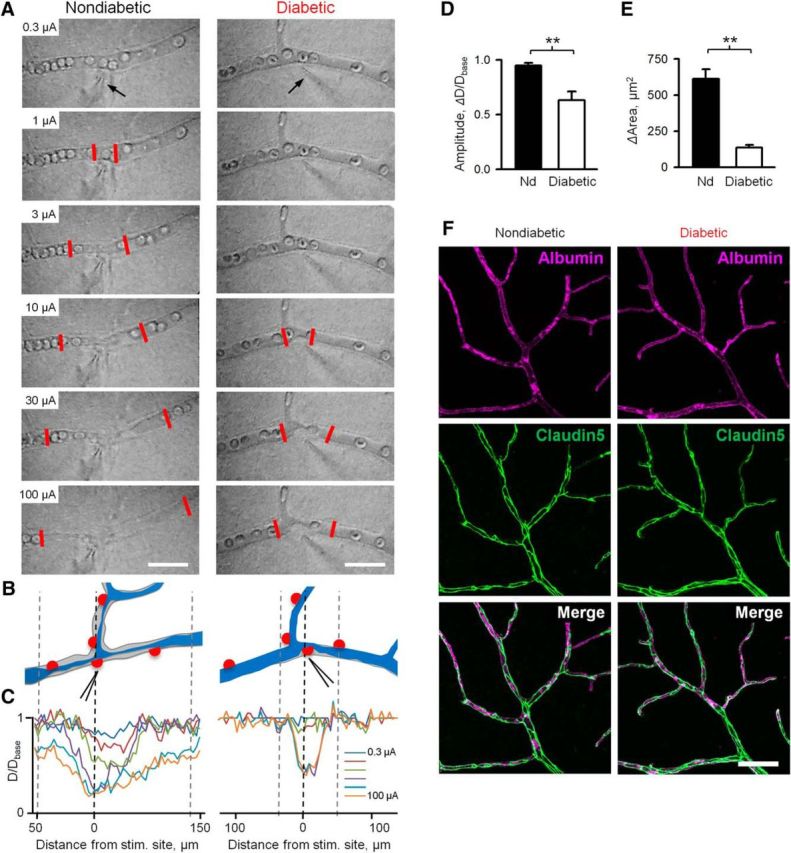
Decline in vasomotor function during early stages of diabetes. A, Vasomotor response to stimuli of increased intensity in nondiabetic and diabetic retinas. Contractility of pericytes was assessed by focal stimulation with a patch pipette (arrow). The number on top of each panel indicates stimulus strength. Stimulus (2 ms) was delivered in 0.5 log steps of increasing intensity in a range of 0.1–1000 μA with interstimulus interval (30 s to 30 min) sufficient to reach >90% recovery to baseline diameter. Low threshold-graded propagative vasomotor response of nondiabetic (area between two red lines) is impaired in diabetic retina. Scale bar, 50 μm. B, Schematic representation of nondiabetic and diabetic capillaries before (gray) and after (blue) plateau response. C, Spatial assessment of change in capillary lumen at different stimulus intensities. For representative responses at 30 μA stimulus at each condition, see Movies 1 and 2. D, E, Histograms of peak vasomotor response amplitude and vasomotor response area, measured as magnitude of change of capillary diameter (D) or area (E) from a state 5 s preceding stimulus (base) in nondiabetic and diabetic retinas (n = 7 mice with 2 or 3 sites per mice in each condition). F, Phenotypic comparison of vascular structure (albumin) and tight-junction elements (claudin5) in nondiabetic and diabetic retinas. Scale bars, 50 mm. Error bars indicate SEM. **p < 0.01.
Contractile vasomotor response to pericyte stimulation in nondiabetic retina. Capillary response to electrical stimulation (zap) of identified pericyte with a patch electrode. Stimulus (30 μA, 2 ms) is delivered at the beginning of the recording. Movie shows both contractile response and recovery phase at 10× original speed. For quantification of the response and its profile, see Figure 2.
Contractile vasomotor response to pericyte stimulation in diabetic retina. Capillary response to electrical stimulation (zap) of identified pericyte with a patch electrode. Stimulus (30 μA, 2 ms) is delivered at the beginning of the recording. Movie shows both contractile response and the beginning of recovery phase at 10× original speed. At this example, full recovery took 7 min and was truncated for space limitations. For quantification of the response and its profile, see Figure 2.
During the longitudinal analysis, we observed an intrinsic heterogeneity in vasomotor response propagation along the capillary network (Fig. 3), which, to our knowledge, represents the first physiological evidence for distinct types of vasomotor interactions in the CNS. In Type A or “node” mode (16 of 74 vascular sites), the vasomotor response was initially contained around a stimulated pericyte and, with increasing stimulus intensity, activated focal responses around nearby pericyte regions. The response could also be observed even at more distant pericytes on upstream and downstream vascular branches (Fig. 3B, top). In the most frequent Type B or “tide” mode (44 of 74 vascular sites), the local response spread gradually along the capillary without appearance of nodes at any stimulus intensity (Fig. 3B, middle). In some instances (14 of 74 vascular sites), initial focal responses bridged together at the highest intensity to form Type AB, or “wave” propagation mode (Fig. 3B, bottom). Importantly, capillaries of all propagation types appeared to be affected in diabetic retina. Due to diminished propagation, the precise susceptibility of individual activity modes to diabetes was not clear and will require further investigation at even earlier time points following the onset of hyperglycemia. In our experiments in both nondiabetic and diabetic retinas, we targeted vascular regions that appeared anatomically similar and were located at comparable branching points. Thus, the physiological data provide further evidence that vasomotor impairment in diabetes was not due to sampling across distinct functional types of vascular capillaries in nondiabetic and diabetic retinas but rather reflect a common pathophysiology of diabetic vasculature.
Figure 3.

Types of vasomotor response and effect of diabetes. A, Schematic representation of vasomotor response and its propagation from stimulus site (*) along the capillary. B, The series of responses to a stimulus step of increasing intensity in each of the types in nondiabetic and diabetic capillaries. *Stimulus electrode placement. Dotted vertical lines indicate location of pericyte cell bodies.
Reduction in sensitivity and dynamic range of pericyte response contributes to vasomotor deficit in diabetes
Next, we wanted to determine the mechanisms responsible for vasomotor impairment in diabetes. First, we hypothesized that a reduction in pericyte sensitivity to stimulation would result in both a diminished response amplitude and reduced vasomotor response propagation in diabetic retina. The sensitivity index of vasomotor response was estimated by fitting the Hill equation to the IR plots of vasomotor activity amplitude values at different stimulus intensities, then taking the SI50 value, the stimulus intensity producing the half-maximum response (Fig. 4B–D) (Thibos and Werblin, 1978). The intensity values are shown as attenuation (in log units) from the maximum stimulus. Hence, the more negative values indicate lower threshold/higher sensitivity. We found that sensitivity of vasomotor response was significantly reduced in diabetic retinas compared with retinas from sham-treated nondiabetic animals (−2.39 ± 0.114 vs −1.59 ± 0.035 log units in nondiabetic vs diabetic, respectively, p = 0.0001, N = 5–7 mice with 2 or 3 sites per mice in each group). Next, we determined the dynamic range of vasomotor response, a functionally important metric quantifying the ability of the system to fine-tune vascular diameter by vasoactive input.
Figure 4.

Sensitivity index and dynamic range of vasomotor response are reduced in diabetic retina. A, Waterfall representations of spatial profiles of lumen diameter following focal pericyte stimulation along the capillaries in nondiabetic (top) and diabetic (bottom) retina as a function of stimulus intensity. Representative profiles at 0.1–100 μA, 2-ms-long stimuli delivered at 0.5 log unit steps. At each trace, horizontal dashed lines indicate the baseline state of capillary lumen before stimulus. B, IR function, or vasomotor response amplitude, measured at site of maximum deviation of capillary lumen from its baseline before stimulation as a function of stimulus intensity fitted by the Hill equitation. C, IR functions normalized to peak response. Steepness of the curve is determined by the Hill factor b and the position along the stimulus intensity axis depends on SI50, both derived from the Hill fit. The dynamic range (DR) of the vasomotor response was defined as a span of stimulus intensity, in log units, over which response changes from 5% to 95% of Rmax. Sensitivity index was estimated by SI50, intensity producing 50% of Rmax (for calculations, see Materials and Methods). Vasomotor response sensitivity (D) and response dynamic range (E) in nondiabetic and diabetic mice (n = 7 mice with 2 or 3 sites per mice in each condition). Error bars indicate SEM. **p < 0.01.
The dynamic range of the vasomotor response was defined as a span of stimulus intensities (in log units) producing incremental response changes from 5% to 95% of its peak value and was computed from the slope parameter b of the Hill fit to IR function (Fig. 4C,E). Therefore, higher values indicate wide dynamic range and more gradual modulation of vascular diameter. In diabetic animals, the dynamic range was significantly narrowed (2.87 ± 0.184 vs 1.72 ± 0.121 log units nondiabetic vs diabetic, respectively, p = 0.00012, N = 5–7 mice with 2 or 3 sites per mice in each group), suggesting impaired mechanisms for fine regulation of vascular diameter in diabetes. Together, our data provide evidence that stronger stimuli were needed to elicit response in diabetes compared with unaffected animals, potentially impairing the spread of the vasomotor activity as neighboring pericytes were less sensitive to incoming signals.
Pericyte-to-pericyte network interactions are impaired in diabetes
Next, we wanted to determine how a change in pericyte sensitivity to vasoactive stimulation related to diminished pericyte-to-pericyte signaling and impaired propagation of the vasomotor response. In each sample, with increasing stimulus intensity, we compared the relationship between the local lumen diameter changes and recruitment of additional pericytes estimated from an increase in vasomotor response area beyond the anatomical borders of stimulated pericyte. In living tissue, this was accomplished by comparing the dendritic field of the stimulated pericyte backfilled via patch pipette with Alexa-488 to a NG2-DsRed image of the surrounding pericyte network (Fig. 1C, inset). We hypothesized that, in an intact vascular network, the most sensitive site where initial response would occur was the site immediately adjacent to stimulation. This is consistent with the earlier findings showing the strongest vasomotor response at the stimulation site, regardless of its proximity to pericyte (Peppiatt et al., 2006; Kornfield and Newman, 2014). Upon increasing levels of stimulus, adjacent areas would become responsive, due to sensitivity lag in lateral signaling. Furthermore, the site of stimulation would saturate sooner due to complete constriction of the blood vessel, whereas the area of the response would continue to grow as expanding lateral capillary regions get involved due to signal propagation (Fig. 5A). In this example, the shaded area over the curve corresponds to expanding response. Therefore, the dynamic range of the area would be wider than the dynamic range of the local response amplitude. Consistent with this hypothesis, in nondiabetic retina, response area was less sensitive compared with local amplitude profile (−2.35 ± 0.093 vs −1.73 ± 0.078 log units, amplitude vs area sensitivity, respectively, N = 11 sites in 7 mice, p = 0.0017, paired t test), and the dynamic range of the response area was significantly wider compared with local amplitude (2.87 ± 0.184 vs 3.42 ± 0.074 log units, response amplitude vs area dynamic range, respectively, N = 11 sites in 7 mice p = 0.019, paired t test). This observation was consistent in 10 of 11 samples from 7 nondiabetic mice and supported a model, in which once propagation threshold was reached, gradual recruitment of the expanding vascular area took place (Fig. 5B,E,F).
Figure 5.

Propagation of vasomotor response is impaired in diabetic retina. A, C, Schematic representation of local (focal diameter amplitude) and longitudinal (vascular area subject to diameter change) and their descriptive power of vasomotor response propagation event in nondiabetic and diabetic retina. B, D, Comparison of representative Hill fits with 95% confidence (shaded) to intensity-response curves for both response amplitude and response area for the same retinal capillary in nondiabetic and diabetic retina. E, Relationship in vasomotor response propagation sensitivity derived from SI50 in nondiabetic and diabetic retina. F, Relationship in vasomotor response dynamic range, a span of stimulus intensities producing 5% to 95% of response, in nondiabetic and diabetic retina. *p < 0.05, **p < 0.01.
We found that this mechanism was impaired in diabetic retina (Fig. 5C,D). In contrast to nondiabetic retina, dynamic range of vasomotor response area in diabetes was not significantly different from local aptitude dynamic range (Fig. 5F; 1.72 ± 0.121 vs 1.55 ± 0.235 log units, amplitude vs area dynamic range, respectively, N = 11 sites in 7 mice, p = 0.041, paired t test) even as sensitivity declined (Fig. 5E; −1.59 ± 0.046 vs −1.39 ± 0. 072 log units, amplitude vs area sensitivity, respectively, N = 11 sites in 7 mice, p = 0.284, paired t test). This divergence suggests impairment in pericyte-to-pericyte signaling leading to diminished recruitment of expanding vascular area and propagation. Therefore, three key physiological differences were evident in diabetes: (1) the maximum response Rmax was reduced, (2) the dynamic range of the response was diminished, and (3) responses did not propagate over distance. Next, we wanted to determine the mechanisms contributing to pericyte-to-pericyte signaling and whether they were affected in diabetes.
Direct evidence for gap junction role in pericyte communication in vasomotor response
The mechanisms of pericyte network interactions remain unclear. Earlier work in cardiac capillaries (for review, see Figueroa and Duling, 2009) as well as in diabetic retinal vascular explants (Oku et al., 2001) has suggested that Cx43-containing gap junctions play a role in pericyte-to-pericyte interactions. Here we wanted to determine whether gap junction-mediated interactions were essential to vasomotor response signaling and whether decline in Cx43-containing gap junctions contributed to vasomotor impairment in diabetes. To determine the role of gap-junction-mediated vascular interaction in vasomotor activity, we measured the vasomotor response before and following application of selective gap-junction blocker, meclofenamic acid (MFA, 25 μm). Importantly, this lower concentration of MFA was chosen based on recent studies showing that it avoids a common nonspecific action of 100 μm of MFA to disrupt neuronal synaptic activity, which may have an undesired effect on vasomotor response (Toychiev et al., 2013; Barrett et al., 2015). In particular, these studies have indicated that a 20 min application of 25 μm MFA was effective in blocking gap junctions without a significant effect on neuronal spiking activity. A stimulus (10 μA, 2 ms) was drawn from established IR curves (Fig. 4B) to produce a potent, yet recoverable, vasomotor response at a site of stimulation, which in nondiabetic retina readily propagated in both adjacent and more distant regions of vascular network (Fig. 6A). We found that the responses at regions outside of the stimulation site were significantly diminished following application of MFA (Fig. 6Aii–Aiv,B; 0.65 ± 0.048 vs 0.29 ± 0.052 vs 0.51 ± 0.034, control, MFA and recovery, respectively; N = 7 mice, p < 0.001 for all pairwise comparisons, repeated-measures ANOVA). In contrast, block of gap junctions did not have a significant effect on vasomotor response at the site of stimulation (Fig. 6Ai; 0.68 ± 0.046 vs 0.63 ± 0.039 vs 0.64 ± 0.054, control, MFA and recovery, respectively; N = 7 mice, p = 0.235, repeated-measures ANOVA), indicative of their primary role in pericyte network signaling and less in vasomotor response generation.
Figure 6.

Gap junctions contribute to propagation but not initiation of vasomotor response. A, Superimposed transmitted and fluorescent light images of retinal whole-mount ROI (80 × 35 μm) in NG2-DsRed mouse retina whole mount. Scale bar, 50 μm. Ai–Aiv, Representative raw retina images and quantification of vasomotor response during a brief focal stimulation with a patch pipette (10 μA, 2 ms, arrow) under indicated experimental conditions. In transmitted images, red dotted lines indicate the inner border of vascular capillaries. After physiological assessment, immunolabeled blood vessel-associated Cx43-positive puncta (green) are superimposed over original fluorescent live images of NG2-DsRed labeled pericytes (magenta, bottom). B, Summary histogram of vasomotor responses under various experimental conditions. Data are mean ± SEM. Statistical significance is based on repeated-measures ANOVA. N = 7 mice in each group with 2 or 3 samples per animal. **p < 0.01.
Disrupted integrity of connexin43-containing gap junctions and reduced pericyte coverage contribute to vasomotor deficit in diabetes
Having established that vasomotor signal propagation, but not its generation, relied on gap junctions and that in diabetes the vasomotor response was disrupted at both the site of stimulation and distant regions, we next hypothesized that gap junctions and pericyte coverage were diminished in diabetes. First, if impaired propagation of vasomotor response in diabetes was due to diminished gap junction-mediated pericyte-to-pericyte interactions, application of gap junction blocker MFA in diabetic retina will have little or no effect on vasomotor response. To test this, a stimulus (30 μA, 2 ms) was drawn from established IR curves (Fig. 4B) to produce a potent yet recoverable vasomotor response at a site of stimulation in diabetic retina. We found that application of MFA (25 μm) had a small, but still significant, effect on the amplitude of vasomotor response in the proximal ROIs (Fig. 7Aii,B; 0.13 ± 0.03 vs 0.07 ± 0.02 vs 0.11 ± 0.03, control, MFA, and recovery, respectively; N = 6 mice, p = 0.01, repeated-measures ANOVA). However, it did not affect activity at the distal ROIs (Fig. 7Aiii,B; 0.05 ± 0.02 vs 0.03 ± 0.02 vs 0.03 ± 0.02, control, MFA, and recovery, respectively; N = 6 mice, p = 0.38, repeated-measures ANOVA). This is in contrast to the above-mentioned effect of a gap junction blocker in nondiabetic retina, where application of MFA reduced response amplitude at both the proximal and distal ROIs, suggesting that impaired gap junction signaling contributed to diminished propagation of vasomotor response in diabetes.
Figure 7.

Gap junction-mediated vasomotor response propagation is reduced in diabetes. A, Superimposed transmitted and fluorescent light images of retinal whole mount in diabetic NG2-DsRed mice. Scale bar, 50 μm. Ai–Aiii, Representative raw retina images and quantification of vasomotor response during a brief focal stimulation (30 μA, 2 ms, arrow) under indicated experimental conditions. After physiological assessment, immunolabeled blood vessel-associated Cx43-positive puncta (green) are superimposed over original fluorescent live images of NG2-DsRed labeled pericytes (magenta, bottom). B, Summary histogram of vasomotor responses in diabetic retina under various experimental conditions. Data are plotted as mean ± SEM. Statistical significance is based on repeated-measures ANOVA. **p < 0.01. Data collected from n = 6 mice in each group with 3–5 samples per animal.
Next, we determined the relationship between vasomotor response propagation and gap-junction expression. Several types of connexins, including Cx37, Cx40, Cx43, and Cx45, were identified in vascular cells. Here, we focused on expression of Cx43, a major connexin in vascular gap junctions in the CNS and other tissues (Figueroa and Duling, 2009). We assessed vasomotor function in both nondiabetic and diabetic whole-mount retinas (Fig. 8A–F). At the same vascular sites, we then examined capillaries for Cx43 expression, along with pericyte density (Figs. 8, 9). Isolectin stain was used to visualize the vasculature as a whole. Polyclonal antibody against Cx43 revealed the structural elements between adjacent pericytes and/or endothelial cells and astrocytes. The appearance of Cx43-positive structures was diverse and depended on the cell type. Astrocytes possessed large puncta decorating their processes and placed slightly above the vascular plane (Fig. 8H,I, arrowheads); these puncta coincided with the labeling for GFAP, a marker for astroglia (data not shown). In contrast, the puncta closely associated with the blood vessels were smaller and could belong to both pericyte-to-pericyte and pericyte-to-endothelial cell junctions (Fig. 7G, open arrows). Finally, the elongated thread-looking structures, especially evident on the capillaries adjacent to arterioles, were strictly colocalized with claudin5 (Fig. 8G), a component of the blood–brain barrier and tight junctions between endothelial cells (Taddei et al., 2008) (Figure 7G–I, solid arrows). In the current analysis, we combined all capillary associated Cx43-positive structures in a projection from a few confocal sections along capillaries. In diabetic animals, the density of Cx43-positive gap junctions was significantly reduced (2.2 ± 0.2 vs 0.5 ± 0.1 μm2/μm in nondiabetic vs diabetic, respectively, p < 0.0001, N = 5 mice with 2 or 3 ROIs per mice in each group). The average size of the Cx43-positive puncta was also significantly reduced in diabetes (1.5 ± 0.2 vs 0.6 ± 0.1 μm2 in nondiabetic vs diabetic, respectively, p < 0.00003, N = 5 mice with 2 or 3 sites per mice in each group), suggesting that the large interendothelial and large astrocytic gap junctions were preferentially affected (Fig. 8L,M). Thus, the anatomical data support our physiological observation that gap junction-mediated communication within the vascular network is impaired in diabetes.
Figure 8.

Impaired propagation of vasomotor response is linked to reduced Cx43 gap junction expression in diabetes. A–D, Illustration of the experimental approach aimed to compare vasomotor activity with underlying structural elements in the same capillary network. Micrographs show placement of electrode (arrow) on capillary pericytes and vasomotor response following focal stimulation (2 ms, 30 μA, bottom panels for both nondiabetic and diabetic retinas). C, D, Red lines indicate extent of vasomotor response spread from originating pericyte. E, F, Intensity-response relationships for both nondiabetic and diabetic retina samples. G, Localization of pericytes (NG2), Cx43, and tight junction elements (Claudin5) in retinal capillaries. H, I, Cx43 gap junctions (magenta) are shown to be associated with blood vessels. Elongated structural elements (arrows) are visible extending along capillaries. J, K, The same specimen was labeled with isolectin (green) to visualize capillaries and to identify the stimulated pericyte (*). L, M, Mask shows thresholding of images from H and I for evaluation of Cx43-positive structures. N, The density of Cx43 puncta is greater in wild-type retina. O, The size of Cx43 puncta is greater in wild-type retina. Data are mean ± SEM. Statistical significance is based on t test. N = 5 mice in each group. Scale bars, 25 μm. ***p < 0.001.
Figure 9.

Reduced pericyte density in diabetic retina. A–D, Pericytes (arrowheads indicate soma) labeled with anti-NG2 (magenta) are located on capillaries, labeled with isolectin (green). Fewer pericytes are present on diabetic capillaries relative to wild-type. E, F, Mask shows thresholding of images from A and B for evaluation of NG2-positive structures. G, The number of pericytes per capillary length is reduced in diabetic retina. H, The surface area of pericyte processes is also reduced in diabetic retina. I, J, Data are mean ± SEM. Statistical significance is based on t test. N = 5 mice in each group. Scale bar, 50 μm. **p < 0.01, ***p < 0.001.
Next, we assessed pericyte density and extent of the pericyte coverage of the capillaries. Pericytes were labeled against NG2, and the associated vasculature was stained with isolectin (Fig. 9A–D). We found that pericyte density decreased significantly in diabetic retina (16.1 ± 0.3 per mm vs 13.2 ± 0.3 per mm in nondiabetic vs diabetic, respectively, p < 0.0001, N = 6 mice with 2 ROIs per mice in each group; Fig. 9I). The distribution of pericytes along the capillaries was even in nondiabetic animals, suggesting a linear mosaic in their distribution, with the average intersoma distance of ∼60 μm (Fig. 9G). In diabetic animals, in addition to ∼60 μm peak in the frequency histogram, additional peaks at ∼80 and 120 μm are visible. The cumulative probability curves also reflect a longer distance between pericytes in diabetes (Fig. 9H). Despite the increased intersomatic distances in diabetes, all capillaries were covered by the processes of the pericytes without any pericyte-abandoned areas (Fig. 9E,F). However, the fine processes encircling the capillaries were sparse, and their density was reduced in diabetic animals (292 ± 14 μm2/pericyte vs 233 ± 14 μm2/pericyte in nondiabetic vs diabetic, respectively, p = 0.008, N = 5 or 6 mice with 2 ROIs per mice in each group; Fig. 9E,F). In conclusion, the loss of pericytes and appearance of elongated and thinner pericyte branches in diabetes may contribute to their weakening contractile ability and signaling to the neighboring cells.
Discussion
Impaired functional hyperemia is the key event at the onset and progression of numerous diseases. Here, we found that, at stages of diabetic retinopathy that precede manifest vascular pathology, pericytes and their vascular network signaling exhibit functional and structural deficiencies. We show that, at the local level, vasomotor responses are diminished due to reduced pericyte sensitivity and narrow dynamic range and their structural decline. We provide direct physiological evidence for gap junction-mediated signaling and its role in propagation of vasomotor activity. These data establish mechanisms for both fine local regulation of vascular diameter by pericytes and its effect along the vascular network. Finally, we show how disruption to this regulation may contribute to vascular control impairment in diabetes. Below, we discuss the functional implications of our findings and potential treatment strategies.
Pericyte as a functional unit in vascular network
Controversy exists regarding the role of pericytes in capillary diameter regulation in the CNS and somatic tissue. Here, in probing vasomotor activity and its propagation, we revealed distinct patterns of pericyte activation across a defined retinal vascular network (Fig. 3). Our comprehensive approach of quantifying vasomotor activity across a wider network led to the observation of physiological heterogeneity in vasomotor response following focal stimulation, providing evidence for distinct types of pericytes and/or vascular network interactions. This is important because functional hyperemia occurs at spatially restricted regions in response to changes in local neuronal activity. The description of distinct patterns of pericyte activation is significant and, while the anatomical basis is yet to be determined, may explain disparity in observations on the function of pericytes in vascular diameter regulation. Here, we aimed at vascular regions that appeared anatomically similar and were located at comparable branching points within the vascular tree. Therefore, our data extend an emerging view that not all pericytes are equal (Attwell et al., 2016), further suggesting the existence of not only anatomically but also functionally distinct subtypes. In addition to numerous signaling factors, we now demonstrate that, in intact retina, gap junctions play a key role in pericyte-mediated vascular network communications. Specifically, either pharmacological blockade of gap junctions in nondiabetic tissue, or their pathological decline in diabetic tissue, led to loss of vasomotor response propagation.
Whereas our approach enabled fine spatial control and precision in probing vasomotor activity, the present study was limited to contractile response to depolarizing electrical stimulation. The magnitude of vasomotor response has been shown to reflect pericyte general health. Indeed, pericytes have been shown to constrict and dilate capillaries (Peppiatt et al., 2006), and both of these functions were disrupted under pathological conditions (Hall et al., 2014). Identification of distinct modes of pericyte interactions suggests that local and global signaling as well as the cell types that may be involved may differ across capillary network. It will be important for future studies to combine bidirectional vasomotor response assessment with identification of vascular cells to further the insight into fundamental principles of vascular control and its contribution to pathophysiology.
Mechanisms of vasomotor control and its decline in diabetes
Despite accumulating evidence revealing the incidence of vascular leakage and neovascularization (Gardner et al., 2009), inflammatory processes (Hotamisligil, 2006) as well as neuronal and glial dysfunction in diabetes (Gastinger et al., 2001, 2006, 2008; Wang et al., 2010), the early events contributing to disrupted capillary blood flow at the onset of disease are less known. In particular, whether there is a direct effect on pericytes, as well as their homeostatic interactions with other retinal cells, remains unclear (Geraldes et al., 2009). The structural and functional decline in pericytes and reduction in Cx43 expression in pericytes may provide a clue. Earlier studies have found that patients with diabetic retinopathy exhibit decreased blood flow at early stages of the disease (Patel et al., 1992; Pemp and Schmetterer, 2008). This suggests that pericytes may already be functionally compromised at the early stages of the disease. Indeed, our data support this. Vasomotor responses were significantly reduced in diabetic retina. This cannot simply be attributed to a reduction in the number of pericytes; indeed, they are by no means absent, with only an ∼15% decline in number (Fig. 8). Importantly, when directly stimulating pericytes, diabetic capillaries required a significantly greater electrical current to elicit a vasomotor response. Loss of pericyte function may thus be central to alterations in functional hyperemia in diabetic retinopathy. The retina has the highest metabolic demand per volume in the human body (Yu and Cringle, 2001), and capillaries serve the majority of retinal cells (Kornfield and Newman, 2014). Pericytes, which play both a structural and functional role in capillaries, also appear to be essential for maintaining retinal–blood barrier (Bergers and Song, 2005). Declining pericyte function could compound the effects of altered blood flow and increased blood–retinal barrier permeability. Vascular leakage may necessitate increased blood flow to maintain local blood pressure, and not meeting this metabolic need could result in damage to surrounding cells, further damaging the blood–retinal barrier in a vicious circle. There is a controversy, stemming, in our opinion, from a limited understanding of functional hyperemia, on precise contribution of arterial and capillary mechanisms to vasomotor activity. On one hand, there is evidence that 84% of vasomotor control takes place within the vast capillary network (Hall et al., 2014). On the other hand, recent studies in the retina argued that upon sensory stimulation the biggest changes in blood flow are observed in arterioles, where smooth muscle cells change the diameter of the vascular lumen (Kornfield and Newman 2014; Hill, et al., 2015). What is more intriguing is the fact that retinal arterioles, due to their location outside of any synaptic inputs, must receive their vasoactive inputs from the capillary network. In the retina, only capillaries are positioned within synaptic layers where they are exposed to vasoactive signals released by neurons. Therefore, signal propagation along the vascular network, in part via Cx43-containing gap junctions, may contribute significantly to blood flow control in arterioles. Significant decline in vasomotor response propagation and reduction in Cx43 expression in affected regions begin to address the mechanisms of impaired functional hyperemia in diabetes. The precise contribution of these interactions remains to be elucidated in the future studies, which will reveal the nature of signaling between pericytes and endothelial cells and whether these connections are homotypic or engage a diverse class of cells.
Functional significance and potential target for early intervention
It could be argued that broad approaches to retinal cell health might be sufficient due to the wide range of cells affected by diabetic retinopathy. In particular, boosting mitochondrial function (Ding et al., 2014) and activating the Notch pathway (Arboleda-Velasquez et al., 2014) have had some success. However, an early incidence of pericyte dysfunction suggests that an intervention aimed at pericytes could be more prudent. Strategies for promoting pericyte survival have not been fully explored. Targeting PKC to affect PDGF has been shown to promote pericyte survival in diabetes (Geraldes et al., 2009). The loss of Cx43 may be linked to the functional decline of pericytes, which in turn has a number of consequences for retinal vasculature, intercellular communication, and other homeostatic functions that ultimately support vascular stability (von Tell et al., 2006). Consistent with our observations in intact mouse retina, high glucose reduced Cx43 expression in Western blot analysis of human and bovine retinal pericyte cultures, and the connectivity of the vascular cells was compromised (Li et al., 2003). It was also shown that downregulation of Cx43 promoted vascular cell loss and excess permeability (Tien et al., 2014). In addition to a reported decline in cytoskeletal proteins expression (Durham et al., 2015), these changes could lead to impaired vasoactive function of pericytes. Thus, protecting pericytes at the early stages of the disease could mitigate later complications. Of particular interest are observations in heart tissue showing increased phosphorylation of Cx43 and the closure of gap junctions leading to loss of network interactions in hyperglycemia (Lin et al., 2006; Solan and Lampe, 2014). The finding of reduced dye tracing in diabetic retina (Oku et al., 2001) suggests a similar course of events in early diabetes preceding physical Cx43 decline. Therefore, selective modification of the gap junction phosphorylation state may also prove a useful target in counteracting the progression of diabetes. In addition to involvement in vasomotor control, Cx43 can be essential for the maintenance of the blood barrier (Li et al., 2010). In the cultured brain endothelial cells, Cx43 was colocalized and coprecipitated with tight junctions (Nagasawa et al., 2006). Gap-junction inhibitors suppressed the barrier function, and deletion of astroglial Cx43 in mouse cortex resulted in impaired blood–brain barrier (Ezan et al., 2012). Our data show tight colocalization between Cx43 and a tight junction protein claudin5 in endothelial cells (Fig. 8G), suggesting a role for Cx43 in the blood–brain barrier. Whether disruption of Cx43 affects blood–retinal barrier in diabetic retinopathy needs further investigation.
Footnotes
This work was supported by National Institutes of Health Grant R01-EY026576 to B.T.S. We thank Drs. Rajiv Ratan and Peter Lukasiewicz for comments on the manuscript.
The authors declare no competing financial interests.
References
- Aarts E, Verhage M, Veenvliet JV, Dolan CV, van der Sluis S (2014) A solution to dependency: using multilevel analysis to accommodate nested data. Nat Neurosci 17:491–496. 10.1038/nn.3648 [DOI] [PubMed] [Google Scholar]
- Antonetti DA, Klein R, Gardner TW (2012) Diabetic retinopathy. N Engl J Med 366:1227–1239. 10.1056/NEJMra1005073 [DOI] [PubMed] [Google Scholar]
- Arboleda-Velasquez JF, Primo V, Graham M, James A, Manent J, D'Amore PA (2014) Notch signaling functions in retinal pericyte survival. Invest Ophthalmol Vis Sci 55:5191–5199. 10.1167/iovs.14-14046 [DOI] [PMC free article] [PubMed] [Google Scholar]
- Attwell D, Buchan AM, Charpak S, Lauritzen M, Macvicar BA, Newman EA (2010) Glial and neuronal control of brain blood flow. Nature 468:232–243. 10.1038/nature09613 [DOI] [PMC free article] [PubMed] [Google Scholar]
- Attwell D, Mishra A, Hall CN, O'Farrell FM, Dalkara T (2016) What is a pericyte? J Cereb Blood Flow Metab 36:451–455. 10.1177/0271678X15610340 [DOI] [PMC free article] [PubMed] [Google Scholar]
- Barrett JM, Degenaar P, Sernagor E (2015) Blockade of pathological retinal ganglion cell hyperactivity improves optogenetically evoked light responses in rd1 mice. Front Cell Neurosci 9:330. 10.3389/fncel.2015.00330 [DOI] [PMC free article] [PubMed] [Google Scholar]
- Bergers G, Song S (2005) The role of pericytes in blood-vessel formation and maintenance. Neuro Oncol 7:452–464. 10.1215/S1152851705000232 [DOI] [PMC free article] [PubMed] [Google Scholar]
- Connor KM, Krah NM, Dennison RJ, Aderman CM, Chen J, Guerin KI, Sapieha P, Stahl A, Willett KL, Smith LE (2009) Quantification of oxygen-induced retinopathy in the mouse: a model of vessel loss, vessel regrowth and pathological angiogenesis. Nat Protoc 4:1565–1573. 10.1038/nprot.2009.187 [DOI] [PMC free article] [PubMed] [Google Scholar]
- Danesh-Meyer HV, Kerr NM, Zhang J, Eady EK, O'Carroll SJ, Nicholson LF, Johnson CS, Green CR (2012) Connexin43 mimetic peptide reduces vascular leak and retinal ganglion cell death following retinal ischaemia. Brain 135:506–520. 10.1093/brain/awr338 [DOI] [PubMed] [Google Scholar]
- Ding L, Cheng R, Hu Y, Takahashi Y, Jenkins AJ, Keech AC, Humphries KM, Gu X, Elliott MH, Xia X, Ma JX (2014) Peroxisome proliferator-activated receptor alpha protects capillary pericytes in the retina. Am J Pathol 184:2709–2720. 10.1016/j.ajpath.2014.06.021 [DOI] [PMC free article] [PubMed] [Google Scholar]
- Durham JT, Dulmovits BM, Cronk SM, Sheets AR, Herman IM (2015) Pericyte chemomechanics and the angiogenic switch: insights into the pathogenesis of proliferative diabetic retinopathy? Invest Ophthalmol Vis Sci 56:3441–3459. 10.1167/iovs.14-13945 [DOI] [PMC free article] [PubMed] [Google Scholar]
- Ezan P, André P, Cisternino S, Saubaméa B, Boulay AC, Doutremer S, Thomas MA, Quenech'du N, Giaume C, Cohen-Salmon M (2012) Deletion of astroglial connexins weakens the blood–brain barrier. J Cereb Blood Flow Metab 32:1457–1467. 10.1038/jcbfm.2012.45 [DOI] [PMC free article] [PubMed] [Google Scholar]
- Feit-Leichman RA, Kinouchi R, Takeda M, Fan Z, Mohr S, Kern TS, Chen DF (2005) Vascular damage in a mouse model of diabetic retinopathy: relation to neuronal and glial changes. Invest Ophthalmol Vis Sci 46:4281–4287. 10.1167/iovs.04-1361 [DOI] [PubMed] [Google Scholar]
- Figueroa XF, Duling BR (2009) Gap junctions in the control of vascular function. Antioxid Redox Signal 11:251–266. 10.1089/ars.2008.2117 [DOI] [PMC free article] [PubMed] [Google Scholar]
- Gardner TW, Larsen M, Girach A, Zhi X (2009) Diabetic macular oedema and visual loss: relationship to location, severity and duration. Acta Ophthalmol 87:709–713. 10.1111/j.1755-3768.2009.01545.x [DOI] [PubMed] [Google Scholar]
- Gastinger MJ, Singh RS, Barber AJ (2006) Loss of cholinergic and dopaminergic amacrine cells in streptozotocin-diabetic rat and Ins2Akita-diabetic mouse retinas. Invest Ophthalmol Vis Sci 47:3143–3150. 10.1167/iovs.05-1376 [DOI] [PubMed] [Google Scholar]
- Gastinger MJ, Barber AJ, Khin SA, McRill CS, Gardner TW, Marshak DW (2001) Abnormal centrifugal axons in streptozotocin-diabetic rat retinas. Invest Ophthalmol Vis Sci 42:2679–2685. [PMC free article] [PubMed] [Google Scholar]
- Gastinger MJ, Kunselman AR, Conboy EE, Bronson SK, Barber AJ (2008) Dendrite remodeling and other abnormalities in the retinal ganglion cells of Ins2 Akita diabetic mice. Invest Ophthalmol Vis Sci 49:2635–2642. 10.1167/iovs.07-0683 [DOI] [PubMed] [Google Scholar]
- Geraldes P, Hiraoka-Yamamoto J, Matsumoto M, Clermont A, Leitges M, Marette A, Aiello LP, Kern TS, King GL (2009) Activation of PKC-delta and SHP-1 by hyperglycemia causes vascular cell apoptosis and diabetic retinopathy. Nat Med 15:1298–1306. 10.1038/nm.2052 [DOI] [PMC free article] [PubMed] [Google Scholar]
- Hall CN, Reynell C, Gesslein B, Hamilton NB, Mishra A, Sutherland BA, O'Farrell FM, Buchan AM, Lauritzen M, Attwell D (2014) Capillary pericytes regulate cerebral blood flow in health and disease. Nature 508:55–60. 10.1038/nature13165 [DOI] [PMC free article] [PubMed] [Google Scholar]
- Hill RA, Tong L, Yuan P, Murikinati S, Gupta S, Grutzendler J (2015) Regional blood flow in the normal and ischemic brain is controlled by arteriolar smooth muscle cell contractility and not by capillary pericytes. Neuron 87:95–110. 10.1016/j.neuron.2015.06.001 [DOI] [PMC free article] [PubMed] [Google Scholar]
- Hotamisligil GS. (2006) Inflammation and metabolic disorders. Nature 444:860–867. 10.1038/nature05485 [DOI] [PubMed] [Google Scholar]
- Kawamura H, Sugiyama T, Wu DM, Kobayashi M, Yamanishi S, Katsumura K, Puro DG (2003) ATP: a vasoactive signal in the pericyte-containing microvasculature of the rat retina. J Physiol 551:787–799. 10.1113/jphysiol.2003.047977 [DOI] [PMC free article] [PubMed] [Google Scholar]
- Kempen JH, O'Colmain BJ, Leske MC, Haffner SM, Klein R, Moss SE, Taylor HR, Hamman RF (2004) The prevalence of diabetic retinopathy among adults in the United States. Arch Ophthalmol 122:552–563. 10.1001/archopht.122.4.552 [DOI] [PubMed] [Google Scholar]
- Kerr NM, Johnson CS, de Souza CF, Chee KS, Good WR, Green CR, Danesh-Meyer HV (2010) Immunolocalization of gap junction protein connexin43 (GJA1) in the human retina and optic nerve. Invest Ophthalmol Vis Sci 51:4028–4034. 10.1167/iovs.09-4847 [DOI] [PubMed] [Google Scholar]
- Kornfield TE, Newman EA (2014) Regulation of blood flow in the retinal trilaminar vascular network. J Neurosci 34:11504–11513. 10.1523/JNEUROSCI.1971-14.2014 [DOI] [PMC free article] [PubMed] [Google Scholar]
- Li AF, Sato T, Haimovici R, Okamoto T, Roy S (2003) High glucose alters connexin 43 expression and gap junction intercellular communication activity in retinal pericytes. Invest Ophthalmol Vis Sci 44:5376–5382. 10.1167/iovs.03-0360 [DOI] [PubMed] [Google Scholar]
- Li MW, Mruk DD, Lee WM, Cheng CY (2010) Connexin 43 is critical to maintain the homeostasis of the blood testis barrier via its effects on tight junction reassembly. Proc Natl Acad Sci U S A 107:17998–18003. 10.1073/pnas.1007047107 [DOI] [PMC free article] [PubMed] [Google Scholar]
- Lin H, Ogawa K, Imanaga I, Tribulova N (2006) Alterations of connexin 43 in the diabetic rat heart. Adv Cardiol 42:243–254. 10.1159/000092573 [DOI] [PubMed] [Google Scholar]
- Lindauer U, Leithner C, Kaasch H, Rohrer B, Foddis M, Füchtemeier M, Offenhauser N, Steinbrink J, Royl G, Kohl-Bareis M, Dirnagl U (2010) Neurovascular coupling in rat brain operates independent of hemoglobin deoxygenation. J Cereb Blood Flow Metab 30:757–768. 10.1038/jcbfm.2009.259 [DOI] [PMC free article] [PubMed] [Google Scholar]
- Muir ER, Rentería RC, Duong TQ (2012) Reduced ocular blood flow as an early indicator of diabetic retinopathy in a mouse model of diabetes. Invest Ophthalmol Vis Sci 53:6488–6494. 10.1167/iovs.12-9758 [DOI] [PMC free article] [PubMed] [Google Scholar]
- Nagasawa K, Chiba H, Fujita H, Kojima T, Saito T, Endo T, Sawada N (2006) Possible involvement of gap junctions in the barrier function of tight junctions of brain and lung endothelial cells. J Cell Physiol 208:123–132. 10.1002/jcp.20647 [DOI] [PubMed] [Google Scholar]
- Newman EA. (2013) Functional hyperemia and mechanisms of neurovascular coupling in the retinal vasculature. J Cereb Blood Flow Metab 33:1685–1695. 10.1038/jcbfm.2013.145 [DOI] [PMC free article] [PubMed] [Google Scholar]
- Oku H, Kodama T, Sakagami K, Puro DG (2001) Diabetes-induced disruption of gap junction pathways within the retinal microvasculature. Invest Ophthalmol Vis Sci 42:1915–1920. [PubMed] [Google Scholar]
- Patel V, Rassam S, Newsom R, Wiek J, Kohner E (1992) Retinal blood flow in diabetic retinopathy. BMJ 305:678–683. 10.1136/bmj.305.6855.678 [DOI] [PMC free article] [PubMed] [Google Scholar]
- Pemp B, Schmetterer L (2008) Ocular blood flow in diabetes and age-related macular degeneration. Can J Ophthalmol 43:295–301. 10.3129/i08-049 [DOI] [PubMed] [Google Scholar]
- Peppiatt CM, Howarth C, Mobbs P, Attwell D (2006) Bidirectional control of CNS capillary diameter by pericytes. Nature 443:700–704. 10.1038/nature05193 [DOI] [PMC free article] [PubMed] [Google Scholar]
- Pournaras CJ, Rungger-Brändle E, Riva CE, Hardarson SH, Stefansson E (2008) Regulation of retinal blood flow in health and disease. Prog Retin Eye Res 27:284–330. 10.1016/j.preteyeres.2008.02.002 [DOI] [PubMed] [Google Scholar]
- Roy CS, Sherrington CS (1890) On the regulation of the blood-supply of the brain. J Physiol 11:117. [DOI] [PMC free article] [PubMed] [Google Scholar]
- Sampath AP, Rieke F (2004) Selective transmission of single photon responses by saturation at the rod-to-rod bipolar synapse. Neuron 41:431–443. 10.1016/S0896-6273(04)00005-4 [DOI] [PubMed] [Google Scholar]
- Solan JL, Lampe PD (2014) Specific Cx43 phosphorylation events regulate gap junction turnover in vivo. FEBS Lett 588:1423–1429. 10.1016/j.febslet.2014.01.049 [DOI] [PMC free article] [PubMed] [Google Scholar]
- Taddei A, Giampietro C, Conti A, Orsenigo F, Breviario F, Pirazzoli V, Potente M, Daly C, Dimmeler S, Dejana E (2008) Endothelial adherens junctions control tight junctions by VE-cadherin-mediated upregulation of claudin-5. Nat Cell Biol 10:923–934. 10.1038/ncb1752 [DOI] [PubMed] [Google Scholar]
- Thibos LN, Werblin FS (1978) The response properties of the steady antagonistic surround in the mudpuppy retina. J Physiol 278:79–99. 10.1113/jphysiol.1978.sp012294 [DOI] [PMC free article] [PubMed] [Google Scholar]
- Tien T, Muto T, Barrette K, Challyandra L, Roy S (2014) Downregulation of Connexin 43 promotes vascular cell loss and excess permeability associated with the development of vascular lesions in the diabetic retina. Mol Vis 20:732–741. [PMC free article] [PubMed] [Google Scholar]
- Toychiev AH, Ivanova E, Yee CW, Sagdullaev BT (2013) Block of gap junctions eliminates aberrant activity and restores light responses during retinal degeneration. J Neurosci 33:13972–13977. 10.1523/JNEUROSCI.2399-13.2013 [DOI] [PMC free article] [PubMed] [Google Scholar]
- Toychiev AH, Sagdullaev B, Yee CW, Ivanova E, Sagdullaev BT (2013) A time and cost efficient approach to functional and structural assessment of living neuronal tissue. J Neurosci Methods 214:105–112. 10.1016/j.jneumeth.2013.01.016 [DOI] [PMC free article] [PubMed] [Google Scholar]
- von Tell D, Armulik A, Betsholtz C (2006) Pericytes and vascular stability. Exp Cell Res 312:623–629. 10.1016/j.yexcr.2005.10.019 [DOI] [PubMed] [Google Scholar]
- Wang J, Xu X, Elliott MH, Zhu M, Le YZ (2010) Muller cell-derived VEGF is essential for diabetes-induced retinal inflammation and vascular leakage. Diabetes 59:2297–2305. 10.2337/db09-1420 [DOI] [PMC free article] [PubMed] [Google Scholar]
- Yu DY, Cringle SJ (2001) Oxygen distribution and consumption within the retina in vascularised and avascular retinas and in animal models of retinal disease. Prog Retin Eye Res 20:175–208. 10.1016/S1350-9462(00)00027-6 [DOI] [PubMed] [Google Scholar]
Associated Data
This section collects any data citations, data availability statements, or supplementary materials included in this article.
Supplementary Materials
Contractile vasomotor response to pericyte stimulation in nondiabetic retina. Capillary response to electrical stimulation (zap) of identified pericyte with a patch electrode. Stimulus (30 μA, 2 ms) is delivered at the beginning of the recording. Movie shows both contractile response and recovery phase at 10× original speed. For quantification of the response and its profile, see Figure 2.
Contractile vasomotor response to pericyte stimulation in diabetic retina. Capillary response to electrical stimulation (zap) of identified pericyte with a patch electrode. Stimulus (30 μA, 2 ms) is delivered at the beginning of the recording. Movie shows both contractile response and the beginning of recovery phase at 10× original speed. At this example, full recovery took 7 min and was truncated for space limitations. For quantification of the response and its profile, see Figure 2.