Abstract
Extracellular vesicles (EVs), including exosomes, are circulating nanoscale particles heavily implicated in cell signaling and can be isolated in vast numbers from human biofluids. Study of their molecular profiling and materials properties is currently underway for purposes of describing a variety of biological functions and diseases. However, the large, and as yet largely unquantified, variety of EV subpopulations differing in composition, size, and likely function necessitates characterization schemes capable of measuring single vesicles. Here we describe the first application of multispectral optical tweezers (MS-OTs) to single vesicles for molecular fingerprinting of EV subpopulations. This versatile imaging platform allows for sensitive measurement of Raman chemical composition (e.g., variation in protein, lipid, cholesterol, nucleic acids), coupled with discrimination by fluorescence markers. For exosomes isolated by ultracentrifugation, we use MS-OTs to interrogate the CD9- positive subpopulations via antibody fluorescence labeling and Raman spectra measurement. We report that the CD9-positive exosome subset exhibits reduced component concentration per vesicle and reduced chemical heterogeneity compared to the total purified EV population. We observed that specific vesicle subpopulations are present across exosomes isolated from cell culture supernatant of several clonal varieties of mesenchymal stromal cells and also from plasma and ascites isolated from human ovarian cancer patients.
Graphical Abstract
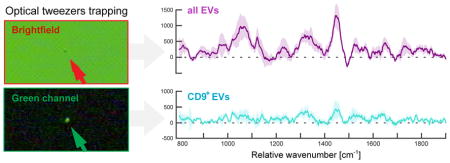
Exosomes, or more broadly extracellular vesicles (EVs), are nanosized, lipid bilayer-wrapped packages that dynamically shuttle biomolecules (e.g., proteins, lipids, metabolites, noncoding RNAs, and other components) between all cells measured to date.1,2 This impressive communication system has been under intense investigation during the past few years due primarily to (i) the understanding of its central role in both healthy and pathologic function, particularly cancer,3,4 and (ii) recent advances in nanoscale characterization platforms.5 Yet most of these methods provide insights into the system by extrapolating from population averages rather than individual particles.5 Several researchers have proposed that cells may release more than a single type of exosome,6–11 but the lack of single-exosome characterization techniques has prevented this idea from being definitively answered. Here we compare the chemical content of individual exosomes isolated from either in vitro mesenchymal stromal cell (MSC) culture supernatant or in vivo plasma and ascites collected from human ovarian cancer patients, via trapping in solution with a laser beam and performing vibrational spectroscopy. The full description of this technique, known as laser trapping Raman spectroscopy (LTRS), can be found in a previous study, including an indepth discussion of vibrational spectroscopy applied to exosomes to date.12
By incorporating a fluorescence imaging system in-line with an LTRS system, here we describe the expansion of that technique to form multispectral optical tweezers (MS-OTs), which enable simultaneous fluorescence and Raman spectra measurement of optically trapped objects. MS-OTs have been previously reported, either combining Raman spectroscopy with fluorescence13 or phase contrast microscopy,14,15 to characterize single whole cells. By adapting MS-OTs to characterize single exosomes, we report the distinctive spectral fingerprint of exosomes binding fluorescently labeled antibodies against CD9, a tetraspanin membrane protein marker proposed to indicate the presence of exosome-type EVs.
The objective of this study is to utilize MS-OTs for measuring the composition and relative amounts of biomolecules present in CD9-positive (CD9+) exosomes, in order to demonstrate the presence of a distinct compositional subpopulation shared among cell types.
It is difficult to apply the term “exosome” at the single-vesicle level, given that its precise definition requires several complementary bulk characterization methods such as Western blot protein analysis and electron microscopy imaging.18 Therefore, we refer to the vesicles trapped in this study more generally as EVs. However, we expect the observations reported here, along with complementary studies that identify exosome subpopulations, to contribute to an improved definition for use in future studies.
RESULTS AND DISCUSSION
With a single 785 nm laser focused by a 1.2NA (numerical aperture) objective, EVs with sizes between roughly 50 and 200 nm can be simultaneously optically trapped and have their Raman spectra measured. Figure 1 illustrates the optical path of our home-built MS-OTs, composed of an LTRS system,12 a light source for fluorescence excitation (mercury lamp), and an appropriate fluorescence filter cube. A video camera is used either to detect brightfield scattering or fluorescence of particles in the field of view, enabling selective trapping of those labeled by fluorescent probe.
Figure 1.
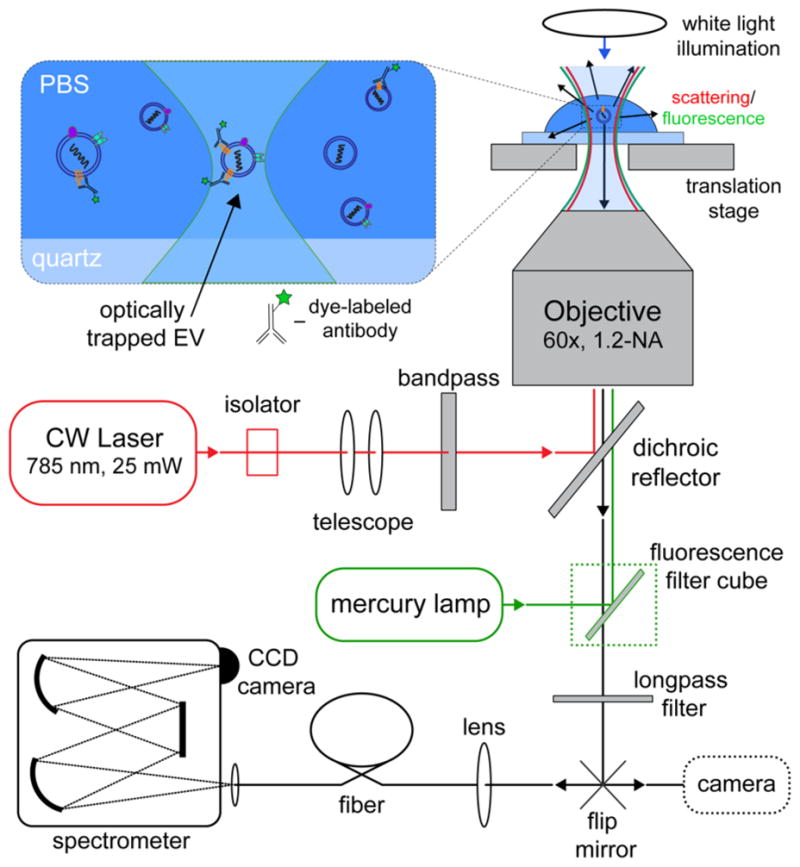
Schematic of the multispectral optical tweezers (MS-OTs) experimental setup. Laser light is coupled into a water immersion objective lens. The backscattered signal originating from the trapped vesicle is detected with a spectrometer in a confocal configuration. The use of a mercury lamp, a fluorescence filter cube, and a video-camera port switch in the optical path allows for the simultaneous observation of fluorescence images and measurement of Raman spectra.
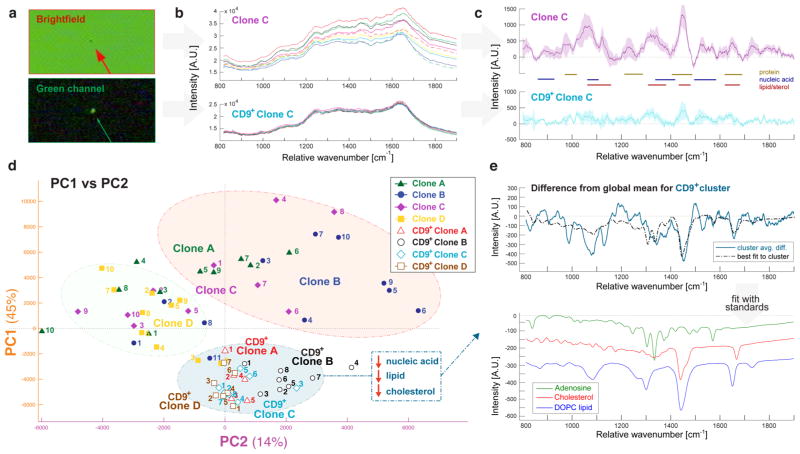
First, we isolated EVs from cultured MSC cells. Four rat MSC clones, referred to here as clones A through D, were generated as previously described (more detail can be found in the Experimental Methods section).19 After 48 h of cell culture, the supernatant was removed from each of the four MSC clones and subjected to ultracentrifugation methodology (full description in the Experimental Methods section). EVs purified from the four clones were each split into two groups, generating a total of eight experimental conditions. For each clone, one group of EVs was diluted on a quartz slide and at least 10 vesicles trapped in the optical tweezers in the brightfield (Figure 2a, top) for Raman spectra measurement (five 1 min scans per vesicle). A second group was labeled with FITC-conjugated anti-CD9 antibody via overnight incubation. Unbound antibody was removed by an additional round of ultracentrifugation. To examine the effect of this additional round of ultracentrifugation and/or antibody labeling in general, we remeasured the size distribution of EVs after antibody labeling, and also of control EVs without antibody labeling but subjected to the additional round of ultracentrifugation (Supporting Figure 2). We found no indication of aggregation or other major discrepancy in size distribution. The fluorescence of exosome-associated anti-CD9-FITC was used to locate vesicles for trapping and Raman spectral acquisition performed with the 785 nm optical tweezers (Figure 2a, bottom). Thus, dye-labeled vesicles were considered to be CD9-positive (CD9+).
Figure 2.
Analysis of Raman spectra from single exosomes derived from in vitro cell culture supernatant for four clonal lines of mesenchymal stem cells (MSCs). (a) For each of the four clones, purified exosomes were either trapped in the brightfield or prelabeled with anti-CD9-FITC antibody and trapped in the green channel. (b) Raw Raman spectra for single exosomes in sample clone C. CD9+ vesicles exhibited less spectral variance between exosomes. (c) Average Raman spectra (solid lines) and standard deviation (shaded areas) of corresponding clone C exosomes following background correction and smoothing. Gold, blue, and red lines are drawn to guide the eye to the wavenumber regions associated with protein, nucleic acid, and lipid/sterol content, respectively. (d) First and second principal component scores for each cell line. Colors represent different samples, whereas shapes represent clonal membership, as shown in the legend. Clusters are based on hierarchical linkage analysis as illustrated in Supporting Figure 1. (e) Top: averaged spectra from cluster 1 (blue) subtracted from the entire data set mean. The dotted black line plots the leastsquares fit to pure components. Bottom: the fitted pure spectra of adenosine, cholesterol, and phosphatidylcholine, offset for clarity.
Figure 2b shows the representative Raman spectra (from clone C) in the range of 800–1900 cm−1 for both brightfieldtrapped and CD9+ EVs. Each spectrum was processed by smoothing and background correction (e.g., asymmetric leastsquares fitting to blank spectra of PBS solvent deposited on the quartz substrate),12 and those comprising a given experimental group were averaged (Figure 2c). Spectra were not normalized prior to comparison in this study; thus, the peak integrations can be considered as measures of relative chemical concentrations. Table 1 lists the major peak locations and assignments for common biological materials found in exosome-type EVs, including lipids, proteins, and nucleic acids. It is apparent from the averaged spectra that the CD9+ subpopulation exhibits lower peak heights across the range of biological components compared to the brightfield-trapped EVs, indicative of either smaller size and/or reduced density.
Table 1.
Major Peak Locations and Chemical Group Assignments for the Biologicals Commonly Found in Exosome-Type EVs, Including for Nucleic Acids, Proteins, Lipids, and Cholesterola
| biochemical group | major peak positions (cm−1) | assignment |
|---|---|---|
| nucleic acids | 898, 1095, 1128, 1420, 1490, 1580 | nucleic base and phosphate backbone vibrations |
| protein/amino acids | 840, 882, 1000, 1240–1280, 1455, 1680 | Trp/Phe, CH deformations, amide I/III |
| lipids | 1265, 1300, 1445, 1656 | C=C stretching, CH/CH2 deformations |
| cholesterol | 1150, 1440, 1680 | steroid ring vibrations, CH/CH2/CH3 deformations |
To better interpret the variability of the CD9+ EV subpopulation, we applied principle component analysis (PCA), a useful tool for determining the wavelength regions that are important for comparing the similarities and differences between individual samples. From a collection of Raman spectra featuring contributions from distinct chemical components, PCA can estimate the latent spectra (loadings) and corresponding relative sample concentrations (scores) for each trapped vesicle. Essentially, PCA quickly identifies not only what combination of peaks gives rise to the major differences within the data set (e.g., protein-rich vs lipid-rich), but also quantifies the magnitude of those differences for each vesicle. In order to get a sense of the grouping of the data set, the first two sets of PCA scores (derived using Matlab’s built-in “pca” function) were plotted against each other (Figure 2d). Only 10 principle components contributed more than 1% to the total variance among all samples; thus, the first 10 principle components embodied more than 90% of the total data set variance. The first two principle components represented 45% and 14% of the variance, respectively. Therefore, the PC1 versus PC2 plot (Figure 2d) illustrates the major components contributing to differences among vesicle composition.
In order to quantify the apparent bunching according to similarity in loadings and scores, hierarchical clustering analysis was applied to group the measurements into defined clusters. The three major identified clusters are circled in Figure 2d for ease of visualization (the full dendrogram output of the cluster analysis is shown in Supporting Figure 1). It is apparent that the CD9+ vesicles cluster together regardless of cell origin (Figure 2d, blue cluster), indicating the presence of a shared CD9+ subpopulation. Furthermore, the CD9+ clusters exhibit less spread in both PC1 and PC2 compared to the brightfieldtrapped vesicles, suggesting the CD9+ subset is more chemically homogeneous than the total population of vesicles isolated by ultracentrifugation.
We next employed least-squares fitting of pure chemical components (previously measured on the same MS-OTs system) to the spectral differences between a given cluster’s mean spectrum and the total data set mean spectrum (Figure 2e). Fitting the CD9+ cluster difference to pure nucleic acid (adenosine, used as a purine stand-in to represent the spectral character of nucleic acids), cholesterol, and representative phosphocholine lipid (DOPC) yields a curve that represents a large portion of the spectrum’s features (Pearson’s correlation coefficient r = 0.78). Given that the fitted components all decreased in this cluster compared to the mean of the total data set (Figure 2e, bottom), we reason that CD9+ EVs exhibit reduced chemical concentration across the range of common biologicals. This suggests that the CD9+ subset represents EVs with smaller relative size and/or density compared to the total population isolated by ultracentrifugation.
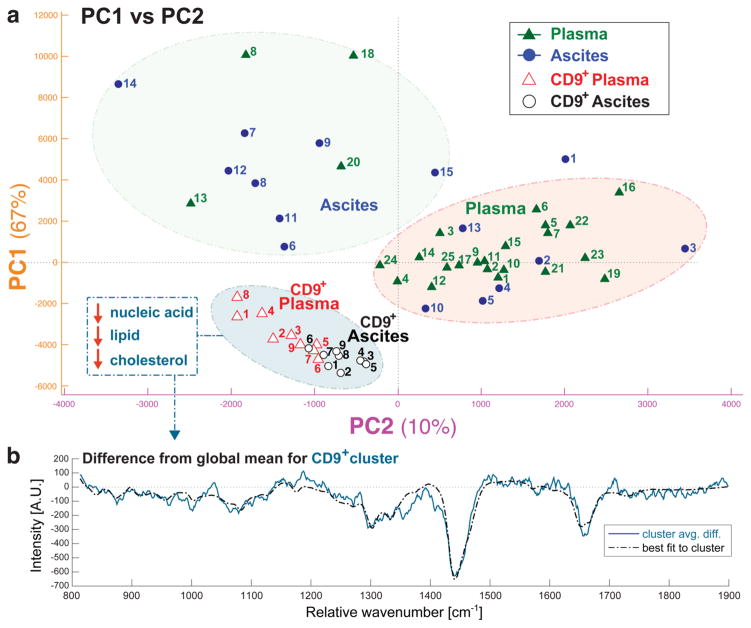
To further generalize our observation, we extended our study from in vitro MSC cell culture supernatant to exosomes isolated from human biofluids. Plasma (isolated from whole blood) and ascites collected during tumor resection surgery of ovarian cancer patients were subjected to ultracentrifugation in order to isolate exosomes. Vesicles from each type of sample were measured by MS-OTs, under both brightfield trapping and prelabeled with anti-CD9 for fluorescence trapping, as described above for MSC-derived exosomes. For both types of ovarian cancer samples, we observed the CD9+ exosome subset to exhibit similar grouping in PC1 versus PC2 space (Figure 3a). Furthermore, the spectral differences between the CD9+ cluster members and the global mean could be nearly completely described by least-squares fitting to the same pure components as above (adenosine, cholesterol, and phosphocholine lipid). This data indicates that the CD9+ subpopulation is not relegated to only MSC-derived or in vitro samples, but instead is common to ultracentrifuge-isolated exosomes independent of biofluid source.
Figure 3.
(a) First and second principle component scores for single exosomes derived from human ovarian cancer patient plasma and ascites samples. Hierarchical clustering analysis revealed that CD9+ vesicles (trapped under fluorescence examination) grouped together regardless of source. (b) The blue line plots the averaged spectra from the CD9+ cluster subtracted from the entire data set mean. The dotted black line plots the least-squares fit to pure components adenosine, cholesterol, and phosphatidylcholine.
The PC1 and PC2 loading vectors for both MSC and tumor data sets, in addition to the respective principle component scores for each trapped MSC-EV, are shown in Supporting Figure 3. For both data sets the CD9+ cluster is separated from the brightfield-trapped EVs primarily along PC1. The PC1 loading vector (Supporting Figure 3a, orange) is very similar to the cluster’s average difference from the total data set (Figure 2e, top) and, thus, is consistent with the chemical analysis presented before. Interestingly, examination along minor component PC2 reveals separation of brightfield-trapped EVs, both among clones (Figure 2d) and plasma from ascites (Figure 3a). We could identify several major bands in PC2 (Supporting Figure 3a, purple) to be of protein origin, such as near 1000 cm−1 due to phenylalanine and between 1200 and 1300 cm−1 due to amide III vibrational modes. Yet we were not able to fully describe the spectral variations by matching with library standards; thus, the precise origin of this separation remains unknown. One explanation may be that some degree of separation among brightfield-trapped EVs is a result of sampling error based on bias toward higher scattering particles during trapping. This interpretation is supported by the large range in scattering intensity observed across EV size in the nanoparticle tracking analysis (NTA) data (Figure 4). On the other hand, disparate levels of contaminating protein and protein aggregates across sample sets may contribute to the observed variation.
Figure 4.
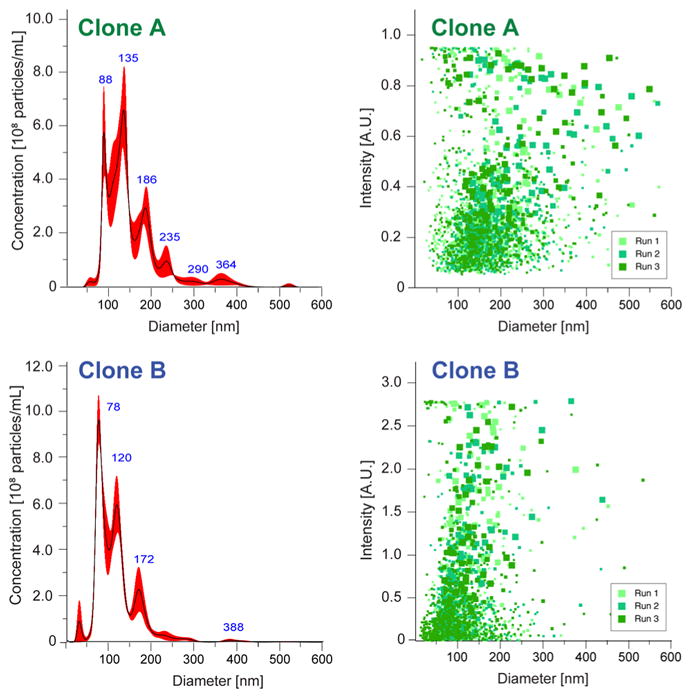
Representative nanoparticle tracking analysis (NTA) of clones A and B. Size (left) and scattering (right) distributions are presented from three consecutive 60 s runs for each sample. There is considerable variation in scattering intensity among particles at the same size.
Interestingly, as demonstrated by the scores plots presented in Figures 2d and 3a, only a few brightfield-trapped vesicles colocalized with the CD9+ EVs. Yet, given the apparent concentration of fluorescently labeled EVs in the antibody-labeled groups, we expected to trap more CD9+ vesicles simply by chance during brightfield measurement. A possible explanation for this can be found by examining the brightfield image of the CD9+ EVs after trapping under fluorescence view. As shown in Figure 5, the CD9+ EVs are less visible in the brightfield and thus, are likely to be passed over during brightfield measurement. Additionally, we observed CD9+ particles to be more unstable in the trap, likely reflective of the smaller difference in refractive index between the particle and the surrounding medium.
Figure 5.
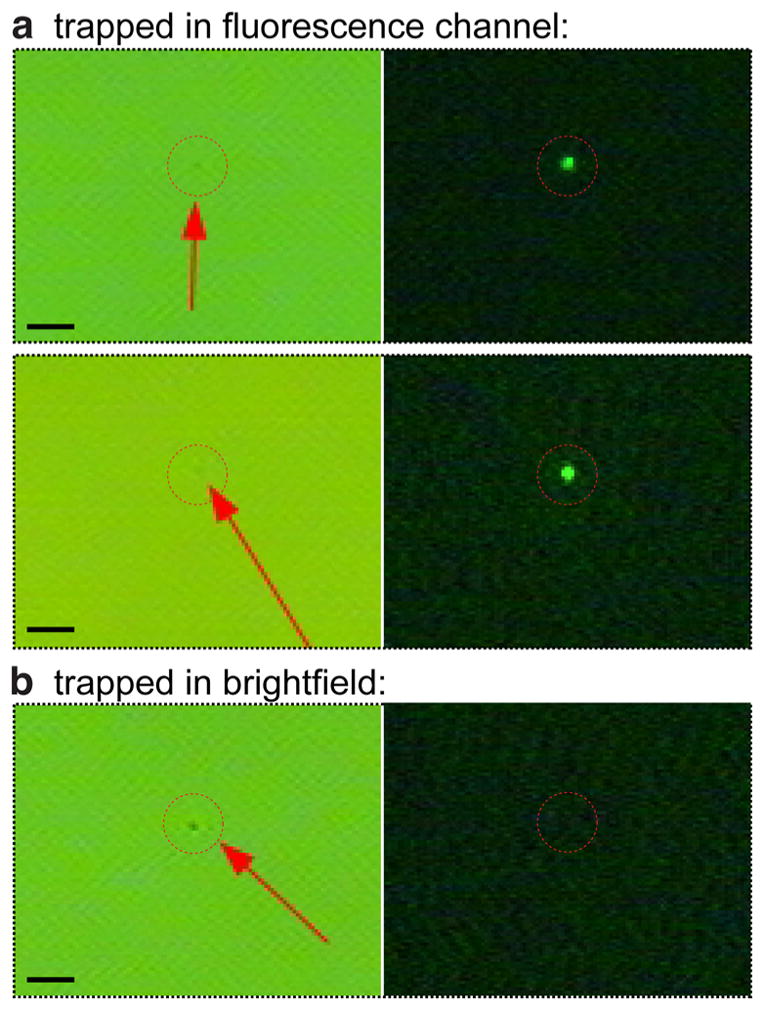
Brightfield and fluorescence channel images for three trapped vesicles. (a) The top two sets of images were captured of vesicles trapped by examination in the green channel (CD9+ subset) while (b) the bottom set of images was captured for a vesicle trapped in the brightfield. It is evident that the CD9+ vesicle subpopulation exhibits less scattering in the brightfield, hypothesized to be due to their relatively smaller size and/or density. The scale bar insets measure 5 μm.
A few laboratories have reported the presence of exosome subpopulations, including ones split into high- and low-density groups.6,7 Another report, comprising proteomic characterization of EVs isolated from ovarian carcinoma cells, proposed that high- and low-density subpopulations correlated with CD9 expression and, furthermore, measured the CD9-negative (or rather with very low expression) fraction to exhibit a density similar to apoptotic blebs.20 Given our results, we posit that fluorescence measurement offers a critical advantage compared to the brightfield, where EVs either smaller than about 50 nm, or with reduced density but larger than 50 nm, are typically not visible due to the low scattering from their limited amounts of organic material. Instead, fluorescence intensity is proportional to the concentration of dye molecules localized to a given vesicle, allowing for trapping and Raman spectra measurement of smaller or less dense vesicles. In fact, when switching between brightfield and fluorescence views for the same sample, the latter typically appears to be more heavily concentrated. To further investigate this point, we examined the scattering data measured during NTA of the MSC-derived EVs. Two representative NTA analyses are presented in Figure 4, for clones A and B. The size distributions (Figure 4, left panels) encompass the range typically associated with exosome-type EVs (50–200 nm). Yet, the distribution in particle scattering (Figure 4, right panels) suggests a wide range of intensities across a given nominal size, indicating that the differences in scattering we observed under brightfield are more likely due to differences in density rather than size. It is possible that our observation is solely due to reduced density, but in that case we would expect the lipid signal to remain relatively constant (assuming a fixed lipid bilayer density). Since we measured a decrease in lipid signal, it is likely that decreases in both size and density contribute to the differences observed in the CD9+ subset.
This interpretation supports the aforementioned studies reporting that low-density EV subpopulations are enriched in CD9 and related tetraspanins and may represent an alternative “exosome-type” vesicle population originating from the multivesicular body pathway.21 This observation has potential clinical relevance for exosome-based therapeutics and also diagnostics, as a standardized description of exosome subpopulations would increase the resolution of biomarker definition, since isolated vesicles could be further separated into groups according to subset.
Given that our data comprises single-vesicle measurements, a major limitation is small sample number. This is reflective of the weak nature of spontaneous Raman scattering, necessitating long scans (5 min/vesicle) to collect spectra with acceptable signal-to-noise ratio. Furthermore, an inherent constraint of optical tweezers is the ability to only trap particles with sufficient difference in refractive index compared to the surrounding medium, restricting our ability to measure vesicles smaller than approximately 50 nm.
CONCLUSION
By combining measurement of Raman spectra, which reports on molecular bonds and therefore the biomolecular composition of the trapped vesicle, with fluorescence imaging, using fluorescently labeled reporter molecules, such as an antibody against a surface membrane proteins, we have multiplexed quantification of compositional variance among groups of vesicles. We employed FITC-labeled anti-CD9 antibody as the reporter, by first prelabeling purified exosomes in solution. Members of the CD9+ vesicle subpopulation were selectively trapped and their Raman spectra compared to the sample batch of exosomes without fluorescence discrimination. For both in vitro stromal cell and in vivo cancer-associated biofluid sources, we observed that the CD9+ exosome subset exhibited less chemical heterogeneity and also reduced component concentration compared to the bulk vesicle population as isolated by classical ultracentrifugation.
EXPERIMENTAL METHODS
All chemicals were purchased from commercial suppliers and used without further purification. Cholesterol and the DOPC lipid used in this study (1,2-1,2-dioleoyl-sn-glycero-3-phosphocholine) were purchased from Avanti Polar Lipids, Inc. (Alabaster, AL). Anti-CD9-FITC was purchased from Abcam (Cambridge, MA). Unless otherwise noted, all other reagents and materials were purchased from Sigma-Aldrich Corp. (St. Louis, MO).
Multispectral Optical Tweezers Setup
The 785 nm laser light (CrystalLaser, Reno, NV) was coupled to a 60×, 1.2NA water immersion objective on an inverted microscope (Olympus IX-71). Brightfield images were illuminated by an Olympus TH4-100 lamp. Fluorescence images were illuminated by mercury lamp.
Manual movement of the stage and focus height enabled vesicle trapping. To minimize background from the quartz, trapped vesicles were slowly brought up away from the slide surface. To keep data consistent and accurate, we chose to avoid trapping particles with rough perimeters or whose tumbling motion could be clearly seen, both of which we believed indicators of an aggregate. An additional issue we encountered was the tendency of trapped particles to fall out of the trap before completion. To ensure particles remained in place for the duration of the Raman scattering detection, we routinely switched back to the camera following Raman scattering detection to check that the particle is still trapped. Finally, to be sure we did not trap the same vesicle more than once, care was taken to move far away from the previous trapped vesicle following its release.
For a typical measurement, a 20 μL drop containing a dilute sample of exosomes (105 particles/mL as measured by NTA) was deposited on a quartz disc (SPI Supplies, 25 mm round × 0.15–0.18 mm thick) placed on a translational stage positioned over the objective lens. Once trapped, five 60 s integrations were taken to generate the final Raman spectra. DT-Acquire software was used to observe the live feed from the video camera. Winspec software was used for recording spectra from the Raman detector. A processed data set, i.e., cosmic ray removal, background correction, and smoothing, all performed by a custom Matlab (Mathworks) script based on the built-in “pca” function, which decomposes the data set down into the scores and loadings, was generated. For hierarchical clustering, the input to linkage is the first 10 scores from the PCA decomposition. Scores with Nq > 10 were typically corrupted by noise and removed. Fits of principle component cluster spectra to chemical standards were performed via least-squares modeling. More details concerning the analytical methodology can be found in a previous study.12
Cell Culture and Exosome Isolation and Characterization
Four rat MSC lines were generated as previously described.19 Briefly, bone marrow was isolated from adult rats, with buffy coats plated on plastic adherent tissue culture plates at a density of 1.0 × 10⁶ cells mL−1. Primary adherent cells were exposed to LXSN-16 E6E7 retrovirus for 2 h and 4 μg mL−1 Polybrene. Virus containing medium was removed, and adherent cells were incubated with medium containing Polybrene for an additional 5 h. All clones expressed CD73, CD90, CD105, and CD166, with no expression of CD14, CD34, and C45. MSC clones were assessed for differentiation potential using adiopogenic and osteogenic differentiation kits (Trevigen, Gaithersburg, MD).
For exosome isolation, MSC cell line clones were cultured with RPMI medium containing 10% EV-depleted fetal bovine serum (FBS) (precleared at 100 000g, 4 °C, 18 h), to ensure that the resulting EVs originated from the MSC cells. After 48 h the cell culture medium was harvested and centrifuged at (i) 2000g, 10 min to remove cells and large debris, (ii) 10 000g, 30 min to remove microparticles, and (iii) 2 × 100 000g, 2 h, to remove contaminating protein.22 The resulting pellet was dissolved in a minimal amount of PBS (20 μL of PBS per 5 million cells cultured) and frozen at −80 °C for up to a month before analysis by MS-OTs.
Exosomes were isolated from blood and ascites on the same day of collection from the patient. Whole blood was collected in a lavendar-capped plastic tube coated with the anticoagulant EDTA to prevent clotting and carefully transported on ice to the lab for processing. An amount of 4 mL of whole blood was centrifuged at 2000g, 4 °C, 15 min to separate plasma, which was carefully removed by Pasteur pipet to a cooled polypropylene tube. From here, plasma and ascites were subjected to the centrifugation steps I–iii outlined above for cell culture supernatant.
For antibody labeling, exosomes were mixed with a 1:100 dilution of anti-CD9-FITC antibody in Milli-Q H2O. After overnight incubation at 4 °C under gentle rotation, the exosome solution was centrifuged at 100 000g for 2 h to remove unbound antibody. The pellet was redissolved in 20 μL of PBS for immediate MS-OTs measurement. The ratio of protein concentration (by BCA assay) and number concentration/size distribution (by NTA) was used to ensure our preparations were relatively pure of excess free protein or other contaminating factors.23 Procedures for BCA assay and NTA were performed as reported previously.12
Supplementary Material
Acknowledgments
The authors acknowledge support from the NIH T32 HL007013 and Ovarian Cancer Education & Research Network (OCERN) Grant awarded to R.P.C., the NIH CA115483 Grant awarded to K.S.L., the NIH/NIDCR R01DE018701 awarded to J.D.B., and the NIH/NCI P30 CA093373 awarded to the UC Davis Cancer Center. The authors thank Dr. James Chan for providing access to the Raman instrument, Dr. Matt Mellema for performing NTA, and Dr. Maria Navas-Moreno for helpful discussions and instrument maintenance. Ovarian cancer specimens were provided by the UC Davis Comprehensive Cancer Center Biorepository which is funded by the UC Davis Comprehensive Cancer Center Support Grant (CCSG) awarded by the National Cancer Institute (NCI). This work was conceived in part with the support of the West Coast Exosome Consortium (WestCo Exosortium).
Footnotes
Notes
The authors declare no competing financial interest.
The Supporting Information is available free of charge on the ACS Publications website at DOI: 10.1021/acs.analchem. 7b00017.
Materials and methods and additional figures showing full dendrogram output of the cluster analysis, post ultracentrifugation purification control, and PC1 and PC2 loading vectors (PDF)
References
- 1.Kowal J, Tkach M, Thery C. Curr Opin Cell Biol. 2014;29:116–125. doi: 10.1016/j.ceb.2014.05.004. [DOI] [PubMed] [Google Scholar]
- 2.Patton JG, Franklin JL, Weaver AM, Vickers K, Zhang B, Coffey RJ, Ansel KM, Blelloch R, Goga A, Huang B. J Extracell Vesicles. 2015;4:27494. doi: 10.3402/jev.v4.27494. [DOI] [PMC free article] [PubMed] [Google Scholar]
- 3.Lai RC, Yeo R, Lim SK. Semin Cell Dev Biol. 2015;40:82–88. doi: 10.1016/j.semcdb.2015.03.001. [DOI] [PubMed] [Google Scholar]
- 4.Ciardiello C, Cavallini L, Spinelli C, Yang J, Reis-Sobreiro M, de Candia P, Minciacchi V, Di Vizio D. Int J Mol Sci. 2016;17:175. doi: 10.3390/ijms17020175. [DOI] [PMC free article] [PubMed] [Google Scholar]
- 5.Rupert DLM, Claudio V, Lässer C, Bally M. Biochim Biophys Acta, Gen Subj. 2017;1861:3164–3179. doi: 10.1016/j.bbagen.2016.07.028. [DOI] [PubMed] [Google Scholar]
- 6.Kowal J, Arras G, Colombo M, Jouve M, Morath JP, Primdal-Bengtson B, Dingli F, Loew D, Tkach M, Thery C. Proc Natl Acad Sci U S A. 2016;113:E968–77. doi: 10.1073/pnas.1521230113. [DOI] [PMC free article] [PubMed] [Google Scholar]
- 7.Willms E, Johansson HJ, Mäger I, Lee Y, Blomberg KEM, Sadik M, Alaarg A, Smith CIE, Lehtiö J, El Andaloussi S, et al. Sci Rep. 2016;6:22519. doi: 10.1038/srep22519. [DOI] [PMC free article] [PubMed] [Google Scholar]
- 8.Wang W, Lotze MT. Cancer Gene Ther. 2014;21:139–141. doi: 10.1038/cgt.2014.14. [DOI] [PubMed] [Google Scholar]
- 9.Katsuda T, Kosaka N, Ochiya T. Proteomics. 2014;14:412–425. doi: 10.1002/pmic.201300389. [DOI] [PubMed] [Google Scholar]
- 10.Sharma S, Gimzewski JK. J Nanomed Nanotechnol. 2012;03:1. [Google Scholar]
- 11.Momen-Heravi F, Balaj L, Alian S, Tigges J, Toxavidis V, Ericsson M, Distel RJ, Ivanov AR, Skog J, Kuo WP. Front Physiol. 2012;3:354. doi: 10.3389/fphys.2012.00354. [DOI] [PMC free article] [PubMed] [Google Scholar]
- 12.Smith ZJ, Lee C, Rojalin T, Carney RP, Hazari S, Knudson A, Lam K, Saari H, Ibañez EL, Viitala T. J Extracell Vesicles. 2015;4:28533. doi: 10.3402/jev.v4.28533. [DOI] [PMC free article] [PubMed] [Google Scholar]
- 13.Butler C, Fardad S, Sincore A, Vangheluwe M, Baudelet M, Richardson M. Proc SPIE. 2012;8225:82250C–82250C-6. [Google Scholar]
- 14.Kong L, Zhang P, Setlow P, Li Y-q. Anal Chem. 2010;82:3840–3847. doi: 10.1021/ac1003322. [DOI] [PubMed] [Google Scholar]
- 15.Kong L, Zhang P, Wang G, Yu J, Setlow P, Li Y-q. Nat Protoc. 2011;6:625–639. doi: 10.1038/nprot.2011.307. [DOI] [PubMed] [Google Scholar]
- 16.Thomas GJ., Jr Annu Rev Biophys Biomol Struct. 1999;28:1–27. doi: 10.1146/annurev.biophys.28.1.1. [DOI] [PubMed] [Google Scholar]
- 17.De Gelder J, De Gussem K, Vandenabeele P, Moens L. J Raman Spectrosc. 2007;38:1133–1147. [Google Scholar]
- 18.Lötvall J, Hill AF, Hochberg F, Buzas EI, Di Vizio D, Gardiner C, Gho YS, Kurochkin IV, Mathivanan S, Quesenberry P, et al. J Extracell Vesicles. 2014;3:26913. doi: 10.3402/jev.v3.26913. [DOI] [PMC free article] [PubMed] [Google Scholar]
- 19.Hwang B, Liles WC, Waworuntu R, Mulligan MS. J Thorac Cardiovasc Surg. 2016;151:841–849. doi: 10.1016/j.jtcvs.2015.11.043. [DOI] [PMC free article] [PubMed] [Google Scholar]
- 20.Gutwein P, Stoeck A, Riedle S, Gast D, Runz S, Condon TP, Marmé A, Phong MC, Linderkamp O, Skorokhod A, et al. Clin Cancer Res. 2005;11:2492–2501. doi: 10.1158/1078-0432.CCR-04-1688. [DOI] [PubMed] [Google Scholar]
- 21.Cocucci E, Meldolesi J. Trends Cell Biol. 2015;25:364–372. doi: 10.1016/j.tcb.2015.01.004. [DOI] [PubMed] [Google Scholar]
- 22.Lobb RJ, Becker M, Wen SW, Wong CSF, Wiegmans AP, Leimgruber A, Möller A. J Extracell Vesicles. 2015;4:27031. doi: 10.3402/jev.v4.27031. [DOI] [PMC free article] [PubMed] [Google Scholar]
- 23.Webber J, Clayton A. J Extracell Vesicles. 2013;2:19861. doi: 10.3402/jev.v2i0.19861. [DOI] [PMC free article] [PubMed] [Google Scholar]
Associated Data
This section collects any data citations, data availability statements, or supplementary materials included in this article.


