Abstract
The sodium/potassium ATPase (NKA) is essential for establishing the normal intracellular [Na+] and [K+] and transmembrane gradients that are essential for many cellular functions, including cardiac electrophysiology and contractility. Different NKA isoforms exhibit differential expression levels, cellular localization, and function in different tissues and species. Prior work has indicated that the NKA-α1 isoform is quantitatively predominant in cardiac myocytes, but that the α2 isoform is preferentially concentrated in the transverse tubules (TT), possibly at junctions with the sarcoplasmic reticulum (SR) where α2 may preferentially modulate cardiac contractility. Here we measured subcellular localization of NKA-α1 and α2 using super-resolution microscopy (STED and STORM) and isoform-selective antibodies in mouse ventricular myocytes. We confirm the preferential localization of NKA-α2 in TT vs. surface sarcolemma, but also show that α2 is relatively excluded from longitudinal TT elements. In contrast NKA-α1 is relatively uniformly expressed in all three sarcolemmal regions. We also tested the hypothesis that NKA-α2 (vs. α1) is preferentially concentrated at SR junctional sites near ryanodine receptors (RyR2). The results refute this hypothesis, in that NKA-α1 and α2 were equally close to RyR2 at the TT, with no preferential NKA isoform localization near RyR2. We conclude that in contrast to relatively uniform NKA-α1 distribution, NKA-α2 is preferentially concentrated in the truly transverse (and not longitudinal) TT elements. However, NKA-α2 does not preferentially cluster at RyR2 junctions, so the TT NKA-α2 concentration may suffice for preferential effects of NKA-α2 inhibition on cardiac contractility.
Introduction
The sodium/potassium ATPase (NKA) is the primary sodium extrusion pathway in cardiac myocytes and plays a critical role in cardiac contractility. NKA, a member of the P-type ATPase family, actively transports 3 Na+ ions out of the cell in exchange for 2 K+ ions for each molecule of ATP hydrolyzed. In adult cardiac myocytes, the catalytic α subunit of NKA is present in the α1, α2, α3 isoforms [1]. These isoforms however differ in expression level, tissue expression, sensitivity to cardiac glycosides, and voltage dependence.[2-5] The α1 isoform is ubiquitously expressed in all tissue types, is present in cardiac tissue in all species, and is the predominant NKA isoform in cardiac tissue [2, 3]. In human left ventricle, α1 comprises of 62.5% of total NKA mRNA, while α2 and α3 are expressed at 15% and 22.5%, respectively [6]. In rat and mouse left ventricle, where only α1 and α2 are expressed, α1 comprises of 75% and 88% of total NKA protein in rat and mouse, respectively and similarly 71-89% of total NKA pump current [7-11].
Myocyte detubulation studies demonstrated major differences in NKA isoform distribution in cardiac myocytes. NKA-α1 is roughly uniformly distributed throughout the sarcolemma, while α2 is highly concentrated in the transverse tubules (TTs) [9-12]. These studies found that NKA-α2 density is 4 to 6 times higher in TTs compared to surface sarcolemma (SSL). Although α2 is concentrated in the TT, there is at least as much NKA-α1 in the TT system (>55% of NKA in the TTs is α1). At the SSL, α1 is the dominant isoforms with 85-95% of the total NKA being α1.[9-11]
Given the differences in isoform expression and localization, one could view α1 as the main isoform responsible for ion homeostasis, while α2 might be involved in cardiac contractility, as in skeletal muscle cells. Skeletal muscle TTs (that are highly specialized to control Ca2+ release) contain almost exclusively the α2 isoform, and it is well established that α2, and not α1, is responsible for modulating contractility [13-15]. In quiescent cells, α2 functions below its maximal pump rate because of its voltage dependence, so that it is more active when the cell is depolarized [13, 16, 17]. Conversely, NKA-α1 is highly expressed at the SSL, its pump activity is not appreciably voltage dependent, and is responsible for regulating ion homeostasis.
Like in skeletal muscle, cardiac α2 function and inhibition has been shown to preferentially modulate contractility [8, 18, 19]. The 500-fold higher ouabain affinity for NKA-α2 vs. α1 in mouse (and rat), along with genetically altered mice (in which these affinities are reversed), has allowed direct functional comparisons of α1 vs. α2 inhibition effects on cardiac myocyte contractility [18]. Despa et al.[18] showed that blocking nearly all NKA-α2 (20% of total NKA) significantly enhanced contractility, whereas selective partial inhibition of α1 (again 20% of total NKA) did not, despite producing the same measured change in [Na+]i in both cases. Similarly, selective NKA-α2 inhibition in rat ventricular myocytes increased contractility by 40%, without detectable rise in [Na+]i [11]. Both NKA isoforms (especially α2) and the Na+/Ca2+ exchanger (NCX) are concentrated in TTs and may interact, such that local NCX could facilitate the impact of local [Na+]i on Ca2+ transients and contractility [8, 12, 20-23].
If both α1 and α2 are in TTs at comparable levels, why does α2 inhibition more strongly influence contractility? One attractive hypothesis is that local distributions of α1 and α2 differ, with NKA-α2 preferentially located at junctional clefts with the sarcoplasmic reticulum (SR), near ryanodine receptors (RyR2) that control SR Ca2+ release. Roughly 40% of the T-tubules in rat and mice are in SR junctional clefts, whereas only 6-8% of the SSL is in such junctions.[24, 25] Selective localization of α2 at such junctional clefts would explain the 4-6-fold higher TT vs. SSL localization of NKA-α2, and could create a local NKA-NCX-RyR nanodomain that could influence local [Na+]i and [Ca2+]i and contractility. There is precedent for the selective localization of α2 vs. α1 at plasma membrane junctions with the SR or ER in other cell types,[26-28] but definitive data in ventricular myocytes is lacking.
In this study, we employ super-resolution microscopy to characterize the distribution and localization patterns of α1 and α2 in mouse ventricular myocytes, overcoming limitations of prior immunofluorescence studies. Using three-dimensional STED microscopy, we found the expected TT concentration of NKA-α2 vs. SSL, but α2 is nearly absent in longitudinal components of the TT network. In contrast NKA-α1 was present in all sarcolemmal domains, including longitudinal ramifications of the TTs. We also used higher resolution STORM imaging to identify isoform distribution differences specifically at the TTs. We found that, contrary to our above hypothesis, α2 is not preferentially concentrated (vs. α1) at junctional SR sites where RyR2 is localized.
Methods
Cell Preparation
Cardiac ventricular myocytes were isolated from Black 6 mice hearts using the Langendorff perfusion technique. All animal procedures were approved by the University of California, Davis Animal Research and use Committee in accordance with the NIH Guide for Care and Use of Laboratory Animals.
Mice were deeply anesthetized with 3-5% isoflurane. Hearts were excised and mounted on a gravity-driven Langendorff perfusion apparatus. Perfusion solution with MEM (135 mM NaCl, 4.7 mM KCl, 0.6 mM KH2PO4, 0.6 mM Na2HPO4, 1.2 mM MgSO4, 20 mM HEPES, 30 mM Taurine), 6 mM glucose, and 6mM butanedione monoxime (BDM) and was oxygenated and perfused through the heart. Digestion solution (MEM, 12.5 μM free [Ca2+], 6 mM BDM, 50 μg/ml Liberase TM (Sigma)) was perfused through the heart for 10 min. Ventricular cardiac tissue chunks were broken up by trituration in stopping solution (MEM, 12.5 μM Ca2+, 6 mM BDM, 1% FBS) and washed several times to disperse individual myocytes in a final solution of 0.8 mM Ca2+ Tyrode's solution (140 mM NaCl, 4 mM KCl, 1 mM MgCl2, 5 mM HEPES, 10 mM glucose).
Immunochemistry
Isolated ventricular myocytes were fixed using 4% paraformaldehyde in PBS for 10 min. Cells were washed five times with PBS and permeabilized with 0.2% triton-X-100 for 10 min. Cells were washed five more times with PBS and blocked with 5% bovine serum and 5% goat serum for 1 hr. Cells were then incubated overnight at 4°C in primary antibody. Primary antibodies anti-RyR2 (ThermoFisher, mouse monoclonal IgG1, C3-33), anti-NKA α-1 (Millipore, mouse monoclonal IgG1k, C464.6), anti-NKA α-2 (Millipore, rabbit polyclonal IgG) were diluted at 1:50-100 in PBS with 3% bovine serum and 3% goat serum. Cells were washed five times with PBS with 1% bovine serum and incubated with secondary antibodies overnight at 4°C or for 2 hours at room temperature. For STORM imaging, Alexa Fluor 568, and 647 (ThermoFisher) at 1:200 in PBS with 3% bovine serum and 3% goat serum was used. When staining cells with antibodies raised against the same host animal, Zenon Alexa Fluor Labeling Kits were used. The ratio of fluorophore to primary antibody used was 8 ul dye to 1 ug of antibody. For STED imaging, Oregon Green 488, Alexa Fluor 532, and Alexa Fluor 555 (ThermoFisher) were used at 1:200-1000 in PBS with 3% bovine serum and 3% goat serum. When staining cells with antibodies raised against the same host animal, Zenon Alexa Fluor Labeling Kits were used. The ratio of fluorophore to primary antibody used was 5-8 ul dye to 1 ug of antibody. After secondary antibody incubation, cells were washed 5 times with PBS with 1% bovine serum. Cells for STED imaging were mounted onto coverslip with ProLong Diamond Antifade Mountant (ThermoFisher) and cured overnight at room temperature.
To validate specificity, NKA antibodies were quenched with peptide sequences specific to the isoform-specific epitope which was used to raise the antibody. These peptides are isoform-specific and prevent antibody interaction. The NKA α1 antibody used here was previously validated via peptide quenching and visualized through Western blot, where the antibody showed a single 100 kDa band that was prevented by the epitope peptide [11]. The NKA α2 antibody was tested here via the peptide quench approach (Suppl Figure S1). Increasing concentration of epitope peptide progressively quenched the NKA α2 antibody signal at 100 kDa (and similarly at smaller bands are likely NKA α2 degradation products). The RyR2 antibody used is frequently utilized and was validated in immunocytochemistry and super-resolution microscopy [25, 29].
STORM Imaging
STORM super-resolution images were acquired using an Andor Diskovery system (Andor Technologies) coupled to a Nikon Ti-E microscope (Nikon) with a 60× 1.45 TIRF oil objective (Nikon) and an iXon Ultra DU888 camera (Andor Technologies). A custom 2× camera magnification lens yielded a total magnification of 120× for a 112 nm effective pixel size. Fluorophores were excited with 150mW (488nm, 561nm, and 640nm) or 200mW (405nm) lasers housed in an Andor ILE (Andor Technologies). Images were acquired for 10,000 frames. Device control and image acquisition were enabled by Metamorph 7.8.12 (Molecular Devices). STORM image reconstruction and processing was performed using the ThunderSTORM plugin for ImageJ. Image reconstruction 5× magnification yielded a 22nm pixel size. The absence of secondary antibody specific STORM aberrations and negligible minimal autofluorescence was observed with primary antibody free cell images (Suppl Figure S2).
STED Imaging
STED super-resolution images were acquired on Leica TCS SP8 STED 3× (Leica) microscope with a Leica HC PL APO 100×/1.40 oil STED WHITE objective (Leica) with HyD detectors (Leica). Pixel size was 24.15nm. Fluorophores were excited with a white light laser, WLL, (Leica) with an average power of 1.5mW and wavelength range from 470-670nm. STED depletion was performed by a 660nm STED 3× CW laser (Leica) with average power of 200 mW. Device control and image acquisition were enabled by LASX software (Leica). STED image deconvolution was performed by Huygens software (Scientific Volume Imaging). Negligible minimal autofluorescence was observed with primary antibody free cell images (Suppl Figure S3).
Results
α1 and α2 Localization in SSL
To examine α1 and α2 expression patterns, adult mouse ventricular cardiac myocytes were stained with α1 and α2 antibodies, fluorescently labeled, and subsequently imaged with three-dimensional STED. The fluorescent signals from 3D reconstructions with volume rendering (including all z-planes) are shown in Figure 1, where both NKA-α1 and α2 are apparent at the surface sarcolemma (SSL) and in transverse striations. In Figure 2A and B (left panels), we zoom in on two-dimensional maximum intensity projections for NKA-α1 and α2, respectively. The NKA clusters on the outer myocyte surface shell (0.66 μm thick) that represents the SSL is shown in Figure 2A-i, B-i. This shell is immediately under a shrink-wrap surface that is used analytically to identify the outer myocyte edge in 3-D, with individual SSL clusters alone identified at right (Figure 2A-ii, B-ii). The STED images show that both α1 and α2 are present at the SSL, but that obvious structural organization is not apparent.
Figure 1. 3D reconstruction of high-resolution STED images of NKA isoforms.
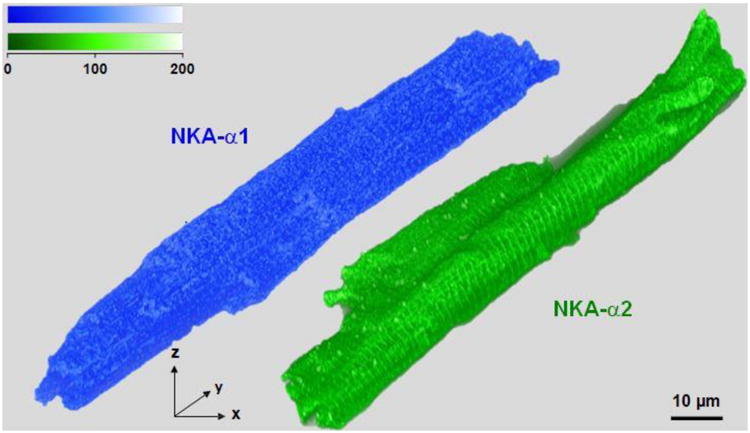
3D reconstructions with volume rendering of mouse ventricular myocytes stained with NKA-α1 (Alexa Fluor 555) in blue and NKA-α2 (Oregon Green 488) in green from STED super-resolution imaging; scale bars are 10 μm. Both isoforms are present at the SSL and in transverse striations. Volumes were rendered with an adapted opacity transfer function to highlight SSL NKA isoform distribution. Fluorescence intensity scale (top) is in arbitrary units.
Figure 2. Surface Sarcolemma (SSL) distribution of NKA isoforms.
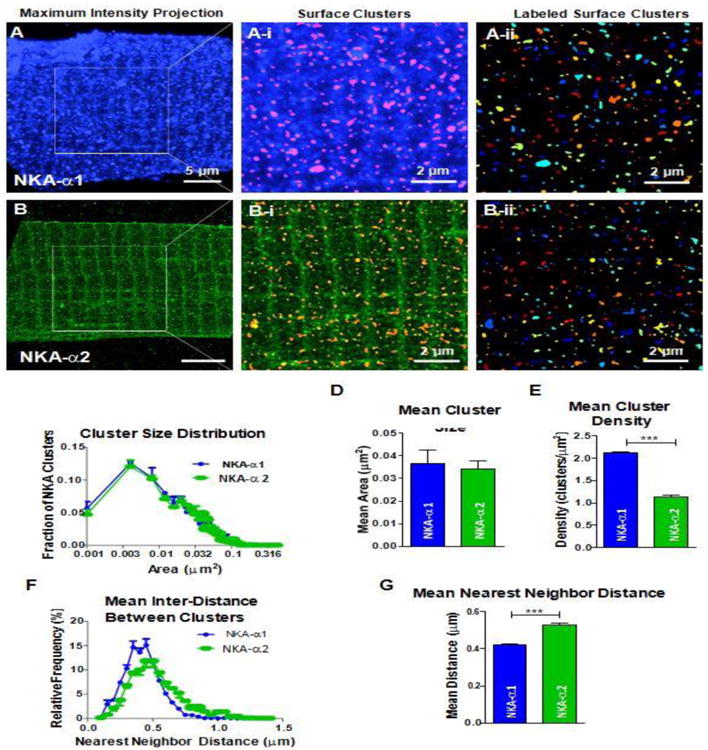
SSL of myocytes stained with NKA-α1 and α2 were isolated from the stack of STED images by isolating a 0.66 μm thick outer myocyte surface shell through image segmentation and edge detection techniques. A B: Maximum intensity projections of NKA-α1 (A) and NKA-α2 (B). A-i, B-i: Identification of SSL clusters from 0.66 μm thick outer surface; scale bars are 2 μm. Any clusters identified beyond 0.66 μm from SSL of the myocyte were excluded. Aii, B-ii: Individual NKA-α1 and α2 clusters, separated by contrasting colors; scale bars are 2 μm. Individual clusters are distinguished by differentiating colors. α1 SSL clusters are more densely distributed than α2 SSL clusters. C: Cluster size distribution histogram of α1 (blue) and α2 (green). Cluster sizes of α1 and α2 have the same mode (0.004 μm2) and distribution patterns. D: Mean area of α1 and α2 clusters. Mean area between α1 and α2 are not significantly different (0.037 vs. 0.034 μm2). E: Density of clusters. α1 clusters are nearly twice as dense as α2 clusters (2.11 vs. 1.14 clusters/μm2). F: Cluster nearest neighbor distance distribution histogram of α1 and α2. The mode for α1 nearest neighbor is smaller than that of α2 (0.45 vs 0.5 μm) and α2 possesses a larger right tail, signifying a higher proportion of larger distances. G: Mean nearest neighbor distance between α1 and α2. α1 has a significantly shorter mean nearest neighbor distance than α2 (0.42 vs. 0.53 μm) clearly indicating a higher density of α1 clusters at the SSL. (n = 3 cells, statistical analysis; t-test)
Cluster identification and analysis showed that SSL localized α1 clusters are similar to α2 clusters in terms of distribution of cluster size (Figure 2C) and mean size ∼0.038 μm2 (Figure 2D). There was a much higher density of α1 vs. α2 clusters (per μm2; Figure 2E), consistent with data showing α1 as the predominant SSL isoform it cardiac myocytes [9-11]. The lower number of α2 clusters also results in a larger neighbor-to-neighbor distance between α2 clusters vs. α1 clusters, based either on distribution analysis or simply the mean nearest neighbor distance (Figure 2F-G). Initial analysis of co-localization between α1 and α2, did not show anything striking, and the relative paucity of co-localization is consistent with the isoform selectivity of the antibodies used (Suppl Figure S1).
α1 and α2 Localization at Longitudinal vs. transverse TT domains (STED)
Next, we peeled off the 0.66 μm surface layer that was analyzed in Figure 2, resulting in strikingly different intracellular patterns for α1 and α2 distributions (Figure 3). The 3D reconstructed z-stack STED images of NKA-α1 shows an intricate internal network of transverse as well as longitudinal TT components (Figure 3A). These longitudinal tubules are perpendicular to and appear to connect adjacent TTs. Prior work has shown that up to 40% of the TT system is in such longitudinal components [25]. While some of the longitudinal tubules run the length of the myocyte and others connect only a pair of T-tubules, α1 is present in both TT components at similar apparent intensity.
Figure 3. T-Tubular network distribution of NKA isoforms.
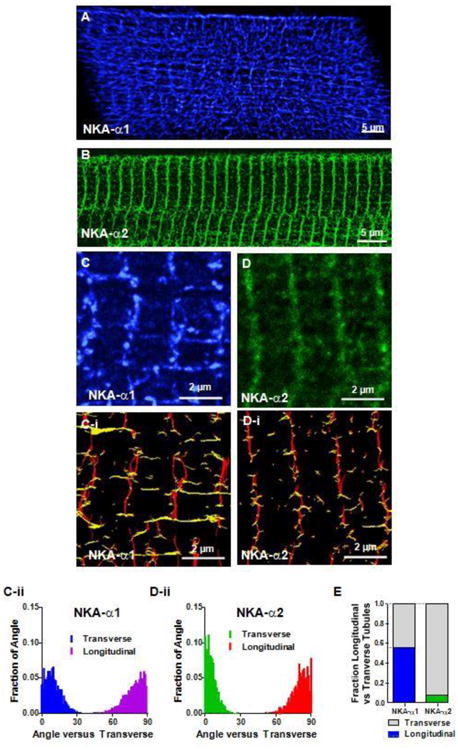
The TT network was revealed in stacks of STED images by removing the 0.66 μm thick outer SSL surface shell (converse of Figure 2A-B). A B: NKA-α1 and NKA-α2 fluorescence signal from inner TT structures, respectively. 3D reconstructions by volume rendering (with an adapted opacity transfer function) showing α1 presence throughout this intricate tubular network (A), while α2 is mainly in the transverse direction (B). C, D: Maximum intensity projections of slabs of TT network show that α1 (3 μm thick) contains multiple longitudinal elements spanning multiple TTs while α2 (1.1 μm thick) is more exclusively in the transverse elements. C-i, D-i: Orientation analysis based on Riesz transform representations (of C and D) categorizing cluster segments as either transverse (red) or longitudinal (yellow). C-ii, D-ii: Length and orientation of each segment were measured in C-i, D-I, and the fractions of segments at each angle versus transverse (regardless the segment length). Each distribution totals 1 (Transverse or Longitudinal); n = 3 cells. E: Orientation of segments with length > 0.6 μm, showing predominantly transverse orientation for α2 and nearly equal amounts longitudinal and transverse for α1. (n = 3 cells.
NKA α2 localization was strikingly different (Figure 3B), being much more concentrated in the strictly transverse TT components, with very little in the longitudinal tubule network. This major difference in NKA α1 vs. α2 distribution that is visible in full z-stacks is also clear in thinner section (0.256 μm deep) enlargements spanning 3-4 sarcomeres (Figure 3C, D).
To analyze this quantitatively, we applied a Riesz transform to reveal the orientation of the clusters (Figure 3C-i, D-i) and categorized cluster segments as predominantly transverse (red) vs. longitudinal (yellow). It can be seen that both α1 and α2 are clearly present transversely, but that only α1 shows prominent longitudinal components. In contrast, the longitudinal α2 elements that are apparent are far more rudimentary.
We also measured the mean orientation angles of each segment connecting 2 nearest neighbor clusters (at >250 nm length, Suppl Figure S4) with respect to transverse orientation (θ=0°). The all-cluster-pair histograms (Figure 3C-ii, D-ii) are corrected for the intrinsic problem that any individual cluster pair could have a main orientation angle that is nearly random, even if they are along the same slightly wiggly Z-line. This amounts to removing a small (<10%) baseline in Figures 3C-ii and D-ii. To further preclude this nearest-neighbor angular noise, for Figure 3E we only used segments of at least 600 nm, where there were at least 3 clusters. For α2, 92% are transversely oriented (θ<30°) compared to 8% in the longitudinal direction (θ>60°). There are still some longitudinal α2 components, but these are fewer (Figure 3E), and these are also typically shorter in length (Suppl Figure S4). In contrast, for α1 cluster orientation (vs. α2), the percent transverse is smaller and longitudinal is greater, with similar numbers longitudinal (θ>60°) and transverse (θ<30°). Overall, 56% of α1 clusters were longitudinally oriented, vs. 8% for α2 (Figure 3E). This unbiased analysis confirms the striking visual difference in NKA-α1 vs. α2 organization, where α2 appears confined primarily to transverse TT elements, whereas α1 is equally likely to be in longitudinal vs. transverse components.
Subsurface TT concentration of NKA-α2
In analyzing α1 and α2 STED images, we noticed what might be a higher α2 concentration, just below the outer sarcolemmal shell. An example suggesting this is shown in single x-y plane STED images, with higher resolution than available in the z-axis. Figure 4 is a thin slice (0.256 μm thick in z-axis direction) about halfway up the myocyte, where the lateral edges are typically the most vertically oriented. That means that the SSL above and below that plane are best in-register. We analyzed the highlighted region of this transverse slab including 4 TT (Figure 4A B). Figure 4C shows intensity profiles along the transverse slice, normalized to the minimum fluorescence at mid-sarcomere between TT (i.e. where no sarcolemma or NKA is expected). The maximum fluorescence marks the cell surface (x=0) and the amplitude is also normalized so that both α1 and α2 signals both vary between 0 and 1. For α1, this line plot is relatively flat inside the myocyte, except at identifiable longitudinal TT that cross this field (at ∼1.4, 4.4 and 5.9 μm). In contrast, α2 exhibits a hump centered near 0.8 μm from the surface peak and gradually declines deeper into the myocyte. Averaging the subsurface region (defined as the region 0.45-1 μm away from the cell surface) from three cells, there tends to be relatively higher α2 signal than α1 signal at the subsurface region (Figure 4D).
Figure 4. NKA isoform transverse profiles.
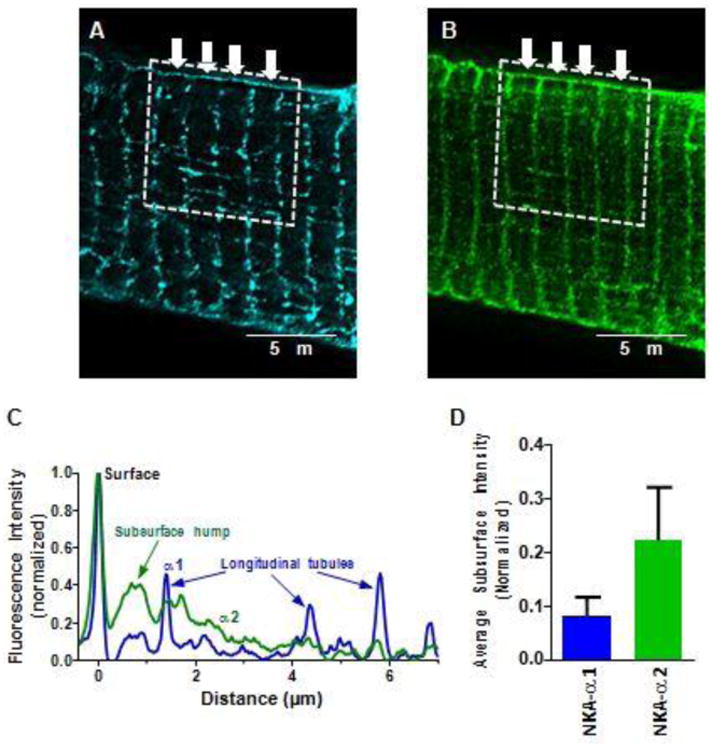
Transverse profiles of NKA in STED microscopy. Single plane images co-stained for NKA-α1 and α2. A B: Representative images of α1 (A) and α2 (B). Sections of 4-5 sarcomeres, roughly 8 μm in length in the transverse direction were quantified (dotted box). Fluorescent signal from each sarcomere (arrows), were averaged to create transverse fluorescent intensity plot profiles. C: Representative average fluorescent intensities. Minimum average fluorescence was subtracted from each point and amplitude normalized to peak SSL intensity. Peak at x=0 is the cell surface, and lower peaks in α1 trace are from identifiable longitudinal tubules. Just beneath the SSL, α2 signal is enriched. D: Quantification of α1 and α2 fluorescence Sub-SSL signal (from the region 0.45-1 μm inside the cell surface), normalized to peak SSL intensity. (n = 3 cells)
These individual transverse slices provided the impetus for a more systematic analysis to test whether a subsurface microdomain of α2 concentration is present throughout the myocyte. For this we looked at the outer SSL shell (0.9 μm thick) vs. the next subsurface shell 0.9 μm depth through segmentation of the 3D STED super-resolution images and compared the isoform signals (Figure 5A). The left panels show axial views of the regions probed, the middle panels show the fluorescence in that same view, and the right panels show a 90° rotation around the x-axis, providing a bottom surface view. For α1, the subsurface shell appears similar to the surface shell, whereas for α2, the subsurface is brighter than the surface. This can be seen quantitatively when we measured the average fluorescence for each shell at different distances up from the myocyte bottom (Figure 5B). For α1, the average fluorescence (normalized to the peak of the surface shell) was similar in both shells, whereas the α2 subsurface signal was always higher than the surface signal (Figure 5C). Overall, for α1, there was no difference between Surface and Sub-surface density, whereas for α2 the Sub-surface density was higher than on the Surface (Figure 5D).
Figure 5. Distribution of NKA isoforms at subsurface.
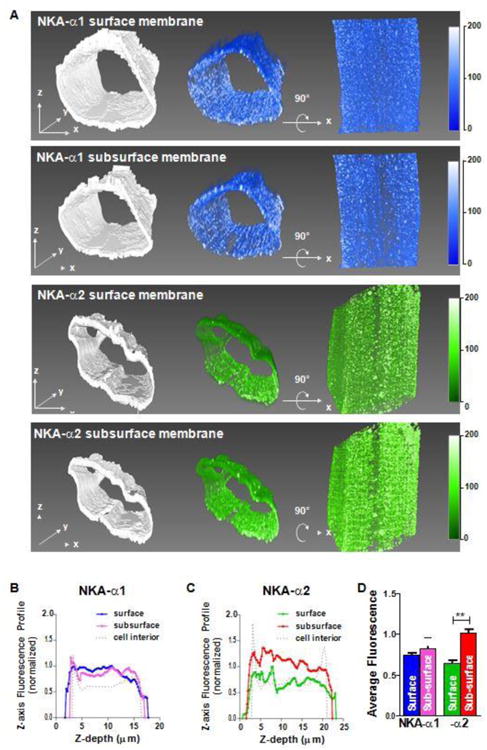
Myocyte surface shell and subsurface shells (0.9 μm thick) were segmented from STED image stacks. A Top row is NKA-α1 SSL shell with binary mask for segmentation (left), corresponding volume rendering of fluorescence (middle) and the same volume rotated 90° around the x-axis (right). Second row is NKA-α1 Sub-SSL with the same layout as the previous row. Last two rows show NKA-α2 SSL and subsurface, respectively. All volumes were rendered with the same opacity transfer function for consistency in fluorescence intensity scale. B, C: Shell fluorescence profiles for α1 (B) and α2 (C) with respect to distance above the bottom surface (normalized to peak surface intensity). Signal attenuation from light scattering and absorption with increasing depth was not corrected. Surface and Sub-subsurface signal are similar for α1, but for α2 Sub-surface is higher than Surface. D: Average fluorescence signals for α1 and α2. (n = 3 cells; statistical analysis: t-test)
Since this subsurface domain is hard to truly exclude from the SSL shell, this might cause us to underestimate both α1 predominance on the SSL and the relative TT concentration of α2, compared to prior functional studies. This TT neck region is also where microfolds and BIN1 protein are known to be localized [30, 31], factors might contribute to a relative concentration of NKA-α2 in this region.
STORM imaging of NKA-α1, NKA-α2 and RyR2
The strong transverse orientation of NKA-α2 in the TT network brings us to directly test the hypothesis that α2 is preferentially anchored at SR junctions where RyR2 resides. We turned to STORM imaging, which offers potentially higher spatial resolution than STED, to measure proximity of NKA-α1 vs. α2 to RyR2 in the junctional SR. Adult mouse ventricular cardiac myocytes were stained with α1, α2, and RyR2 antibodies and protein localization was observed. Figure 6AF shows confocal images of α1, α2, and RyR2 immunostaining in isolated mouse ventricular cardiac myocytes, with z-line localization for all three probes. The confocal images show that RyR2 localization seems sharpest in the expected transverse stripes (Figure 6F), and that NKA-α1 and α2 exhibit strong staining within z-lines with occasional extensions in the longitudinal direction (especially for α1; Figure 6D, E) as seen with STED imaging in Figure 3.
Figure 6. NKA and RyR2 STORM vs. confocal images.
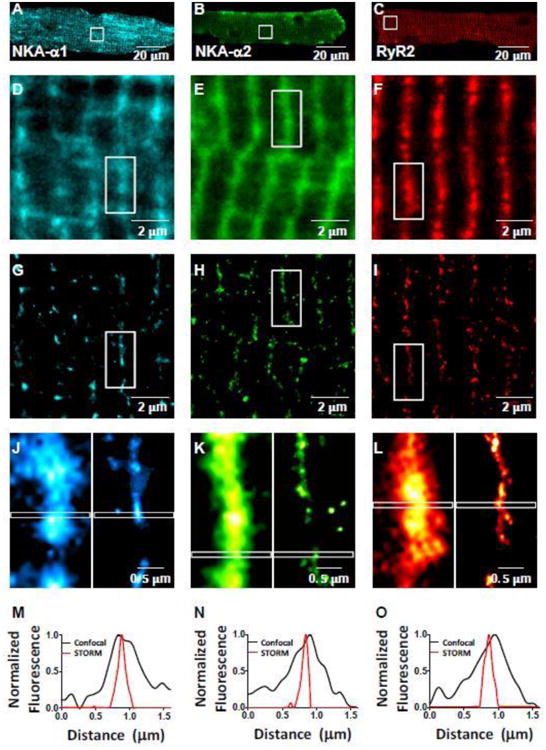
A-C: Myocyte confocal images of α1 (Alexa Fluor 647) (A), α2 (Alexa Fluor 647) (B), and RyR2 (Alexa Fluor 568) (C) in mouse cardiac myocyte. D-I: Enlarged views of the box regions in A-C in confocal (D-F) and STORM (G-I) microscopy. J-L: Enlarged views of the box regions in D-I of individual z-lines (confocal left, STORM right). M-O: Plot profile of indicated regions of 1.6 μm long by 0.1 μm wide in (J-L); normalized to maximum intensity within plot profile. FWHM for STORM images were 21-26% of that in confocal images.
The same regions were also subjected to super-resolution STORM imaging, showing sharper individual clusters of α1, α2, and RyR2 TT structure (Figure 6G-I) vs. confocal microscopy (Figure 6D-F). Figures 6J-L compare confocal vs. STORM images from the same myocyte regions, which emphasizes this enhanced sharpness. The confocal signals at the T-tubule are generally continuous along the length of the T-tubules, with occasional gaps. With STORM, the fluorescent signal at the T-tubule is resolved into small clusters of signal that are aligned primarily along the T-tubules. Indeed, individual T-tubules show much higher detail and narrower width at the T-tubule with STORM. Plot profiles along the longitudinal scale of a sarcomere (1.6 μm) with 0.1 μm width show that the full width at half maximum (FWHM) of the apparent T-tubule is 75-80% narrower with STORM imaging than confocal imaging (approximately 0.2 μm as expected; Figure 6M-O).
NKA-α1 vs. α2 clusters visualized in STORM imaging
Individual protein clusters and their peak intensity centroids are identified based on the stochastic individual blinking events that characterize single molecule microscopy. Raw STORM images are reconstructed based the Gaussian distributions of single molecule blinking events (Figure 7A). The raw STORM reconstructions are then thresholded based on intensity (90 percentile) and size (>25 nm2) to eliminate cellular autofluorescence (Figure 7B). The subtracted background is shown in Figure 7C, with brightness in the top left quadrant artificially increased 3-fold. Here, the brightened quadrant shows the lack of structural organization of the background signal (vs. the organized cell structure in Figure 7B), as well as the dimness of the background in the other 3 quadrants (vs. Figure 7B). Individual protein clusters and their peak intensity centroids (Figure 7D and 7E, respectively) are based on the Gaussian distribution of the fluorescent blink positions. A key advantage of this approach is that in regions of high protein aggregation (many at the T-tubule regions), these regions can be separated into individual adjacent clusters (Figure 7D). This cluster separation allows for a more detailed analysis of the proteins clusters, which is needed for characterizing α1 and α2 cluster localization and proximity to RyR2 clusters.
Figure 7. NKA cluster characteristics in STORM images.
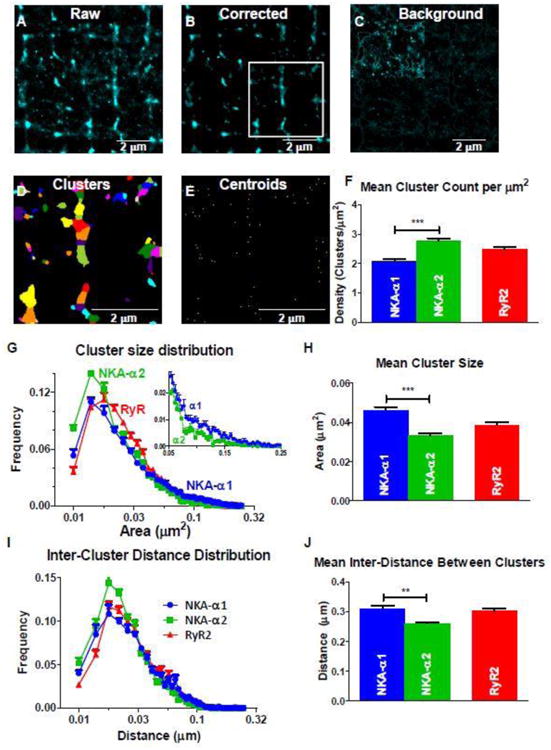
A-C: Raw (A) and corrected (B) STORM RyR2 (Alexa Fluor 568) reconstructed image based on blinks from 10,000 frames, and the subtracted background image (C) used for correction. Background signal included points with less than 90 percentile of fluorescent intensity and cluster size (>25 nm2). Upper left quadrant in C is increased 3-fold in intensity to better visualize the lack of structural organization in the background signal. D: Corrected Image with individual STORM clusters identified (by color). Clusters are identified based on peak intensity values with Gaussian distributions (or centroids) indicated in E). Each centroid corresponds to an individual cluster in panel D. F: density (per μm2) of α1, α2, and RyR2 clusters in the TT region. G, H: Cluster size frequency histogram (G) shows similar modes between (near 0.014 μm2) for α1, α2, and RyR2, but mean cluster size for α1 is larger than for α2 (H). Inset in G shows a slightly larger distribution of larger clusters in α1. I, J: Inter-cluster distance (between centroids) frequency histogram (I) and mean values (J) for α1, α2, and RyR2 clusters. Modes for α1 and α2 were identical (0.018 μm), but for α1 more long distances contribute to a larger mean value. (n = 11 (α1), 9 (α2), and 20 (RyR2) cells; statistical analysis: t-test)
NKA-α1 and α2 clusters differ in the number of clusters per μm2 (density), cluster size, and inter-cluster distance (Figure 7F-J). The mean size of NKA-α1 clusters are larger than those for α2 (0.046 vs. 0.033 μm2; (Figure 7H). While the frequency distribution of NKA-α1 and α2 cluster sizes (Figure 7G) are similar in shape and mode, α2 has a higher frequency of clusters that are smaller than the mode, whereas α1 has a larger proportion of larger clusters, extending through the long distribution tail (see Figure 7G inset). The overall density of α2 clusters is 34% higher than α1 (2.78 vs. 2.08 α1 clusters/μm2), while the mean inter-distance between α2 clusters is slightly smaller vs. for α1 (0.26 vs. 0.31 μm; Figure 7I, J). The inverse relationship between cluster density and the inter-cluster distance is expected.
NKA-α1 and α2 localization with respect to RyR2
RyR2 clusters were also identified and analyzed in Figure 7, like the NKA isoforms. To determine if NKA-α2 vs. α1 is preferentially located near RyR2, mouse ventricular myocytes were examined with RyR2 plus either α1 or α2 labeled (Figure 8A, B). STORM images confirm that both NKA isoforms localize at z-lines near RyR2, but further quantitative analysis is required to determine differences between the two isoforms. To quantify the spatial relationship between NKA isoforms and RyR2, NKA clusters within a 200 nm radius of each RyR2 cluster were analyzed (the width of a T-tubule or junctional couplon).
Figure 8. T-Tubular NKA isoform localization near RyR2.
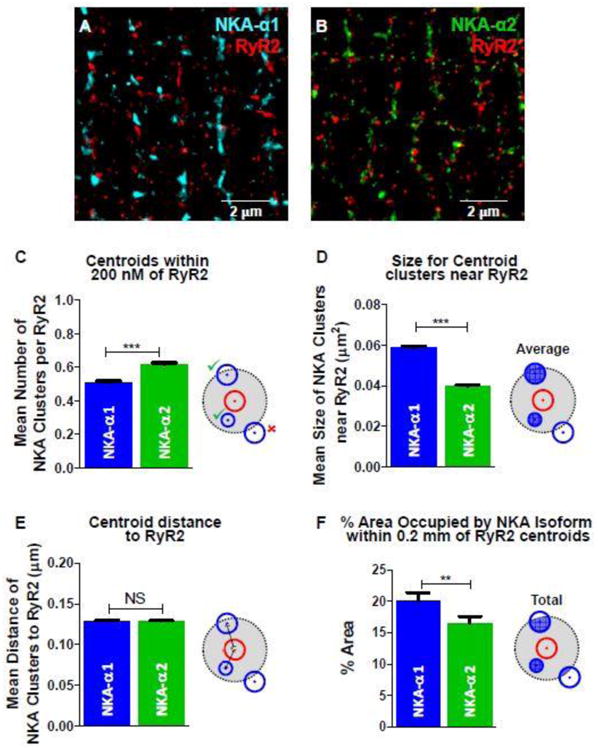
A: STORM image of NKA-α1 (Alexa Fluor 647; blue) and RyR2 (Alexa Fluor 568; red). B: STORM image of NKA-α2 (Alexa Fluor 647; green) and RyR2 (Alexa Fluor 568; red). C: Mean number of NKA isoform cluster centroids within 0.2 μm radius of each RyR2 cluster centroid (illustration of analysis criteria at right). D: Mean size of NKA isoform clusters whose centroids are within 0.2 μm radius of the RyR2 cluster centroid. E: Mean distance between RyR2-NKA cluster centroids within 0.2 μm radius of RyR2 clusters (0.13 μm for both). F: Mean total area of NKA cluster within 0.2 μm radius of RyR2 clusters, as percentage the total 0.2 μm radius circle. This area includes portions of any NKA clusters within 0.2 μm radius of RyR2 clusters. (n = 11 (α1), 9 (α2), and 20 (RyR2) cells; statistical analysis: t-test)
The number of clusters near RyR2, defined by NKA clusters with their peak intensity centroids within the 200 nm radius, were counted (Figure 8C). For each RyR2 cluster, the mean number of NKA-α2 cluster centroids within a 200 nm radius was 22% higher for α2 vs. α1 (0.62 vs. 0.51; Figure 8C). However, the mean cluster size was 32% smaller for these more numerous α2 clusters (0.040 vs. 0.059 μm2; Figure 8D), negating the apparent α2 proximity. Moreover, the 22% higher α2 vs. α1 centroids near RyR2 is, if anything, lower than the overall 34% higher density of α1 (independent of RyR2 location; Figure 7F). Comparing the mean distance from RyR2 centroid to NKA centroid failed to show any difference for the NKA isoforms (Figure 8E). Moreover, if we only count the NKA cluster area within 200nm of RyR2 centroids, then the apparent amount of NKA-α2 that falls within this 200 nm radius is significantly less than for α1 (Figure 8F). For each RyR2 cluster, 20% of the 200 nm radius is occupied by α1 clusters while 16.5% is occupied by α2 clusters, producing a α1 to α2 ratio of 1.21 (Figure 8F). The average distance from the RyR2 centroid to the nearest NKA centroid was identical (0.13 μm) for both α1 and α2 (from Figure 8C analysis). To be sure that we were not missing something by constraining the analysis to a 200 nm radius of the RyR2 centroid, we also extended the analysis in Figure 8C-F to different radii (Suppl Figure S5), with similar conclusions. These results lead us to conclude that there is no preferential localization of α2 near RyR2 at the junctional cleft, and that our hypothesis was incorrect.
Discussion
In this study, we measured the distribution patterns of the NKAα1 and α2 isoforms in mouse ventricular myocytes using two super-resolution microscopic methods (STED and STORM). We confirmed prior work that had demonstrated higher NKA-α2 density in TT vs. SSL, but more regional uniformity in the density of the NKA-α1 isoform [9-11]. We also discovered several novel features that were particularly enabled by STED and STORM imaging: 1) At the outer sarcolemma NKA has no striking structural organization for either α1 or α2; 2) in the TT system NKA-α2 is almost entirely localized to the transverse elements, whereas α1 is similarly prominent in both transverse and longitudinal TT elements Figure 9A 3) NKA-α2 may exhibit some preferential localization just below the TT opening near the SSL; 4) within TT junctional RyR2 sites are not in preferential proximity to NKA-α2 vs. aα1. The latter point appears to dispel the attractive hypothesis that it is selective cleft localization that drives the much higher concentration of NKA-α2 in TT [18, 28] (Figure 9A).
Figure 9. NKA isoform distribution in mouse ventricular myocytes.
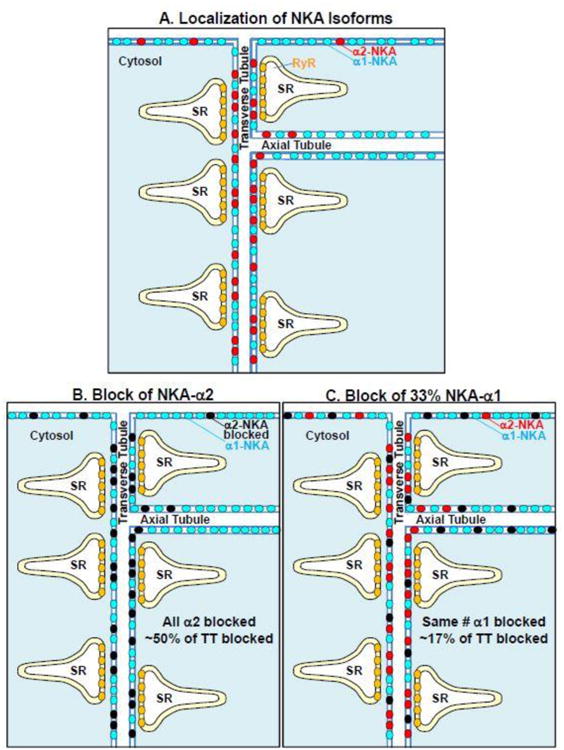
A: This cartoon illustrates the structural conclusions that NKA-α1 (blue circles) is relatively uniform along the entire sarcolemma (surface as well transverse and axial TT components), whereas NKA-α2 (red circles) is especially concentrated in the transverse TT components. B: Blocking all of the NKA-α2 (black circles) would suppress total NKA transport by ∼50% in TT, with limited impact on transport in surface or longitudinal (axial) TT regions. C: Conversely, blocking 33% of NKA-α1 would suppress total NKA transport by nearly 33% at the surface and axial TT regions, but only by ∼17% in the transverse TT region.
T-tubular vs. Surface Sarcolemmal NKA expression
Prior NKA pump current measurements have shown that NKA-α2 is 4-6 fold more concentrated in rodent TT vs. SSL, whereas α1 is similarly extant in both sarcolemmal regions [9-11]. Since α1 also represents 71-89% of total NKA in rodents, we would expect ∼10-fold higher NKA-α1 vs. α2 on the myocyte surface. Our measure of more than twice as many α1 vs. α2 surface clusters (of similar size; Figure 2E) might underestimate this difference for two reasons. First, the α1and α2 antibodies may have different labeling efficacies (as saturation of NKA sites or extent of fluorescence labeling). Second, any bleed-through of signal from the Sub-surface, where α2 is more concentrated, would raise the apparent α2 clusters counted (especially if α2 is especially high near the TT mouth). These issues may affect less electrophysiology-based estimates in detubulated ventricular myocytes, so we suspect the actual SSL α2/α1 ratio is closer to 10 than 2.
In transverse TT, there were slightly fewer α1 vs. α2 clusters, but the α1 cluster sizes were larger (Figure 7F-H), yielding similar amounts of α1 and α2 signal at that location. That is consistent with similar amounts of each isoform in the TT, but accounting for the longitudinal TT elements that contain predominantly α1, the overall TT signal is stronger for α1. This again agrees qualitatively with the prior NKA pump current data, where α1-dependent current was higher than that for α2 [9-11]. In rodent skeletal muscle, where NKA-α2 is the predominant overall isoform, the α2 is highly concentrated in TTs vs. SSL, where nearly all of the TT NKA is α2 [14, 15]. Indeed, in skeletal muscle α1 seems responsible for bulk [Na+]i homeostasis while α2 is more involved with contractile activity [13-17].
NKA in Transverse vs. Longitudinal TT elements
Soeller and Cannell [25] showed that the TT system includes extensive longitudinal branching, such that only about 60% of the TT system was really oriented in the transverse direction. Figure 3 demonstrates a striking difference in NKA isoform localization within the TT network. Whereas α2 was highly concentrated in the transverse elements, it was largely excluded from the longitudinal TT elements. In contrast NKA-α1 appeared more uniformly distributed throughout both elements of the TT system. The α2 isoform was not exclusively transverse, but the images give the impression that only small amounts of α2 can escape the transverse elements to appear in longitudinal elements near the transverse branches. These results suggest that NKA-α2 is preferentially anchored (vs. α1) in transverse TT elements. This might be in part mediated by ankyrin-B, based on work by Mohler et al. [32] which found NKA and ankyrin-B in TT. They also reported that NKA and ankyrin-B interacted, and that there was a loss of NKA-α2 as well as ankyrin-B in TT in mice heterozygous for ankyrin-B.
Possible subsurface NKA-α2 concentration in TT
Since 40% of the transverse TT membrane is involved in SR junctions, this was still consistent with our junctional α2 localization hypothesis. However, we also noticed a slight increase in α2 localization (vs. α1) roughly 0.5-1 μm from the surface, near the external mouth of the TT (Figure 4-5). Our data are somewhat equivocal here, but intriguing because a similar location has been described for sarcolemmal microfolds rich in BIN1 protein [30, 31]. This raises possible molecular explanations for our observations. However, further studies would be required to test the possibly of this α2-rich locus, as well as its correspondence to BIN1-rich membrane microfolds.
Localization of NKA in proximity of RyR2
The attractiveness of our initial hypothesis that α2 preferentially concentrates (and may be anchored) at junctional TT domains, resulted in some surprise when the data (Figure 8) pointed so clearly against our hypothesis. Indeed, the fact that 40% of the TT is associated in SR junctions seemed to provide an ideal geometric setting for STORM-based discrimination of whether α2 was preferentially close to RyR2 centroids (with α1 being potentially excluded from those loci). Moreover, in confocal images RyR2 striations are nearly continuous (Figure 6D-F) which would preclude this sort of discrimination. However, the STORM results seem compelling (e.g. both α1 and α2 clusters are on average precisely 0.13 μm from RyR2; Figure 8E), and cause us to reject our central hypothesis. So, while NKA-α2 is targeted to TT, and their transverse components in particular, we do not have evidence for either junctional targeting of α2 or exclusion of α1. On the other hand, the higher α2 expression in TT still enhances the overall NKA concentration in the transverse TT elements, above that in either the SSL or longitudinal TT elements.
Functional consequences of NKA isoform distribution
So how does this new knowledge change our thinking about the functional consequences of NKA isoform localization? It was attractive to think that having all of the key Na+ and Ca2+ transporters and channels focused at the tiny cleft volume (∼5 × 10⁻⁵ pL), such that elevation of local cleft [Na+]i (e.g. by selective NKA-α2 inhibition) could raise local cleft [Ca2+]i via NCX to promote stronger SR Ca2+ release and inotropy, as was suggested by some prior data [11, 18]. But if we consider this notion in more detail, and armed with our present results, that picture needs revision. We should consider that Na+ diffusion inside myocytes is quite fast [33], even in the submembrane space near Na+ channels and NCX [34], so that any local [Na+]i increase will spread rapidly to nearby submembrane regions surrounding the cleft. Nevertheless, selective NKA-α2 blockade can increase Ca2+ transients and contraction without altering global [Na+]i [11]. We conclude that the overall TT concentration of α2 suffices for this functional effect, without constraining all of the proteins and local [Na+]i and [Ca2+]i changes to the junctional cleft space.
One may well ask why blocking a similar total amount of NKA by partial α1 inhibition did not produce the same inotropic effect as blocking nearly all NKA-α2 (20% of total NKA in both cases) [18]? The explanation, illustrated in Figure 9B-C, may be that blocking ∼33% of α1 will inhibit Na+ efflux nearly 33% at the SSL and longitudinal TT (allowing a small rise in global [Na+ [i), but the TTs (near RyR junctions) experience only ∼17% NKA inhibition (due to unblocked α2 in TT, which is about half of the total TT NKA). This would limit the inotropic effect of partial α1 block. The opposite is true for the α2-selective block, which blocks ∼50% of the TT NKA, but very little of the SSL or longitudinal TT NKA. Thus for the same rise in global [Na+]i, the α2 block impact will be strongest in the TT-SR junction region, and so on contraction.
The novel aspects of NKA isoform distribution in ventricular myocytes borne through super-resolution microscopy described here, provides a clearer picture of how differential NKA localization can serve different functions, and may be part of different local protein and signaling complexes. The direct test, and refutation of a popular cleft-localization hypothesis also provides new physical constraints on exactly these same systems.
Supplementary Material
Higlights.
STED and STORM imaging confirms prior work showing higher NKA-α2 density in T- tubules (TT) vs. surface sarcolemma (SSL), but more uniformity for NKA-α1.
NKA-α2 is localized to transverse TT elements, while α1 is in both transverse and longitudinal TT elements.
NKA-α2 may be more concentrated just below the TT openings near the SSL.
Ryanodine receptor clusters are not closer to NKA-α2 vs. α1 (dispelling a prior hypothesis).
Acknowledgments
We would like to thank Dr. Kimberley McAllister for generous access to STORM instrumentation, Dr. Ingrid Brust-Mascher for technical assistance with STED microscopy, and Max Bergman and Logan Bailey for myocyte preparation.
This work was supported in part through NIH grants (R01-HL081562 and R01-HL030077) and the NIH Training Program in Basic and Translational Cardiovascular Science (T32 HL086350).
Footnotes
Publisher's Disclaimer: This is a PDF file of an unedited manuscript that has been accepted for publication. As a service to our customers we are providing this early version of the manuscript. The manuscript will undergo copyediting, typesetting, and review of the resulting proof before it is published in its final citable form. Please note that during the production process errors may be discovered which could affect the content, and all legal disclaimers that apply to the journal pertain.
References
- 1.Shull GE, Schwartz A, Lingrel JB. Amino-acid sequence of the catalytic subunit of the (Na+ + K+)ATPase deduced from a complementary DNA. Nature. 1985;316(6030):691–5. doi: 10.1038/316691a0. [DOI] [PubMed] [Google Scholar]
- 2.Sweadner KJ. Isozymes of the Na+/K+-ATPase. Biochim Biophys Acta. 1989;988(2):185–220. doi: 10.1016/0304-4157(89)90019-1. [DOI] [PubMed] [Google Scholar]
- 3.Lingrel JB, Kuntzweiler T. Na+,K+-ATPase. J Biol Chem. 1994;269(31):19659–62. [PubMed] [Google Scholar]
- 4.Blanco G, Mercer RW. Isozymes of the Na-K-ATPase: heterogeneity in structure, diversity in function. Am J Physiol. 1998;275(5 Pt 2):F633–50. doi: 10.1152/ajprenal.1998.275.5.F633. [DOI] [PubMed] [Google Scholar]
- 5.Stanley CM, Gagnon DG, Bernal A, Meyer DJ, Rosenthal JJ, Artigas P. Importance of the Voltage Dependence of Cardiac Na/K ATPase Isozymes. Biophys J. 2015;109(9):1852–62. doi: 10.1016/j.bpj.2015.09.015. [DOI] [PMC free article] [PubMed] [Google Scholar]
- 6.Zahler R, Gilmore-Hebert M, Baldwin JC, Franco K, Benz EJ., Jr Expression of alpha isoforms of the Na,K-ATPase in human heart. Biochim Biophys Acta. 1993;1149(2):189–94. doi: 10.1016/0005-2736(93)90200-j. [DOI] [PubMed] [Google Scholar]
- 7.Lucchesi PA, Sweadner KJ. Postnatal changes in Na,K-ATPase isoform expression in rat cardiac ventricle. Conservation of biphasic ouabain affinity. J Biol Chem. 1991;266(14):9327–31. [PubMed] [Google Scholar]
- 8.Dostanic I, Lorenz JN, Schultz Jel J, Grupp IL, Neumann JC, Wani MA, Lingrel JB. The alpha2 isoform of Na,K-ATPase mediates ouabain-induced cardiac inotropy in mice. J Biol Chem. 2003;278(52):53026–34. doi: 10.1074/jbc.M308547200. [DOI] [PubMed] [Google Scholar]
- 9.Despa S, Bers DM. Functional analysis of Na+/K+-ATPase isoform distribution in rat ventricular myocytes. Am J Physiol Cell Physiol. 2007;293(1):C321–7. doi: 10.1152/ajpcell.00597.2006. [DOI] [PubMed] [Google Scholar]
- 10.Berry RG, Despa S, Fuller W, Bers DM, Shattock MJ. Differential distribution and regulation of mouse cardiac Na+/K+-ATPase alpha1 and alpha2 subunits in T -tubule and surface sarcolemmal membranes. Cardiovasc Res. 2007;73(1):92–100. doi: 10.1016/j.cardiores.2006.11.006. [DOI] [PubMed] [Google Scholar]
- 11.Swift F, Tovsrud N, Enger UH, Sjaastad I, Sejersted OM. The Na+/K+-ATPase alpha2-isoform regulates cardiac contractility in rat cardiomyocytes. Cardiovasc Res. 2007;75(1):109–17. doi: 10.1016/j.cardiores.2007.03.017. [DOI] [PubMed] [Google Scholar]
- 12.Despa S, Brette F, Orchard CH, Bers DM. Na/Ca exchange and Na/K-ATPase function are equally concentrated in transverse tubules of rat ventricular myocytes. Biophys J. 2003;85(5):3388–96. doi: 10.1016/S0006-3495(03)74758-4. [DOI] [PMC free article] [PubMed] [Google Scholar]
- 13.He S, Shelly DA, Moseley AE, James PF, James JH, Paul RJ, Lingrel JB. The alpha(1)- and alpha(2)-isoforms of Na-K-ATPase play different roles in skeletal muscle contractility. Am J Physiol Regul Integr Comp Physiol. 2001;281(3):R917–25. doi: 10.1152/ajpregu.2001.281.3.R917. [DOI] [PubMed] [Google Scholar]
- 14.Hundal HS, Maxwell DL, Ahmed A, Darakhshan F, Mitsumoto Y, Klip A. Subcellular distribution and immunocytochemical localization of Na,K-ATPase subunit isoforms in human skeletal muscle. Mol Membr Biol. 1994;11(4):255–62. doi: 10.3109/09687689409160435. [DOI] [PubMed] [Google Scholar]
- 15.Kristensen M, Rasmussen MK, Juel C. Na(+)-K (+) pump location and translocation during muscle contraction in rat skeletal muscle. Pflugers Arch. 2008;456(5):979–89. doi: 10.1007/s00424-008-0449-x. [DOI] [PubMed] [Google Scholar]
- 16.Radzyukevich TL, Moseley AE, Shelly DA, Redden GA, Behbehani MM, Lingrel JB, Paul RJ, Heiny JA. The Na+-K+-ATPase alpha2-subunit isoform modulates contractility in the perinatal mouse diaphragm. Am J Physiol Cell Physiol. 2004;287(5):C1300–10. doi: 10.1152/ajpcell.00231.2004. [DOI] [PubMed] [Google Scholar]
- 17.Yuan X, Lin Z, Luo S, Ji G, Yuan C, Wu Y. Effects of different magnitudes of cyclic stretch on Na+-K+-ATPase in skeletal muscle cells in vitro. J Cell Physiol. 2007;212(2):509–18. doi: 10.1002/jcp.21047. [DOI] [PubMed] [Google Scholar]
- 18.Despa S, Lingrel JB, Bers DM. Na+/K+-ATPase alpha2-isoform preferentially modulates Ca2+ transients and sarcoplasmic reticulum Ca2+ release in cardiac myocytes. Cardiovasc Res. 2012;95(4):480–6. doi: 10.1093/cvr/cvs213. [DOI] [PMC free article] [PubMed] [Google Scholar]
- 19.James PF, Grupp IL, Grupp G, Woo AL, Askew GR, Croyle ML, Walsh RA, Lingrel JB. Identification of a specific role for the Na,K-ATPase alpha 2 isoform as a regulator of calcium in the heart. Mol Cell. 1999;3(5):555–63. doi: 10.1016/s1097-2765(00)80349-4. [DOI] [PubMed] [Google Scholar]
- 20.Dostanic I, Schultz Jel J, Lorenz JN, Lingrel JB. The alpha 1 isoform of Na,K-ATPase regulates cardiac contractility and functionally interacts and co-localizes with the Na/Ca exchanger in heart. J Biol Chem. 2004;279(52):54053–61. doi: 10.1074/jbc.M410737200. [DOI] [PubMed] [Google Scholar]
- 21.Mohler PJ, Davis JQ, Bennett V. Ankyrin-B coordinates the Na/K ATPase, Na/Ca exchanger, and InsP3 receptor in a cardiac T-tubule/SR microdomain. PLoS Biol. 2005;3(12):e423. doi: 10.1371/journal.pbio.0030423. [DOI] [PMC free article] [PubMed] [Google Scholar]
- 22.Swift F, Tovsrud N, Sjaastad I, Sejersted OM, Niggli E, Egger M. Functional coupling of alpha(2)-isoform Na+/K+-ATPase and Ca2+ extrusion through the Na+/Ca2+-exchanger in cardiomyocytes. Cell Calcium. 2010;48(1):54–60. doi: 10.1016/j.ceca.2010.06.006. [DOI] [PubMed] [Google Scholar]
- 23.Yamamoto T, Su Z, Moseley AE, Kadono T, Zhang J, Cougnon M, Li F, Lingrel JB, Barry WH. Relative abundance of alpha2 Na+ pump isoform influences Na+-Ca2+ exchanger currents and Ca2+ transients in mouse ventricular myocytes. J Mol Cell Cardiol. 2005;39(1):113–20. doi: 10.1016/j.yjmcc.2005.03.023. [DOI] [PubMed] [Google Scholar]
- 24.Page E, Surdyk-Droske M. Distribution, surface density, and membrane area of diadic junctional contacts between plasma membrane and terminal cisterns in mammalian ventricle. Circ Res. 1979;45(2):260–7. doi: 10.1161/01.res.45.2.260. [DOI] [PubMed] [Google Scholar]
- 25.Soeller C, Cannell MB. Examination of the transverse tubular system in living cardiac rat myocytes by 2-photon microscopy and digital image-processing techniques. Circ Res. 1999;84(3):266–75. doi: 10.1161/01.res.84.3.266. [DOI] [PubMed] [Google Scholar]
- 26.Juhaszova M, Blaustein MP. Na+ pump low and high ouabain affinity alpha subunit isoforms are differently distributed in cells. Proc Natl Acad Sci U S A. 1997;94(5):1800–5. doi: 10.1073/pnas.94.5.1800. [DOI] [PMC free article] [PubMed] [Google Scholar]
- 27.Zhang J, Lee MY, Cavalli M, Chen L, Berra-Romani R, Balke CW, Bianchi G, Ferrari P, Hamlyn JM, Iwamoto T, Lingrel JB, Matteson DR, Wier WG, Blaustein MP. Sodium pump alpha2 subunits control myogenic tone and blood pressure in mice. J Physiol. 2005;569(Pt 1):243–56. doi: 10.1113/jphysiol.2005.091801. [DOI] [PMC free article] [PubMed] [Google Scholar]
- 28.Blaustein MP, Chen L, Hamlyn JM, Leenen FH, Lingrel JB, Wier WG, Zhang J. Pivotal role of alpha2 Na+ pumps and their high affinity ouabain binding site in cardiovascular health and disease. J Physiol. 2016;594(21):6079–6103. doi: 10.1113/JP272419. [DOI] [PMC free article] [PubMed] [Google Scholar]
- 29.Scriven DR, Dan P, Moore ED. Distribution of proteins implicated in excitation-contraction coupling in rat ventricular myocytes. Biophys J. 2000;79(5):2682–91. doi: 10.1016/S0006-3495(00)76506-4. [DOI] [PMC free article] [PubMed] [Google Scholar]
- 30.Hong T, Yang H, Zhang SS, Cho HC, Kalashnikova M, Sun B, Zhang H, Bhargava A, Grabe M, Olgin J, Gorelik J, Marban E, Jan LY, Shaw RM. Cardiac BIN1 folds T-tubule membrane, controlling ion flux and limiting arrhythmia. Nat Med. 2014;20(6):624–32. doi: 10.1038/nm.3543. [DOI] [PMC free article] [PubMed] [Google Scholar]
- 31.Hong T, Shaw RM. Cardiac T-Tubule Microanatomy and Function. Physiol Rev. 2017;97(1):227–252. doi: 10.1152/physrev.00037.2015. [DOI] [PMC free article] [PubMed] [Google Scholar]
- 32.Mohler PJ, Schott JJ, Gramolini AO, Dilly KW, Guatimosim S, duBell WH, Song LS, Haurogne K, Kyndt F, Ali ME, Rogers TB, Lederer WJ, Escande D, Le Marec H, Bennett V. Ankyrin-B mutation causes type 4 long-QT cardiac arrhythmia and sudden cardiac death. Nature. 2003;421(6923):634–9. doi: 10.1038/nature01335. [DOI] [PubMed] [Google Scholar]
- 33.Despa S, Kockskamper J, Blatter LA, Bers DM. Na/K pump-induced [Na]i gradients in rat ventricular myocytes measured with two-photon microscopy. Biophys J. 2004;87(2):1360–8. doi: 10.1529/biophysj.103.037895. [DOI] [PMC free article] [PubMed] [Google Scholar]
- 34.Weber CR, Piacentino V, 3rd, Ginsburg KS, Houser SR, Bers DM. Na+-Ca2+ exchange current and submembrane [Ca2+] during the cardiac action potential. Circ Res. 2002;90(2):182–9. doi: 10.1161/hh0202.103940. [DOI] [PubMed] [Google Scholar]
Associated Data
This section collects any data citations, data availability statements, or supplementary materials included in this article.


