Abstract
The viral protein HIVgp41 is an attractive and validated drug target that proceeds through a sequence of conformational changes crucial for membrane fusion, which facilitates viral entry. Prior work has identified inhibitors that interfere with the formation of a required six-helix bundle, composed of trimeric C-heptad (CHR) and N-heptad (NHR) repeat elements, through blocking association of an outer CHR helix or obstructing formation of the inner NHR trimer itself. In this work, we employed similarity-based scoring to identify and experimentally characterize 113 compounds, related to 2 small-molecule inhibitors recently reported by Allen et al (Bioorg. Med. Chem Lett. 2015, 25 2853-59), proposed to act via the NHR trimer obstruction mechanism. The compounds were first tested in an HIV cell-cell fusion assay with the most promising evaluated in a second, more biologically relevant viral entry assay. Of the candidates, compound #11 emerged as the most promising hit (IC50 = 37.81 μM), as a result of exhibiting activity in both assays with low cytotoxicity, as was similarly seen with the known control peptide inhibitor C34. The compound also showed no inhibition of VSV-G pseudotyped HIV entry compared to a control inhibitor suggesting it was specific for HIVgp41. Molecular dynamics simulations showed the predicted DOCK pose of #11 interacts with HIVgp41 in an energetic fashion (per-residue footprints) similar to the four native NHR residues (IQLT) which candidate inhibitors were intended to mimic.
Keywords: HIV, gp41, Docking, DOCK, Virtual screening, Footprint similarity, Hungarian similarity, Viral entry, Structure-based drug design, computer-aided drug design
Graphical Abstract

Although the development of potent Human Immunodeficiency Virus (HIV) drugs has generally increased the longevity of those infected, many anti-retroviral compounds become susceptible to viral genetic variability which reduces and in some cases eliminates their efficacy.1,2 As such, there is continued need to develop alternative treatment options for HIV to address the potential devastating effect of mutations. Two underexploited viral drug targets, compared to HIV protease and reverse transcriptase, are the glycoproteins gp120 and gp41, which play an essential role in viral entry.3 Upon the initial binding of gp120 to the CD4 receptor and CCR5 and/or CXCR4 co-receptors of a target cell, the gp41 protein undergoes a series of conformational changes required for the fusion of the viral and host-cell membranes.4–6 Focusing on targeting gp41, there are several inhibitory strategies many of which focus on the pre-hairpin intermediate.7–11 In particular, C-heptad repeat (CHR) derived inhibitors, such as the FDA approved peptide drug T20 (Fuzeon), bind the gp41 intermediate, which obstructs association of the native outer CHR helices. This binding event prevents formation of the six-helix bundle required for viral entry.4,12–14 Alternatively, peptides have been proposed that hinder or block formation of the inner N-heptad repeat (NHR) trimer15–19 although via a less-well studied mechanism. One complicating factor is that peptide inhibitors that mimic NHR sequences such as N36 and N36Mut suffer from aggregation, which is less of problem for CHR peptides. In an attempt to mitigate potential aggregation issues, as well as other pharmacological challenges such as peptide bioavailability, we recently reported a dual computational/experimental approach20 designed to identify small-molecule compounds capable of mimicking native interactions within the NHR trimer, and thereby potentially obstructing formation of the trimer itself, for use as potential drug leads.
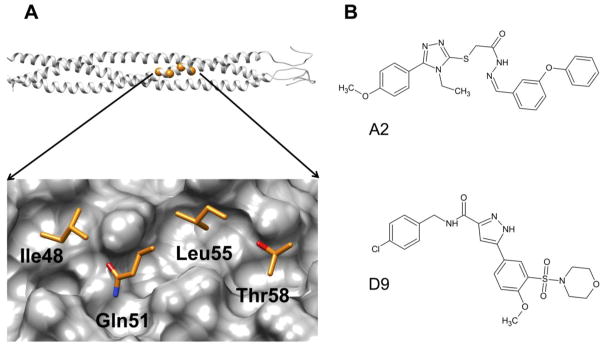
Briefly, the computer-aided modeling procedure in our prior work employed time-averaged molecular dynamics simulations and atomic-level footprints (per-residue interaction patterns)20 which were used to identify two possible binding pockets (termed IQLT and QLIQ) at the interface of two NHR helices named for the key residues from the third NHR helix that interpolate each site. Figure 1A, shows the IQLT pocket. Two large scale virtual screens of ca 1.4 million purchasable compounds each (ZINC21 database) were performed independently to each pocket with 120 compounds ultimately selected for experimental testing. Two compounds emerged from the work, designated A2 and D9 (Figure 1B), that showed reasonable anti-fusion activity and cytotoxicity. Both were prioritized from the same IQLT computational screen. In this work, we hypothesize that identification and testing of compounds that are “similar” to A2 and D9 in terms of both two-dimensional (chemical composition) and three-dimensional space would lead to additional small-molecule hits that could arrest viral entry via the same proposed mechanism. The specific goals are three-fold: (1) leverage our new Hungarian Matching Similarity (HMS) algorithm22 to identify and purchase compounds docked into the IQLT site that are structural and/or energetic analogs of A2 and D9, (2) experimentally test the purchased analogs to assess cell-cell fusion activity, viral-entry activity, and cytotoxicity, and (3) examine the most promising hits in greater detail using molecular dynamics simulations to assess geometric and energetic stability.
Figure 1.
(A) Top, ribbon representation of the HIVgp41 NHR-trimer model, based on prior work reported by McGillick et al,23 with highlighted spheres (orange) showing the location of the four residues that correspond to the IQLT pocket. (Bottom) Close-up view of the four native (IQLT) residues that interpolate the pocket. (B) Structures of A2 and D9.
To identify compounds related to A2 and D9, we processed the top 100,000 docked compounds from the original IQLT screen, prioritized by the standard DOCK Cartesian energy (DCE) score, using our HMS algorithm as implemented into DOCK6. For each parent compound (A2 or D9) the top 200 HMS-ranked molecules were then examined using three-dimensional stereographic visualization in combination with several descriptive and physics-based metrics to select compounds for purchase. Ultimately, a total of 113 (A2: N=60, D9: N=53) compounds were obtained for experimental testing.
Table 1 compares descriptors for each of the parents with the average descriptor values computed for each group of analogs: HMS score,22 Volume Overlap Similarity (VOS) score, van der Waals Footprint Similarity (FPSVDW) score,24 electrostatic Footprint Similarity (FPSES) score,24 and Pharmacophore Matching Similarity (FMS) score.25 For these four descriptors the numerical values for each parent represent the most favorable scores that could be attainable (i.e. perfect overlap). For comparison, three other descriptors are shown and include molecular weight (MW), number of rotatable bonds (RB), and DOCK Cartesian energy (DCE) score.
Table 1.
Summary of descriptors for molecules selected employing Hungarian scoring.
| Compound | Na | HMSb | VOSc | FPSVDWd | FPSESd | FMSe | MWf | RBg | DCEh |
|---|---|---|---|---|---|---|---|---|---|
| A2 parent | 1 | −5.0 | 1.0 | 0.0 | 0.0 | 0.0 | 487.6 | 11 | −47.1 |
| A2 analogs | 60 | −2.6±0.5 | 0.7±0.1 | 2.6±0.6 | 0.9±0.3 | 2.4±0.9 | 461.3±35.4 | 9.5±1.3 | −42.3±1.8 |
| D9 parent | 1 | −5.0 | 1.0 | 0.0 | 0.0 | 0.0 | 491.0 | 8 | −44.6 |
| D9 analogs | 53 | −2.4±1.2 | 0.8±0.1 | 2.2±0.5 | 1.1±0.5 | 3.1±1.7 | 451.8±32.5 | 8.1±1.0 | −41.7±1.5 |
N = number of related compounds,
HMS = average Hungarian score (values closer to the max favorable score of −5 have better overlap),
VOS = average Volume score (values closer to 1 occupy similar volume),
FPSVDW/ES = average Footprint score (numbers closer to 0 have better overlap),
FMS = average Pharmacophore score (numbers closer to 0 have better overlap),
MW = average molecular weight,
RB = average number of rotatable bonds,
DCE = average DOCK Cartesian energy in units of kcal/mol (larger negative score is more favorable).
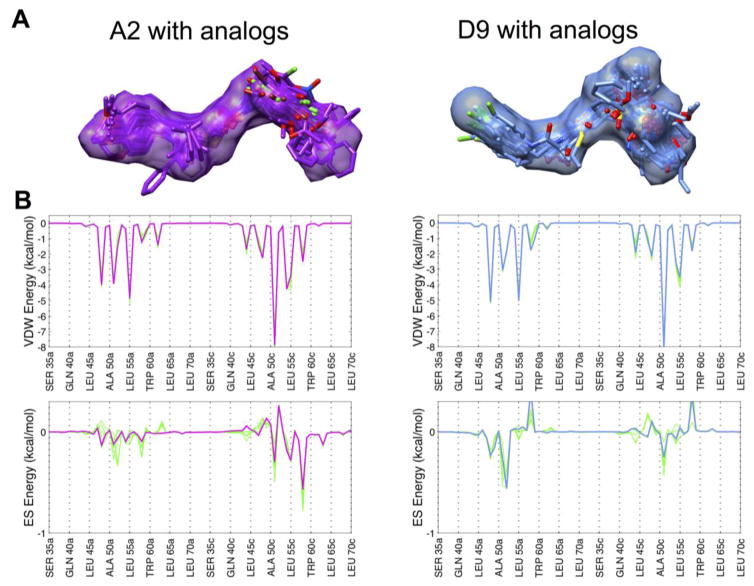
As expected, because each group of analogs was primarily selected using the HMS method, many of the average descriptors in Table 1 demonstrate good overlap with the two parent molecules. For example, values for the HMS scores of ~ −2.5 are relatively close to the maximum score of −5, which, based on our experience is indicative of substantial similarity in both 2D and 3D space. For VOS score, the average values of 0.7 and 0.8 are close to 1, which again indicates extensive overlap. Figure 2A highlights just how well the DOCK poses for these analogs are confined within the volume envelope of each respective reference. In terms of interaction energy patterns, FPSVDW and FPSES columns show van der Waals and electrostatic footprint similarity scores which measure how well a candidate molecule mimics the per-residue energetics made by a reference ligand (A2 or D9) bound to a receptor (computed using Euclidean distance). The FPSVDW values of 2.6 and 2.2 and FPSES values of 0.9 and 1.1 suggest good average similarity across the group. Visual examination of footprints for analogs with the best FPS overlap (N=5 each) highlights the considerable pattern overlap (Figure 2B). The final similarity descriptor in Table 1 quantifies pharmacophore overlap (FMS score). As reported by Jiang et al,25 FMS scores in the range 0 – 2 were found for identical compounds having conformations that differed by 2 Å or less in root mean squared deviation (RMSD) overlap and thus would be considered well-matched. The somewhat higher average FMS values of 2.4 and 3.1 seen here are likely due to the differences between the analogs and their references (i.e. compound pairs differ in both conformations and topology). Closer examination revealed that 24 out of the 60 A2 analogs and 21 out of the 53 D9 analogs yielded individual FMS values < 2 indicative of significant structural overlap, which was confirmed through 3D visualization. Other computed properties include MW for which both groups of analogs show some deviation from their respective parents by about 27–40 g/mol. As it pertains to ligand flexibility, both the A2 (RB=9.5 vs 11) and D9 analogs (RB=8.1 vs 8) have approximately the same number of rotatable bonds. In terms of energy score, the average DCE values for the analogs are somewhat less favorable than their parents which can be partially explained by their lower MW. Although, one analog from the A2 group and three analogs from the D9 group showed DCE scores more favorable than their parents.
Figure 2.
(A) The 3D predicted binding geometries for A2 (purple surface) and D9 (light blue surface) with each group of analogs (colored sticks). (B) Comparison of van der Waals and electrostatic footprints of A2 (purple) and D9 (light blue) with the top 5 analogs (green) showing the best overlap in each case. A distant-dependent-dielectric cutoff (ddd=4r) was used to compute the electrostatic footprint score.
In order to test whether these groups of analogs would inhibit gp41-mediated membrane fusion, cell-cell fusion assays were performed. The assay, as described previously,20 involves a well-validated model of the HIV-host cell system utilizing HL2/326 cells expressing the viral proteins and TZM-bl27–31 as the receptor line. Briefly, the TZM-bl cells were seeded in a 96-well plate and each plate was designed as follows: 2 wells for 25 μM of each of the small-molecule compounds, 8 wells for the dimethyl sulfoxide (DMSO)-only controls to determine maximum signal (positive signal control), and 8 wells for 1 μM of anti-fusion peptide C34 treated samples to determine maximum inhibition (negative signal control). All small-molecule compounds were dissolved in DMSO and further diluted in complete media.
After 24 hours, the TZM-bl cells and HL2/3 cells were pretreated with 25 μM of small-molecule compounds, DMSO, or 1 μM of C34 peptide inhibitor followed by co-incubation for 6 hours at 37 °C in a 5% CO2 incubator. At 6 hours post co-incubation, cell-cell fusion levels and cell viability were measured by a luciferase and cell viability combined system (ONE-Glo + Tox Luciferase Reporter and Cell Viability Assay, Promega) according to manufacturer’s protocol. The luciferase signal was normalized utilizing the same procedure as described in Allen et al.20
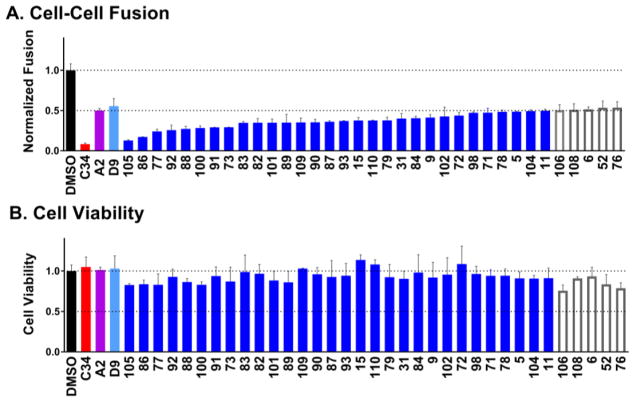
Figure 3A shows the top 35 compounds (colored blue if the luciferase signal ≤ 0.5 and outlined in gray if the luciferase signal > 0.5) of the 113 that were experimentally tested in comparison with a DMSO-only control, (black), the known C-peptide inhibitor C34 (red), and the two parents A2 (magenta) and D9 (light blue). The relatively high percentage of hits with 50% inhibition at 25 μM (N=30) is most likely attributable to the group’s structural similarity to A2 and D9 with similar overall properties (Table 1, Figure 2). Among the hits, 25 were analogs of D9 and 5 were analogs of A2. Encouragingly, all of them exhibited greater activity compared to their parents (Figure 3A blue vs magenta and light blue). And, several candidates showed activity similar to the known C34 peptide although they were tested at a higher concentration (25 vs 1 μM). Importantly, accompanying cell viability measurements, (Figure 3B, blue bars) showed minimal effects indicating that reduced cell-cell fusion levels were not primarily due to a loss in cell viability. We similarly attribute this result to the analogs being derived from parents originally selected not only because of their activity but also their relatively low cytotoxicity.
Figure 3.
Experimental cell-cell fusion (A) and cell viability (B) for the top 35 out of 113 compounds when ranked by activity using a combined luciferase reporter and cell viability assay. Colored blue are compounds with a luciferase signal ≤ 0.5 and outlined in gray are compounds with a luciferase signal >0.5. Also shown are DMSO only (black), control peptide inhibitor C34 (red), and the two previously identified inhibitors A2 (magenta) and D9 (light blue). Compounds labeled in alphanumeric code along the x-axis.
In addition to the cell-cell fusion assays, we evaluated all 113 compounds in a second, more biologically relevant viral entry assay. Briefly, HIV-1 stocks were prepared by a standard transfection method using polyethylenimine (PEI) MAX 4000 (Polysciences),32,33 pNL4-3.HSA.R-E- plasmid and pHXB2-env plasmid,34 and the infectious titer of each virus stock was quantified by X-Gal staining in TZM-bl cells.35,36 The day before the infection, TZM-bl cells were seeded at a concentration of 104 cells/well in a 96-well plate and each plate was designed as described above for the cell-cell fusion experiments. As before, the target cells were pretreated with 25 μM of the small-molecules, DMSO, or 1μM of C34 peptide for one hour at 37 °C. Multiplicity of infection (MOI) 0.1 of virus was also pretreated with the small-molecules, DMSO, or C34 for one hour at 37 °C. One hour later, medium containing the small-molecules was replaced with virus samples that had been separately incubated with the small-molecules. Cells were spinoculated at 1,000 × g for 1 hour at room temperature and then incubated for one hour at 37 °C in a 5% CO2 incubator. Cells were washed, replaced with fresh complete media without any of the candidate inhibitors and further incubated for two days at 37 °C in a 5% CO2 incubator. At 48 hours post infection, viral entry levels and cell viability were measured and the luciferase signal was normalized as described earlier.
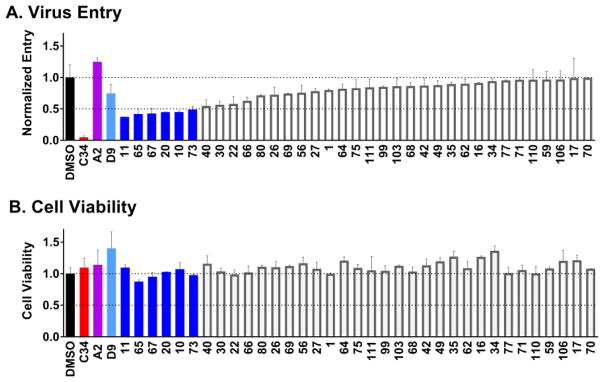
Figure 4A shows the top 35 viral entry results, similar to that plotted above for cell-cell fusion, with compounds rank-ordered by activity. Analogous to Figure 3, the 6 compounds colored blue here indicate a luciferase signal ≤ 0.5. Again, active compounds appeared to have low cytotoxicity (Figure 4B, blue) suggesting the decrease in viral entry was not predominantly related to losses in cell viability. As before, the hits were a mix of parent scaffolds (A2=3, D9=3). Unexpectedly however, and in sharp contrast to the cell-cell fusion results, rank-ordered ligands beyond the 35 shown exhibited agonist behavior (luciferase signal > 1) in terms of viral entry. Surprisingly, the parent compound A2 was also a slight agonist (Figure 4A, magenta) although the parent D9 was an antagonist (Figure 4A, light blue), albeit a weak one. While the identification of compounds showing viral entry agonism is an interesting result, since the goal of the work was identification of antagonists, such molecules were not considered further. It should be noted however that the identification of agonists is not without precedence or usefulness in the HIV entry field as recently detailed by Courter et al.37 For the present work, using the known viral entry inhibitor C34 as a benchmark (Figures 3 and 4, red), we were encouraged that two compounds #11 (an analog of A2) and #73 (an analog of D9) appeared to have similar behavior with regards to inhibition of cell-cell fusion (> 50%) and viral entry (> 50%) and low cytotoxicity (Figures 3 and 4, blue).
Figure 4.
Experimental viral entry (A) and cell viability (B) results for the top 35 out of 113 compounds when ranked by activity using a combined luciferase reporter and cell viability assay. Colored blue are compounds with a luciferase signal ≤ 0.5 and outlined in gray are compounds with a luciferase signal >0.5. Also shown are DMSO only (black), control peptide inhibitor C34 (red), and the two previously identified inhibitors A2 (magenta) and D9 (light blue). Compounds labeled in alphanumeric code along the x-axis.
We employed the publically available ZINC1538 and PubChem39,40 chemical databases to explore if either compound had previously displayed promiscuous biological activity, was a colloidal aggregator,41 or had PAINS42 alerts that might indicate non-specific effects. Compound #11 was not reported to have previously been tested, and #73 was reported as having biologically activity in only 9 out of 852 bioassays (PubChem results) with 4 of the 9 entries citing the same target (ATAD5). Neither compound was identified as an aggregator. However, both compounds showed some similarity to reported aggregators in ZINC15 (similarity index = 0.54 for #11, and 0.62 for #73). Compound #11 had one PAINS alert due to the presence of a hzone_phenol_A substructure while compound #73 had no alerts (ZINC15 results).
To help rule out non-specific effects we counter screened both compounds against an unrelated biological target to validate that the observed activity was specific to HIVgp41. The orthogonal assay employed a vesicular stomatitis virus (VSV)-G protein pseudotype43 (Figure 5). The VSV-G virus was produced by a standard PEI transfection using two plasmids, pNL4-3.HSA.R-E- and pCMV-VSV-G and viral entry was tested in the presence of 25 μM of inhibitors as described above. Compound #11 showed no inhibition of VSV-G pseudotyped HIV entry compared to the highly potent control inhibitor Bafilomycin A144 (red, Figure 5) suggesting the compound was specific for HIVgp41. Compound #73 showed only minor inhibition (blue, Figure 5).
Figure 5.
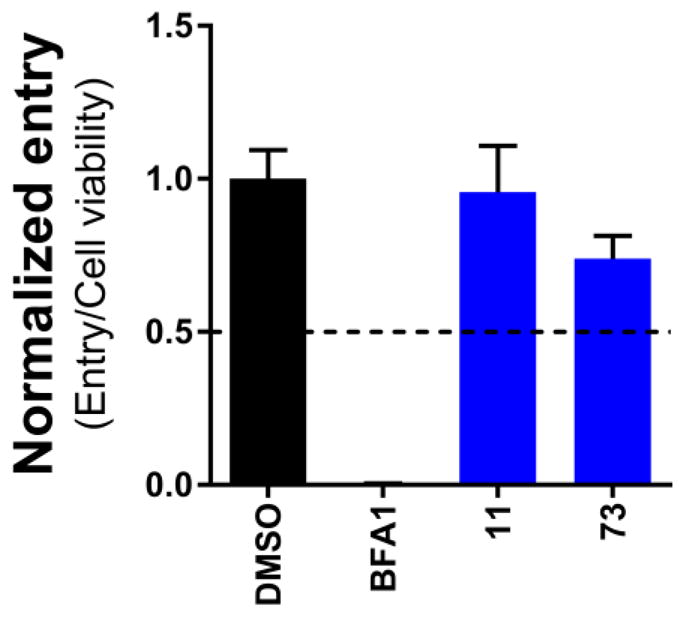
VSV-G mediated viral entry results of compounds #11 and #73, colored blue. Also depicted are DMSO (black) and the control Bafilomycin A1 (BFA1).
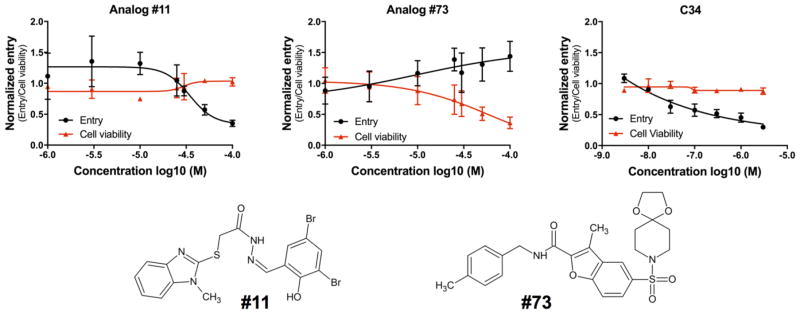
To further validate specificity, dose-response experiments for #11 and #73 (Figure 6) were performed to assess viral entry activity (black curve) and cytotoxicity (red curve) at varying concentrations. Inhibitory concentrations at 50% (IC50) of the molecules were plotted and determined using GraphPad Prism 7. Surprisingly, compound #73 exhibited agonistic behavior (Figure 6 middle) as the concentration was increased despite being an antagonist at 25 μM (Figure 4A). In addition, the cell viability of #73 decreased dramatically at higher concentrations. However, for compound #11, a well-behaved dose-response curve was observed (Figure 6 left) and the compound was not toxic even at the highest concentration tested (100 μM). The IC50 after curve fitting was 37.81 ± 11.74 μM. For comparison, the dose response curve for the known peptide inhibitor C34 is also shown as a positive control (Figure 6 right). Taken together, the observation that #11 exhibited activity in two different assays (cell-cell fusion, viral entry) in direct comparison with a known control inhibitor (C34), showed well-behaved dose-response behavior, had low cytotoxicity, and had no significant activity in an orthogonal VSV-G assay suggest its activity for HIVgp41 is selective and not a result of promiscuity.
Figure 6.
Dose–response viral entry curve (black), cytotoxicity curve (red), of compounds #11 (left), #73 (middle) and the control peptide inhibitor C34 (right). The 2-dimensional structures of #11 and #73.
To more completely assess the energetics of #11 in its DOCK-predicted pose, and obtain conformational dynamics, molecular footprint analysis and all-atom molecular dynamics (MD) simulations were employed. Briefly, the ff14SB45 force field was used for the protein (PDB ID 1AIK). The protein was capped with the N- and C-terminus capping groups, acetyl and N-methyl amide. The parameters for the ligand were acquired from GAFF46 force field and the antechamber module was utilized to compute AM1-BCC47,48 charges. The solvent was modeled using a 13 Å TIP3P49 solvent buffer encapsulating the protein in a truncated octahedron box. The system was neutralized by the addition of four chlorine ions. Prior to performing production MD, the system was equilibrated in a stepwise fashion. First, the solvent and the hydrogen atoms of the protein were minimized, followed by a minimization of the entire system. The system, with positional restraints of 20 kcal mol−1 Å−2 on the solute, was heated linearly from 50 – 300 K over a period of 250 ps, using a canonical ensemble. Next, the density was equilibrated for 500 ps in an isothermal-isobaric ensemble. Finally, the positional restraints on the backbone atoms of the protein and heavy atoms of the ligand were reduced from 5.0 to 0.1 kcal mol−1 Å−2 over the course of four MD simulations. The production phase of the MD simulations, run in sextuplicate, included a weak 0.1 kcal mol−1 Å−2 restraint on the backbone atoms but the ligand was unrestrained. All simulations were performed with the CUDA-accelerated version of pmemd50–52 in AMBER16.53 Analyses of the MD trajectories were accomplished utilizing VMD,54 Chimera,55 and the cpptraj56 module in AMBER16.
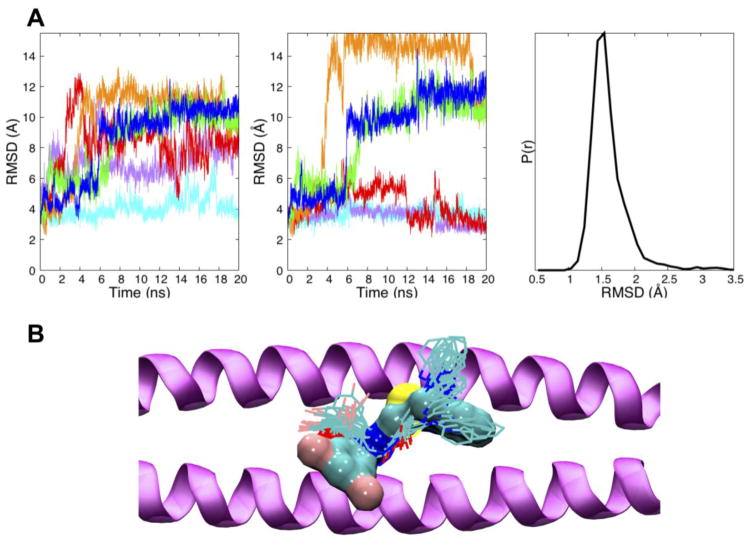
To assess overall stability and compatibility with the IQLT pocket, the root mean squared deviations (RMSD) of #11 were computed for all six MD simulations using as the reference the original DOCK pose. Previous studies20,57 in our laboratory have employed MD to characterize how thermal motion affects docked ligand geometries of a solvated complex. Here, three types of RMSD calculations were performed: (i) total ligand RMSD after fitting gp41 Cα atoms from MD snapshots to the receptor used in the original docking calculation, (ii) partial ligand RMSD for a subset of ligand atoms, (iii) total ligand RMSD after fitting compound #11 to itself. As shown in Figure 7A (left), RMSDs which includes changes in ligand internal geometry plus rigid-body motion are relatively large for all but one of the trajectories (cyan ~ 4 Å) although all appear to reach an equilibration plateau. Upon inspection, the terminal 1-methylbenzimidazole ring was observed to have sizeable fluctuations in several simulations and plots with this group excluded show three of the six trajectories (cyan, magenta, red) have lower RMSD values of between 2 – 4 Å by the end of the runs (Figure 7A, middle). The other end of #11 contains a 3,5-dibromo-2-hydroxy-benzylidene group which, although more geometrically stable, flips up and rotates in most simulations to form greater electrostatic interactions with nearby gp41 residues. Studies to identify more rigid analogs, using de novo design and genetic algorithm approaches implemented into DOCK6, are planned for future work.
Figure 7.
(A) The DOCK pose of #11 was the reference for all RMSD calculations. Left, RMSDs vs. time for #11 from six different MD simulations (colored lines); Middle, RMSDs vs. time for #11 with the more flexible 1-methylbenzimidazole ring excluded. Right, composite histogram of internally-fit RMSDs for compound #11 from all simulations; (B) Twenty evenly spaced MD snapshots of #11 (line representation) extracted every 1000 ps from the most stable (cyan) trajectory compared to the initial DOCK pose (surface representation) in the IQLT pocket formed by two gp41 NHR peptides (purple ribbon).
Interestingly, despite these changes, a RMSD histogram computed by fitting only the ligand coordinates of each MD frame to the originally docked pose (which removes rigid-body effects) shows much smaller variability (1.5 Å average) suggesting the overall intra-molecular geometry is surprisingly well-maintained (Figure 7A, right). Figure 7B compares the original DOCK pose with 20 evenly-spaced snapshots from the most stable (cyan) MD simulation. For this trajectory, the ligand remains relatively close in space to the DOCK-predicted position although the aforementioned deviations preclude good volume overlap. Nevertheless, as described below, an examination of molecular footprints indicates that many of the same interactions are in fact maintained as originally predicted, including mimicry of native IQLT residues.
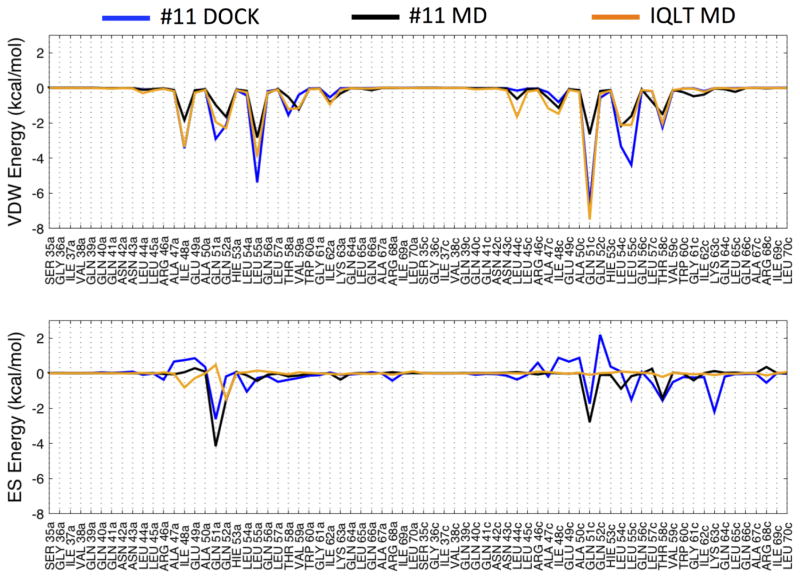
The IQLT pocket is highly solvent exposed, thus use of RMSD alone to gauge geometric stability may lead to false negatives as recently described in Holden et al.57 In such instances, examination of molecular footprints provides an alternative way to assess pocket compatibility. Figure 8 compares footprints based on the original DOCK pose of #11 (blue), MD-averaged trajectories of #11 (black), as well as a MD-averaged trajectory of IQLT (orange) derived from one HIVgp41 NHR helix. In general (Figure 8 top), there is substantial overlap between the original DOCK (blue) and MD-averaged (black) van der Waals footprints for #11. Although, the magnitude in some cases is less favorable at several positions in the MD-averaged profile (black), in particular at position Gln51c (chain c). Comparison of DOCK and MD-averaged electrostatic footprints (Figure 8 bottom) for #11 also show reasonable overlap, especially at three positions (Gln51a, Gln51c, and Thr58c), although two peaks at positions Leu55c and Lys63c are not observed in the MD results (blue vs black). Favorable increases in electrostatics are observed in the MD simulations of #11 at positions Gln51a and Gln51c, in addition to a new interaction at Leu54c, which are a result of ligand geometry changes noted above that lead to stronger hydrogen bonding in the proposed pocket versus the originally docked pose.
Figure 8.
Footprint comparison for the original DOCK pose of #11 (blue), six MD-averaged trajectories of #11 (black) and time-averaged trajectory of the IQLT peptide reference20 (orange) segmented into van der Waals (top) and electrostatic components (bottom). For consistency with Allen et al20 electrostatics were computed without a distant-dependent-dielectric cutoff.
Footprint comparisons between the IQLT peptide fragment and #11 (MD-averaged) show both similarities and differences (Figure 8, orange vs. black). The van der Waals footprint profile for IQLT has considerable structure with thirteen gp41 interactions peaks at −1 kcal/mol or greater. Notably, compound #11 yields a similar overall pattern and nine of the thirteen peaks made by IQLT are satisfied supporting our initial intent of identifying small molecules capable of molecular mimicry. In sharp contrast to the van der Waals footprint, the electrostatic pattern for IQLT is relatively flat, and of the only two favorable peaks observed, only one is greater than −1 kcal/mol (Gln52a). Interestingly, the originally docked pose of #11 (Figure 8 bottom, blue) showed a small electrostatic interaction at this position although the MD-averaged results yield comparable magnitudes (−1.51 vs −1.46 kcal/mol) with IQLT (Figure 8 bottom, black vs. orange). Overall, we hypothesize that mimicry of the native Gln52a electrostatic peak, together with new interactions observed at Gln51a, Gln51c, and Thr58c, helps provide selectivity for the pocket. This could help to explain both potency and lack of cytotoxicity of #11 as a function of increasing concentration (Figure 6, red).20
In conclusion, docking results from a prior large-scale virtual screen to the IQLT pocket20 on HIVgp41, that resulted in the identification of two experimentally-verified leads A2 and D9, were data-mined using similarity-based scoring (HMS method) to identify 400 related molecules hypothesized to obstruct formation of the NHR trimer thereby preventing viral entry. Using multiple physics-based and descriptive metrics, 113 compounds were selected for experimental testing (Table 1). Based on results from cell-cell fusion (Figure 3) and viral entry (Figure 4) assays, each with accompanying cytotoxicity measurements, and through comparison to a known HIV entry inhibitor (C34), two candidates emerged. Following dose-response analysis, only compound #11, an analog related to the initial parent A2, appeared promising and was examined further. Subsequent atomic-level modeling of #11 revealed the MD-average pose makes numerous favorable energetic interactions in the targeted binding site, many of which mirror the native reference IQLT, a peptide fragment from HIVgp41, which the small molecules were originally intended to mimic. Although more detailed experimental mechanistic studies are warranted, these results provide additional support for continued development and characterization of a potentially new class of small-molecule inhibitors that arrest viral entry through obstructing formation of the gp41 NHR trimer.
Acknowledgments
This work was funded in part by the Stony Brook University Office of the Vice President for Research, HRD1311318 (to T.D.M.) and NIH grants F32GM105400 (to W.J.A.), P30AI078498 (to A.J.), R21AI102796 (to A.J.), and R01GM083669 (to R.C.R.). The following reagents were obtained through the NIH AIDS Research and Reference Reagent Program, Division of AIDS, NIAID, NIH: TZM-bl from Dr. John C. Kappes, Dr. Xiaoyun Wu and Tranzyme Inc., HL2/3 from Dr. Barbara K. Felber and Dr. George N. Pavlakis, pNL4-3.HSA.R-E- from Dr. Nathaniel Landau, pHXB2-env from Dr. Kathleen Page and Dr. Dan Littman, and HIV-1 IIIB C34 Peptide from DAIDS, NIAID. The research utilized resources at the New York Center for Computational Sciences at Stony Brook University/Brookhaven National Laboratory, which is supported by the U.S. Department of Energy under Contract No. DE-AC02-98CH10886 and by the State of New York. The authors would like to thank Stony Brook Research Computing and Cyberinfrastructure, and the Institute for Advanced Computational Science at Stony Brook University for access to the high-performance LIred and SeaWulf computing systems, the latter of which was made possible by a $1.4M National Science Foundation grant (#1531492).
Footnotes
Publisher's Disclaimer: This is a PDF file of an unedited manuscript that has been accepted for publication. As a service to our customers we are providing this early version of the manuscript. The manuscript will undergo copyediting, typesetting, and review of the resulting proof before it is published in its final citable form. Please note that during the production process errors may be discovered which could affect the content, and all legal disclaimers that apply to the journal pertain.
References and Notes
- 1.Shafer RW, Schapiro JM. AIDS Rev. 2008;10:67. [PMC free article] [PubMed] [Google Scholar]
- 2.Johnson VA, Calvez V, Gunthard HF, Paredes R, Pillay D, Shafer R, Wensing AM, Richman DD. Top Antivir Med. 2011;19:156. [PMC free article] [PubMed] [Google Scholar]
- 3.Lu L, Yu F, Cai L, Debnath AK, Jiang S. Current topics in medicinal chemistry. 2016;16:1074. doi: 10.2174/1568026615666150901114527. [DOI] [PMC free article] [PubMed] [Google Scholar]
- 4.Chan DC, Fass D, Berger JM, Kim PS. Cell. 1997;89:263. doi: 10.1016/s0092-8674(00)80205-6. [DOI] [PubMed] [Google Scholar]
- 5.Chan DC, Kim PS. Cell. 1998;93:681. doi: 10.1016/s0092-8674(00)81430-0. [DOI] [PubMed] [Google Scholar]
- 6.Chan DC, Chutkowski CT, Kim PS. Proceedings of the National Academy of Sciences of the United States of America. 1998;95:15613. doi: 10.1073/pnas.95.26.15613. [DOI] [PMC free article] [PubMed] [Google Scholar]
- 7.Doms RW, Moore JPJ. Cell Biol. 2000;151:F9. doi: 10.1083/jcb.151.2.f9. [DOI] [PMC free article] [PubMed] [Google Scholar]
- 8.Eckert DM, Kim PS. Annu Rev Biochem. 2001;70:777. doi: 10.1146/annurev.biochem.70.1.777. [DOI] [PubMed] [Google Scholar]
- 9.Cai L, Gochin M. Antimicrob Agents Chemother. 2007;51:2388. doi: 10.1128/AAC.00150-07. [DOI] [PMC free article] [PubMed] [Google Scholar]
- 10.Allen WJ, Rizzo RC. Biology (Basel) 2012;1:311. doi: 10.3390/biology1020311. [DOI] [PMC free article] [PubMed] [Google Scholar]
- 11.Hyun AY, Brian CF, Robert CR, Amy J. Current HIV Research. 2016;14:283. [Google Scholar]
- 12.Wild C, Oas T, McDanal C, Bolognesi D, Matthews T. Proc Natl Acad Sci U S A. 1992;89:10537. doi: 10.1073/pnas.89.21.10537. [DOI] [PMC free article] [PubMed] [Google Scholar]
- 13.Wild C, Greenwell T, Matthews T. AIDS Res Hum Retroviruses. 1993;9:1051. doi: 10.1089/aid.1993.9.1051. [DOI] [PubMed] [Google Scholar]
- 14.Debnath AK, Radigan L, Jiang SJ. Med Chem. 1999;42:3203. doi: 10.1021/jm990154t. [DOI] [PubMed] [Google Scholar]
- 15.Bewley CA, Louis JM, Ghirlando R, Clore GM. J Biol Chem. 2002;277:14238. doi: 10.1074/jbc.M201453200. [DOI] [PubMed] [Google Scholar]
- 16.Root MJ, Steger HK. Curr Pharm Des. 2004;10:1805. doi: 10.2174/1381612043384448. [DOI] [PubMed] [Google Scholar]
- 17.He Y, Vassell R, Zaitseva M, Nguyen N, Yang Z, Weng Y, Weiss CD. J Virol. 2003;77:1666. doi: 10.1128/JVI.77.3.1666-1671.2003. [DOI] [PMC free article] [PubMed] [Google Scholar]
- 18.Ashkenazi A, Shai Y. Eur Biophys J. 2011;40:349. doi: 10.1007/s00249-010-0666-z. [DOI] [PubMed] [Google Scholar]
- 19.Gustchina E, Louis JM, Bewley CA, Clore GM. J Mol Biol. 2006;364:283. doi: 10.1016/j.jmb.2006.09.017. [DOI] [PMC free article] [PubMed] [Google Scholar]
- 20.Allen WJ, Yi HA, Gochin M, Jacobs A, Rizzo RC. Bioorg Med Chem Lett. 2015;25:2853. doi: 10.1016/j.bmcl.2015.04.067. [DOI] [PMC free article] [PubMed] [Google Scholar]
- 21.Irwin JJ, Sterling T, Mysinger MM, Bolstad ES, Coleman RG. J Chem Inf Model. 2012;52:1757. doi: 10.1021/ci3001277. [DOI] [PMC free article] [PubMed] [Google Scholar]
- 22.Allen WJ, Rizzo RC. Journal of Chemical Information and Modeling. 2014;54:518. doi: 10.1021/ci400534h. [DOI] [PMC free article] [PubMed] [Google Scholar]
- 23.McGillick BE, Balius TE, Mukherjee S, Rizzo RC. Biochemistry. 2010;49:3575. doi: 10.1021/bi901915g. [DOI] [PMC free article] [PubMed] [Google Scholar]
- 24.Balius TE, Mukherjee S, Rizzo RC. J Comput Chem. 2011;32:2273. doi: 10.1002/jcc.21814. [DOI] [PMC free article] [PubMed] [Google Scholar]
- 25.Jiang L, Rizzo RC. J Phys Chem B. 2015;119:1083. doi: 10.1021/jp506555w. [DOI] [PMC free article] [PubMed] [Google Scholar]
- 26.Ciminale V, Felber BK, Campbell M, Pavlakis GN. AIDS Res Hum Retroviruses. 1990;6:1281. doi: 10.1089/aid.1990.6.1281. [DOI] [PubMed] [Google Scholar]
- 27.Platt EJ, Wehrly K, Kuhmann SE, Chesebro B, Kabat D. J Virol. 1998;72:2855. doi: 10.1128/jvi.72.4.2855-2864.1998. [DOI] [PMC free article] [PubMed] [Google Scholar]
- 28.Derdeyn CA, Decker JM, Sfakianos JN, Wu X, O’Brien WA, Ratner L, Kappes JC, Shaw GM, Hunter E. J Virol. 2000;74:8358. doi: 10.1128/jvi.74.18.8358-8367.2000. [DOI] [PMC free article] [PubMed] [Google Scholar]
- 29.Wei X, Decker JM, Liu H, Zhang Z, Arani RB, Kilby JM, Saag MS, Wu X, Shaw GM, Kappes JC. Antimicrob Agents Chemother. 2002;46:1896. doi: 10.1128/AAC.46.6.1896-1905.2002. [DOI] [PMC free article] [PubMed] [Google Scholar]
- 30.Takeuchi Y, McClure MO, Pizzato M. J Virol. 2008;82:12585. doi: 10.1128/JVI.01726-08. [DOI] [PMC free article] [PubMed] [Google Scholar]
- 31.Platt EJ, Bilska M, Kozak SL, Kabat D, Montefiori DC. J Virol. 2009;83:8289. doi: 10.1128/JVI.00709-09. [DOI] [PMC free article] [PubMed] [Google Scholar]
- 32.Tang Y, Garson K, Li LI, Vanderhyden BC. Oncology Letters. 2015;9:55. doi: 10.3892/ol.2014.2684. [DOI] [PMC free article] [PubMed] [Google Scholar]
- 33.Longo PA, Kavran JM, Kim M-S, Leahy DJ. Methods in enzymology. 2013;529:227. doi: 10.1016/B978-0-12-418687-3.00018-5. [DOI] [PMC free article] [PubMed] [Google Scholar]
- 34.Kutner RH, Zhang X-Y, Reiser J. Nat Protocols. 2009;4:495. doi: 10.1038/nprot.2009.22. [DOI] [PubMed] [Google Scholar]
- 35.Kimpton J, Emerman M. Journal of Virology. 1992;66:2232. doi: 10.1128/jvi.66.4.2232-2239.1992. [DOI] [PMC free article] [PubMed] [Google Scholar]
- 36.Yi HA, Diaz-Aguilar B, Bridon D, Quraishi O, Jacobs A. Biochemistry. 2011;50:6966. doi: 10.1021/bi201014b. [DOI] [PubMed] [Google Scholar]
- 37.Courter JR, Madani N, Sodroski J, Schön A, Freire E, Kwong PD, Hendrickson WA, Chaiken IM, LaLonde JM, Smith AB. Accounts of Chemical Research. 2014;47:1228. doi: 10.1021/ar4002735. [DOI] [PMC free article] [PubMed] [Google Scholar]
- 38.Sterling T, Irwin JJ. Journal of Chemical Information and Modeling. 2015;55:2324. doi: 10.1021/acs.jcim.5b00559. [DOI] [PMC free article] [PubMed] [Google Scholar]
- 39.Kim S, Thiessen PA, Bolton EE, Chen J, Fu G, Gindulyte A, Han L, He J, He S, Shoemaker BA, Wang J, Yu B, Zhang J, Bryant SH. Nucleic Acids Res. 2016;44:D1202. doi: 10.1093/nar/gkv951. [DOI] [PMC free article] [PubMed] [Google Scholar]
- 40.Wang Y, Bryant SH, Cheng T, Wang J, Gindulyte A, Shoemaker BA, Thiessen PA, He S, Zhang J. Nucleic Acids Res. 2017;45:D955. doi: 10.1093/nar/gkw1118. [DOI] [PMC free article] [PubMed] [Google Scholar]
- 41.Irwin JJ, Duan D, Torosyan H, Doak AK, Ziebart KT, Sterling T, Tumanian G, Shoichet BK. Journal of Medicinal Chemistry. 2015;58:7076. doi: 10.1021/acs.jmedchem.5b01105. [DOI] [PMC free article] [PubMed] [Google Scholar]
- 42.Baell JB, Holloway GA. Journal of Medicinal Chemistry. 2010;53:2719. doi: 10.1021/jm901137j. [DOI] [PubMed] [Google Scholar]
- 43.Aiken C. Journal of Virology. 1997;71:5871. doi: 10.1128/jvi.71.8.5871-5877.1997. [DOI] [PMC free article] [PubMed] [Google Scholar]
- 44.Schaeffer E, Soros VB, Greene WC. Journal of Virology. 2004;78:1375. doi: 10.1128/JVI.78.3.1375-1383.2004. [DOI] [PMC free article] [PubMed] [Google Scholar]
- 45.Maier JA, Martinez C, Kasavajhala K, Wickstrom L, Hauser KE, Simmerling C. Journal of Chemical Theory and Computation. 2015;11:3696. doi: 10.1021/acs.jctc.5b00255. [DOI] [PMC free article] [PubMed] [Google Scholar]
- 46.Wang J, Wolf RM, Caldwell JW, Kollman PA, Case DA. J Comput Chem. 2004;25:1157. doi: 10.1002/jcc.20035. [DOI] [PubMed] [Google Scholar]
- 47.Jakalian A, Bush BL, Jack DB, Bayly CI. J Comput Chem. 2000;21:132. doi: 10.1002/jcc.10128. [DOI] [PubMed] [Google Scholar]
- 48.Jakalian A, Jack DB, Bayly CI. J Comput Chem. 2002;23:1623. doi: 10.1002/jcc.10128. [DOI] [PubMed] [Google Scholar]
- 49.Jorgensen WL, Chandrasekhar J, Madura JD, Impey RW, Klein ML. J Chem Phys. 1983;79:926. [Google Scholar]
- 50.Gotz AW, Williamson MJ, Xu D, Poole D, Le Grand S, Walker RC. J Chem Theory Comput. 2012;8:1542. doi: 10.1021/ct200909j. [DOI] [PMC free article] [PubMed] [Google Scholar]
- 51.Salomon-Ferrer R, Götz AW, Poole D, Le Grand S, Walker RC. J Chem Theory Comput. 2013;9:3878. doi: 10.1021/ct400314y. [DOI] [PubMed] [Google Scholar]
- 52.Le Grand S, Götz AW, Walker RC. Computer Physics Communications. 2013;184:374. [Google Scholar]
- 53.AMBER 16. AMBER 16. University of California; San Francisco: 2016. [Google Scholar]
- 54.Humphrey W, Dalke A, Schulten K. Journal of Molecular Graphics. 1996;14:33. doi: 10.1016/0263-7855(96)00018-5. [DOI] [PubMed] [Google Scholar]
- 55.Pettersen EF, Goddard TD, Huang CC, Couch GS, Greenblatt DM, Meng EC, Ferrin TE. Journal of Computational Chemistry. 2004;25:1605. doi: 10.1002/jcc.20084. [DOI] [PubMed] [Google Scholar]
- 56.Roe DR, Cheatham TE. Journal of Chemical Theory and Computation. 2013;9:3084. doi: 10.1021/ct400341p. [DOI] [PubMed] [Google Scholar]
- 57.Holden PM, Allen WJ, Gochin M, Rizzo RC. Bioorg Med Chem. 2014;22:651. doi: 10.1016/j.bmc.2013.10.022. [DOI] [PMC free article] [PubMed] [Google Scholar]


